. 2017 Jun;49(6):876-886.
doi: 10.1038/ng.3848. Epub 2017 Apr 24.

Stable Polycomb-dependent transgenerational inheritance of chromatin states in Drosophila

Affiliations

Stable Polycomb-dependent transgenerational inheritance of chromatin states in Drosophila

Filippo Ciabrelli et al. Nat Genet. 2017 Jun.

Abstract

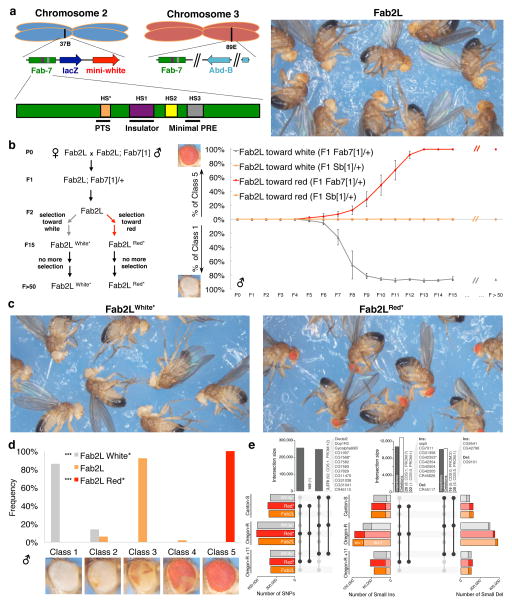
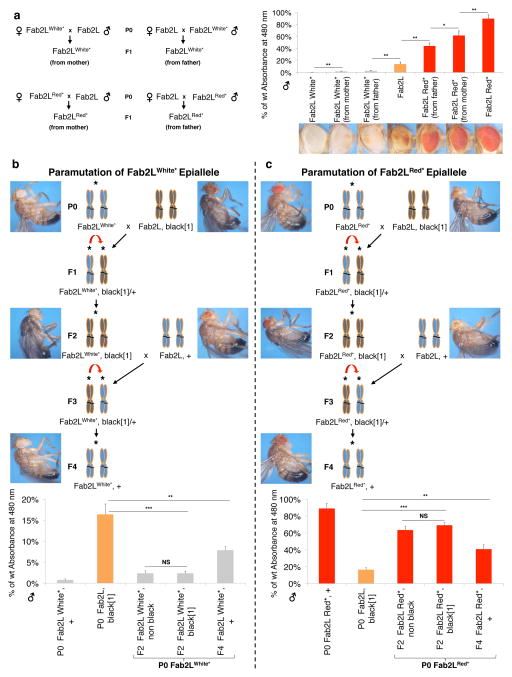
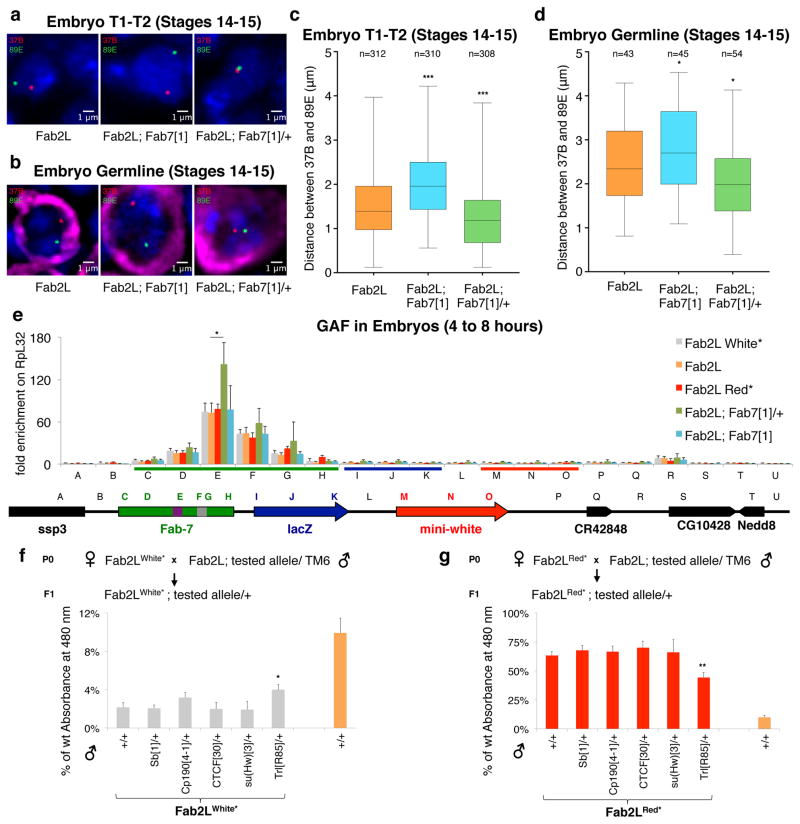
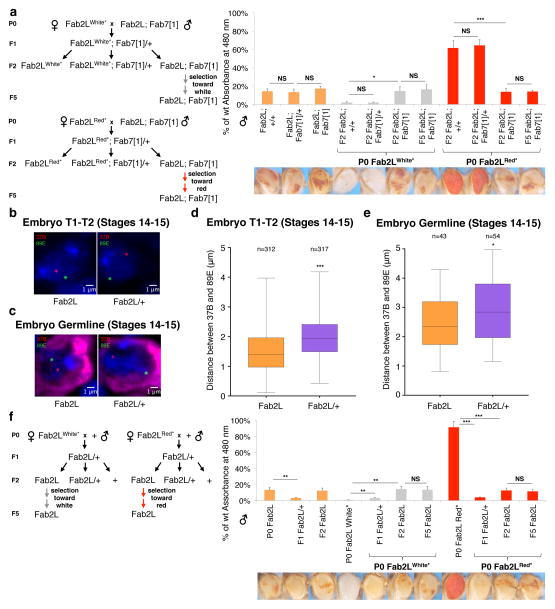
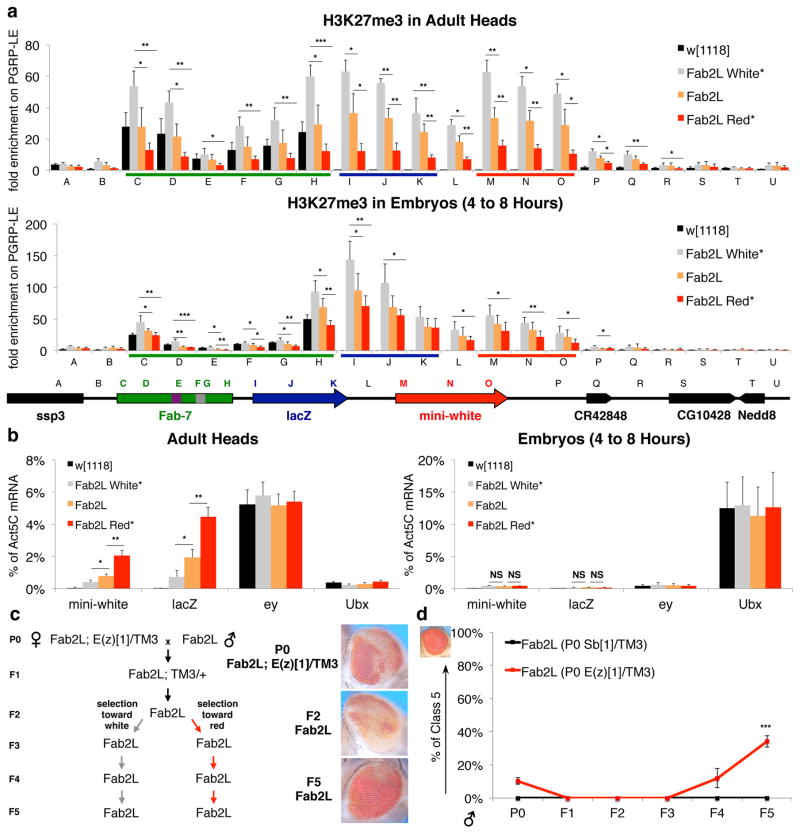
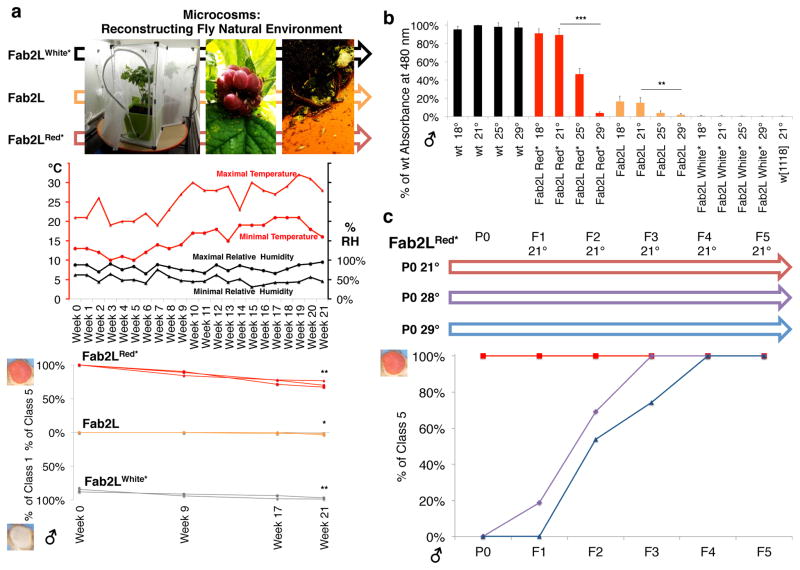
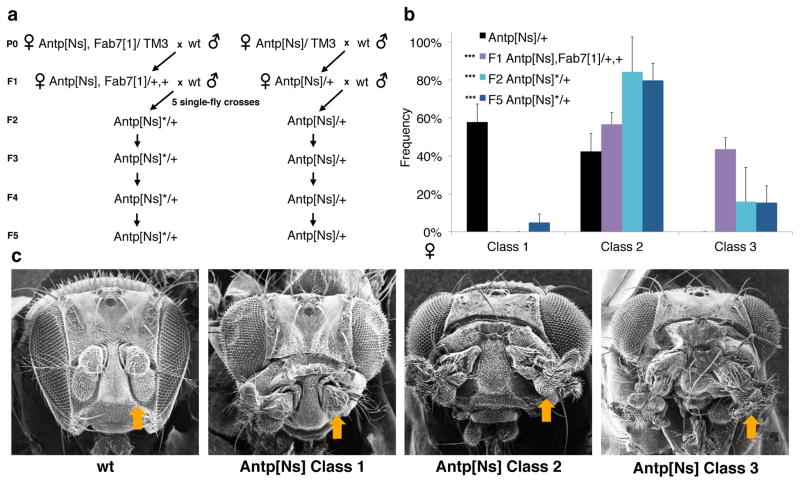
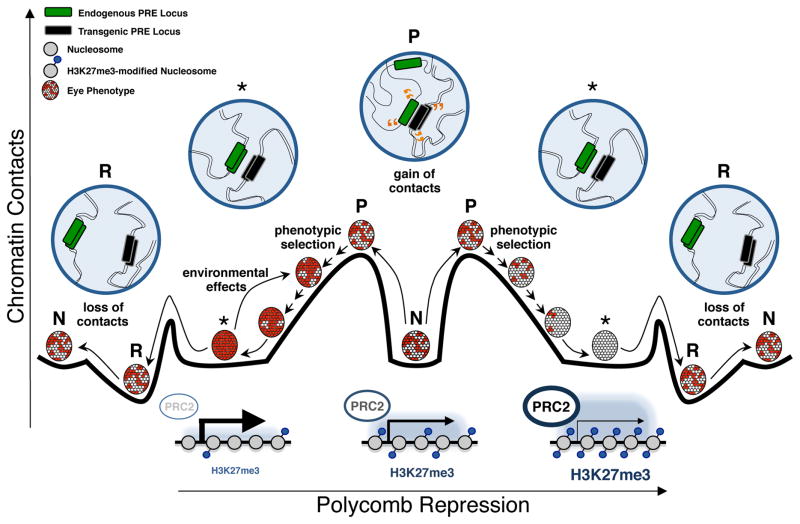
Transgenerational epigenetic inheritance (TEI) describes the transmission of alternative functional states through multiple generations in the presence of the same genomic DNA sequence. Very little is known about the principles and the molecular mechanisms governing this type of inheritance. Here, by transiently enhancing 3D chromatin interactions, we established stable and isogenic Drosophila epilines that carry alternative epialleles, as defined by differential levels of Polycomb-dependent trimethylation of histone H3 Lys27 (forming H3K27me3). After being established, epialleles can be dominantly transmitted to naive flies and can induce paramutation. Importantly, epilines can be reset to a naive state by disruption of chromatin interactions. Finally, we found that environmental changes modulate the expressivity of the epialleles, and we extended our paradigm to naturally occurring phenotypes. Our work sheds light on how nuclear organization and Polycomb group (PcG) proteins contribute to epigenetically inheritable phenotypic variability.


Conflict of interest statement

COMPETING FINANCIAL INTERESTS

The authors declare no competing financial interests.

Figures

Figure 1
Figure 1
Establishment of stable Drosophila epilines via transient genetic perturbation. (a) Illustration of Fab2L transgene insertion site in cytological position 37B and of the endogenous Fab-7 in cytological position 89E. The boxes within the Fab-7 region represent DNAse I hypersensitive sites (HS), partially overlapping with some functional elements. The right picture shows a representative sample of Fab2L males reared at 21°C. (b) Crossing scheme for the establishment of the epilines. On the right, the curves represent the percentages of Class 1 (white-eyed) and Class 5 (red-eyed) male flies at each generation. The phenotypic trends of control Fab2L; +/+ flies (Sb[1]/+ in F1) are represented in orange. The phenotypic trends of Fab2L; +/+ flies (Fab7[1]/+ F1), selected for more or less pigment, are represented in red and grey, respectively. At each generation, 6 to 12 flies of each sex were selected on a total progeny of 120>n>40 flies (n>150 for each sex in F2). Points represent the mean +/− s. d. of n=3 independent crosses. (c) Pictures showing a representative sample of Fab2LWhite* and Fab2LRed* males reared at 21°C. (d) Phenotypic classification based on eye pigment levels in Fab2LWhite* (n=200), Fab2L (n=218) and Fab2LRed* (n=229) male flies. Class 1: pigment=0%; Class 2: 0%<pigment≤5%; Class 3: 5%<pigment≤75%; Class 4: 75%<pigment<100%; Class 5: pigment=100%. (e) On the left, total number of identified SNPs and intersection between epilines. Putative phenotype-associated SNPs are those exclusively identified in a given epiline in both genetic backgrounds and across generations (second and fourth vertical bar, respectively). The total number of homozygous events is indicated in brackets. Events occurring within coding sequences (CDS) or promoters (PROM) are further detailed. On the right, same as left panel, but for the identified small insertions (Ins) and deletions (Del). w, weight, i.e. the number of discordant read pairs supporting a given structural variation. Bars represent the frequency (d) or the number of events (e); two-tailed Fisher’s exact test. NS P>0.05; * P<0.05; ** P<0.01; *** P<0.001.
Figure 2
Figure 2
Epiallele inheritance displays pseudodominance, parent-of-origin effect, and paramutagenicity. (a) Crossing schemes, eye pigmentation assays and representative pictures of the observed phenotypes in the dominance tests. (b,c) Crossing schemes, representative pictures of the observed phenotypes and eye pigmentation assays of the paramutation tests. The blue chromosomes represent chromosome 2, the grey chromosomes represent chromosome 2 carrying the black[1] allele, the black lines represent the transgenic insertion, the asterisks indicate the presence of the epiallele and the curved red lines indicate the paramutation events. The pictures display the representative body-color and eye-color phenotypes observed in the P0, F2 and F4 generations. F2 “non black” indicates flies with a wild type body color phenotype, having either a +/+ or a +/black[1] genotype. Bars represent the mean of n=3 independent crosses +/− s. d.; two-tailed Student’s t-test: NS P>0.05; * P<0.05; ** P<0.01; *** P<0.001.
Figure 3
Figure 3
Enhanced long-range chromatin interactions underlie epiallele establishment. (a,b) Representative pictures of the FISH-I assays performed in the indicated genotypes. Nuclei are stained with DAPI in blue, 37B locus is stained in red and 89E locus is stained in green. The cytoplasm of germline nuclei is stained in magenta with anti-Aubergine. Scale bar is 1 μm. (c,d,) Box plots representing the distance distributions of the FISH-I assays performed in the indicated genotypes between the 37B and the 89E loci. Distances are measured in stage 14–15 embryos in T1 and T2 segments or in the germline. The centerline represents the median, the box delimits the interquartile-range and the limits define the distribution range. In the figure, n represents the total number of nuclei analyzed from 3 embryos. (e) ChIP-qPCR assays performed in the indicated genotypes in 4 to 8 hours embryos, showing relative enrichments (ChIP/Input) for GAF, normalized to a negative control. Amplicon locations are indicated below the charts. (f,g) Crossing schemes and eye pigmentation assays performed on Fab2L (orange), Fab2LWhite* (grey) and Fab2LRed* (red) male flies, combined with the tested alleles on chromosome 3. Bars represent the mean of n=3 independent embryo collections (e) or independent crosses (f-g) +/− s. d. (e-g); two-tailed Student’s t-test: NS P>0.05; * P<0.05; ** P<0.01; *** P<0.001.
Figure 4
Figure 4
Long-range chromatin interactions are necessary for epiallele maintenance. (a,f) Crossing schemes, eye pigmentation assays and representative pictures of the observed phenotypes in the epiallele maintenance tests. (b,c) Representative pictures of the FISH-I assays performed in the indicated genotypes. Nuclei are stained with DAPI in blue, 37B locus is stained in red and 89E locus is stained in green. The cytoplasm of germline nuclei is stained in magenta with anti-Aubergine. Scale bar is 1 μm. (d,e) Box plots representing the distance distributions of the FISH-I assays performed in the indicated genotypes between the 37B and the 89E loci. Distances are measured in stage 14–15 embryos in T1 and T2 segments or in the germline. The centerline represents the median, the box delimits the interquartile-range and the limits define the distribution range. In the figure, n represents the total number of nuclei analyzed from 3 embryos. Bars represent the mean of n=3 independent crosses +/− s. d. (a,f); two-tailed Student’s t-test: NS P>0.05; * P<0.05; ** P<0.01; *** P<0.001.
Figure 5
Figure 5
PRC2 activity determines alternative chromatin states of the epialleles. (a) ChIP-qPCR assays performed on w[1118], Fab2LWhite*, Fab2L and Fab2LRed* male adult heads and 4 to 8 hours embryos, showing relative enrichments (ChIP/Input) for H3K27me3, normalized to a negative control. Amplicon locations are indicated below the charts. (b) RT-qPCR assays performed on w[1118], Fab2LWhite*, Fab2L and Fab2LRed* male adult heads, and 4 to 8 hours embryos, measuring relative mRNA levels normalized to Act5C. (c) Crossing schemes and representative pictures of the observed phenotypes in the P0, F2 and F5 in the epiallele establishment test. (d) Curves in the chart representing the percentage of Class 5 (pigment=100%) male flies at each generation during the phenotypic selection. The phenotypic trend of Fab2L; +/+ flies that had the control Sb[1] allele during the P0, selected for more pigment, is represented in black. The phenotypic trend of Fab2L; +/+ flies that had the E(z)[1] allele in the P0, selected for more pigment, is represented in red. At each generation, 6 to 8 flies for each sex were selected on a total progeny of 30>n>60 individuals. Bars represent the mean +/− s. d. of n=3 independent collections of adult heads for ChIP or RT-qPCR (a,b), or embryos for RT-qPCR (b); n=4 for embryo ChIP (a); Error bars in panel d represent s. d. of n=3 independent crosses; two-tailed Student’s t-test: NS P>0.05; * P<0.05; ** P<0.01; *** P<0.001.
Figure 6
Figure 6
Environmental effects on the epialleles. (a) Schematic representation and illustrative pictures of epiline exposure to natural conditions. The top chart shows maximal and minimal temperature and relative humidity in the reproduced weeks. The bottom chart represent the percentage of Class 1 (pigment=0%) and percentage of Class 5 (pigment=100%) flies at 4 time points; n=3 independent fly populations exposed; linear mixed-model analysis between Week 0 and Week 21 time points: NS P>0.05; * P<0.05; ** P<0.01; *** P<0.001. (b) Eye pigmentation assays performed on wt, Fab2LRed*, Fab2L, Fab2LWhite* and w[1118] male and flies after at least two-generation exposure to the indicated temperatures. Bars represent the mean of n=3 independent fly collections +/− s. d.; two-tailed Student’s t-test: NS P>0.05; * P<0.05; ** P<0.01; *** P<0.001. (c) Self-crossing scheme performed at 21°C, starting from Fab2LRed* flies previously reared at 21°C, 28°C or 29°C. Phenotypic classification of the eye pigment levels. The curves in the chart represent the percentage of Class 5 (pigment=100%) male flies at each generation. At each point n>30 male flies were scored.
Figure 7
Figure 7
TEI of a homeotic trait. (a) Crossing schemes and (b) charts representing the phenotypic distributions of the Antp[Ns] homeotic transformation phenotype in adult females for each generation. (c) Representative pictures, showing phenotypic distribution of the Antp[Ns] homeotic transformation phenotype. The yellow arrows in the pictures indicate the transformation phenotypes. Phenotypic classification of the antenna to leg transformation phenotype. Class 1: weak transformation; Class 2: medium transformation; Class 3: severe transformation. Bars represent the mean of the frequencies of n=5 parallel single-fly crosses, deriving from independent recombination events in the F1, +/− s. d.; two-tailed Fisher’s exact test: NS P>0.05; * P<0.05; ** P<0.01; *** P<0.001. Fisher’s exact test was applied on the pooled populations from the 5 independent single-fly crosses at each generation. After pooling, flies were n>50 for each genotype.
Figure 8
Figure 8
Epiallele induction by long-range chromatin interactions and differential H3K27me3 marking. In this schematic representation, summarizing epiallele establishment and reversion, the variegated eye represents the naïve “N” epigenetic state of Fab2L flies. After a gain in chromatin contacts between the endogenous locus and the transgenic locus, the latter acquires a primed “P” epigenetic state. The primed “P” epigenetic state has the potential to reach a stable “ * ” epigenetic state, upon phenotypic selection. The stable “ * ” epigenetic state can be modulated by environmental factors, and it can be stably reverted by a loss of chromatin contacts, into a “R” epigenetic state. The bottom pictures represent the corresponding chromatin states of the naïve flies and the epilines. They show increasing enrichments for the H3K27me3 mark and an opposite trend for their transcriptional states.

References

    1. Jablonka E, Raz G. Transgenerational Epigenetic Inheritance: prevalence, mechanisms and implications for the study of heredity and evolution. The Quarterly Review Of Biology. 2009;84 - PubMed
    1. Danchin E, et al. Beyond DNA: integrating inclusive inheritance into an extended theory of evolution. Nat Rev Genet. 2011;12:475–86. - PubMed
    1. Heard E, Martienssen RA. Transgenerational epigenetic inheritance: myths and mechanisms. Cell. 2014;157:95–109. - PMC - PubMed
    1. Lim JP, Brunet A. Bridging the transgenerational gap with epigenetic memory. Trends Genet. 2013;29:176–86. - PMC - PubMed
    1. Daxinger L, Whitelaw E. Understanding transgenerational epigenetic inheritance via the gametes in mammals. Nat Rev Genet. 2012;13:153–62. - PubMed

MeSH terms