

Use of short interfering RNA delivered by cationic liposomes to enable efficient down-regulation of PTPN22 gene in human T lymphocytes
- PMID: 28437437
- PMCID: PMC5402975
- DOI: 10.1371/journal.pone.0175784
Use of short interfering RNA delivered by cationic liposomes to enable efficient down-regulation of PTPN22 gene in human T lymphocytes
Abstract
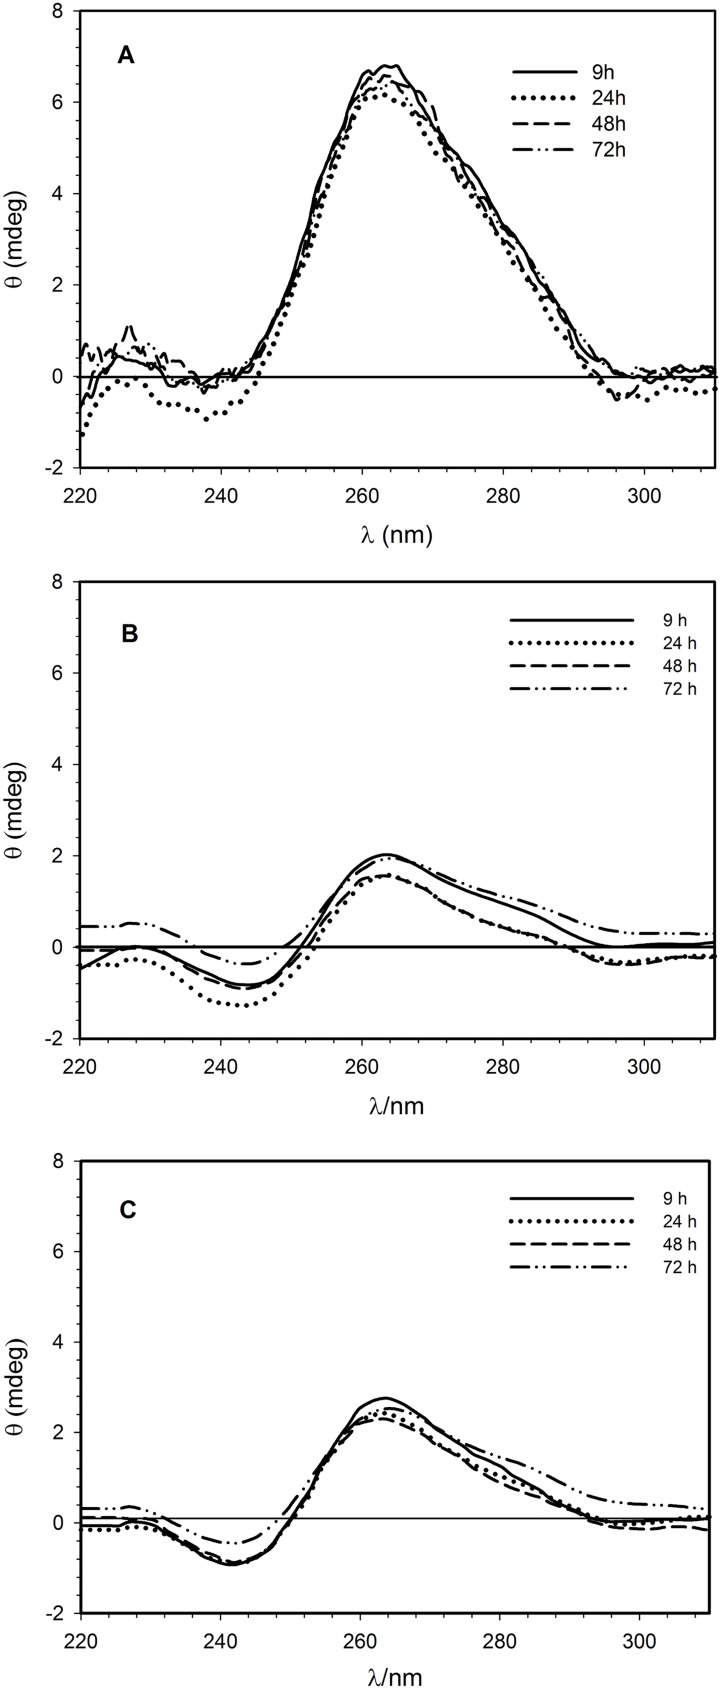
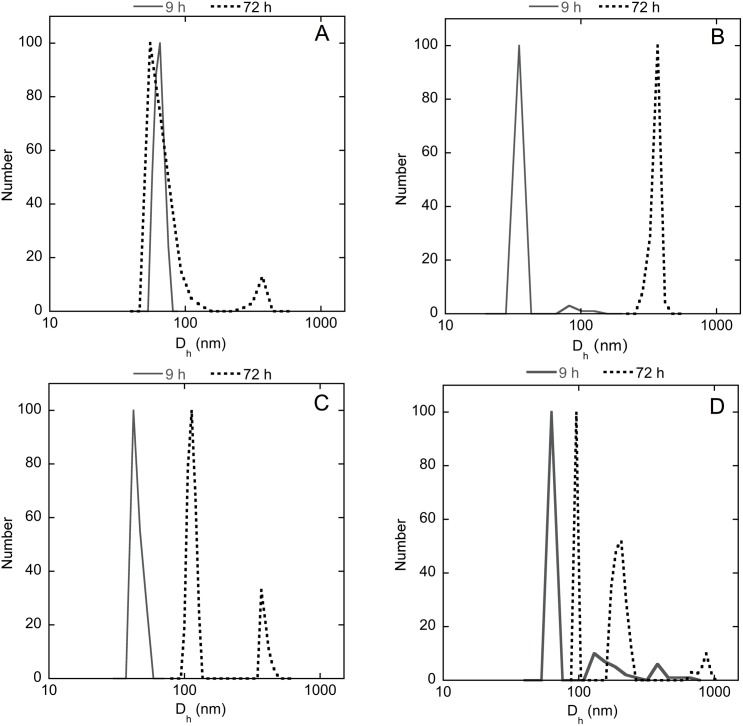
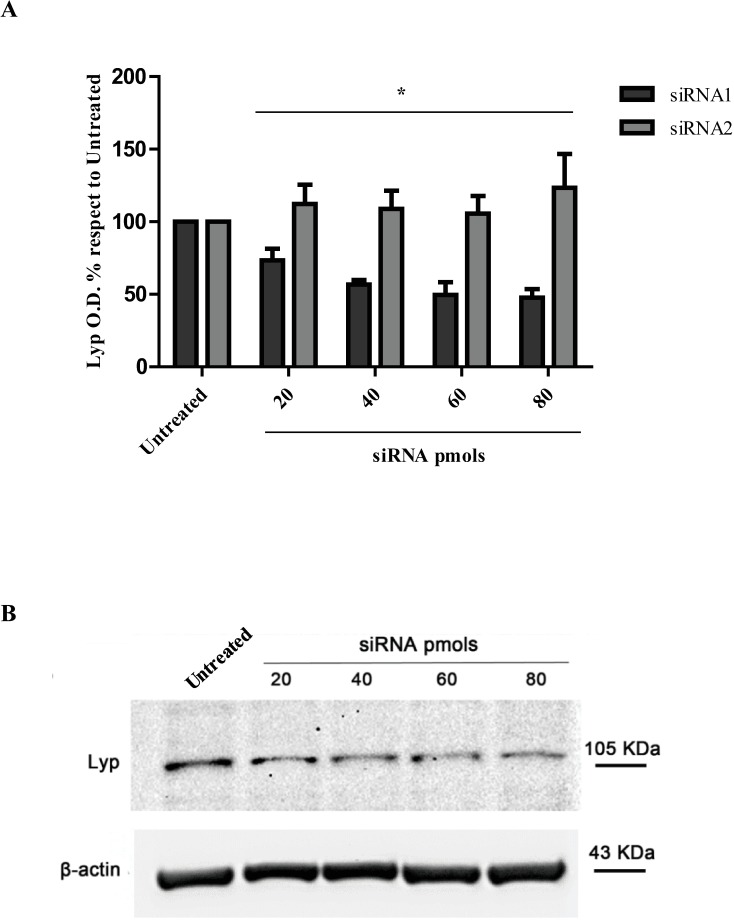
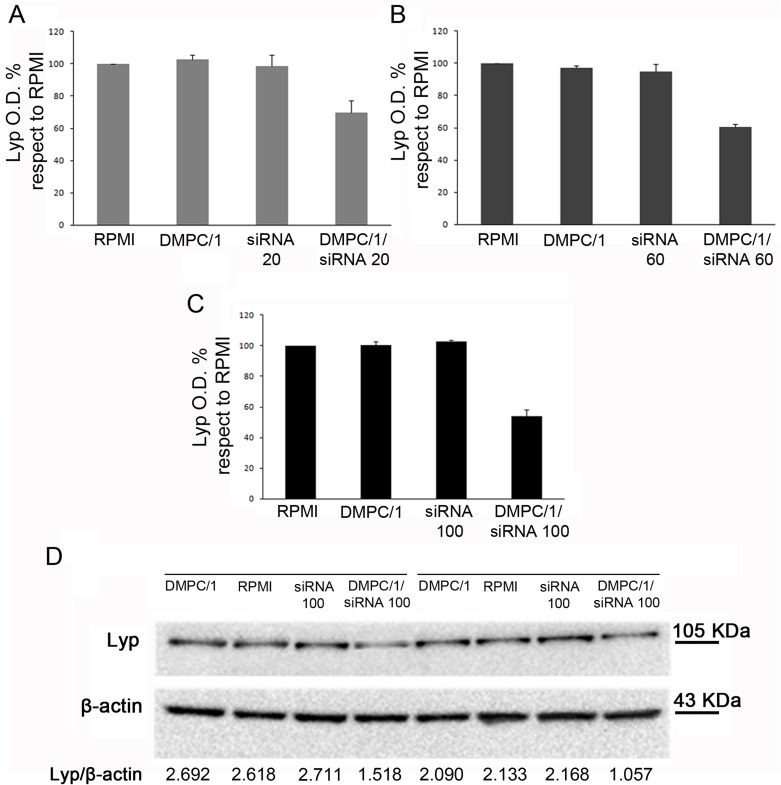
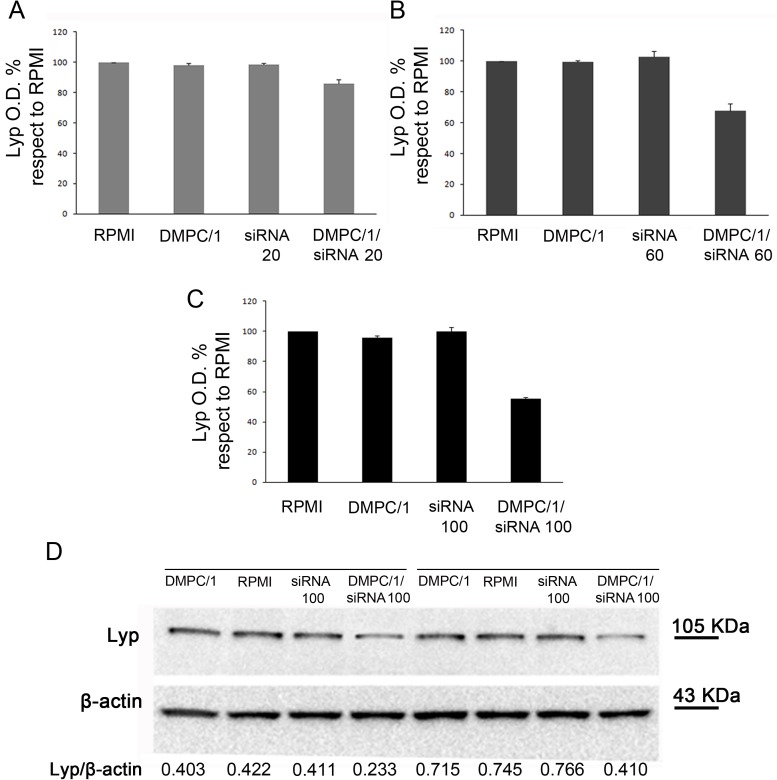
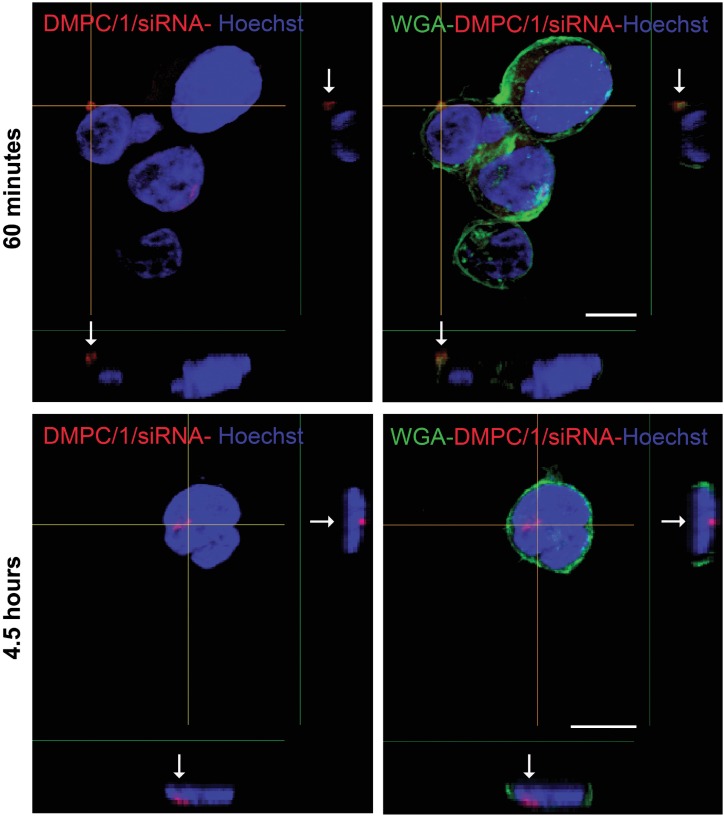
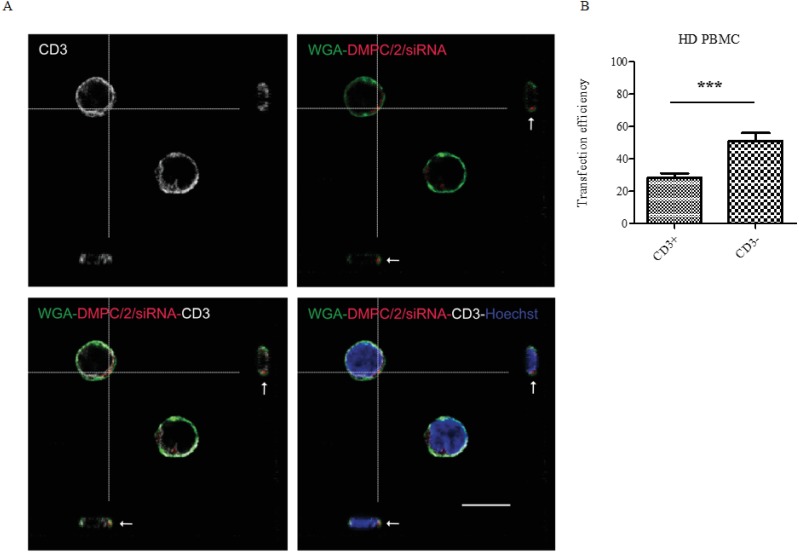
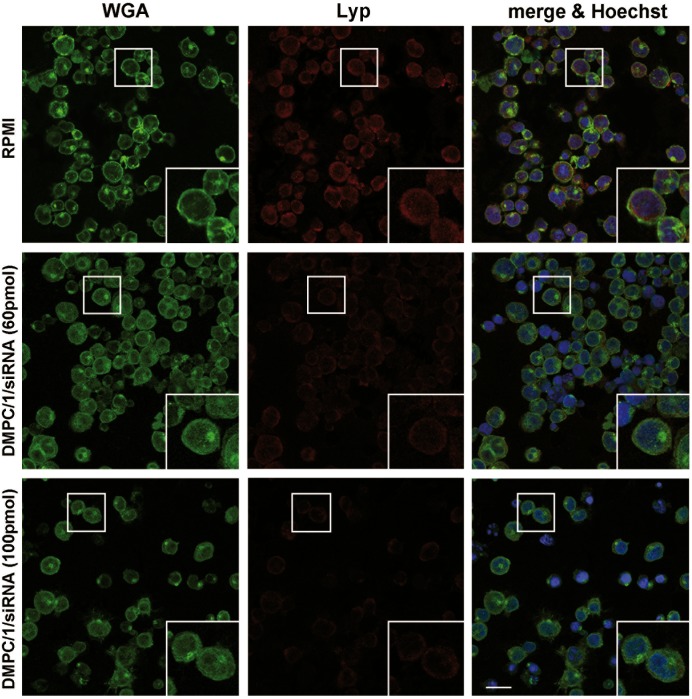
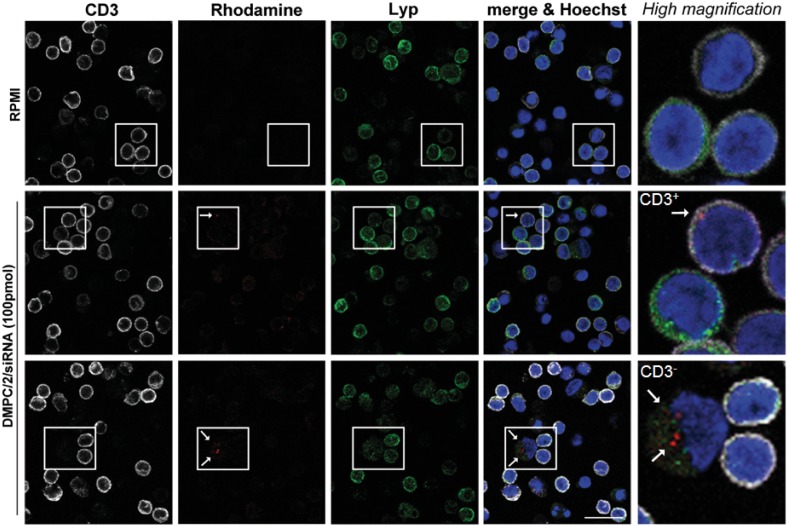
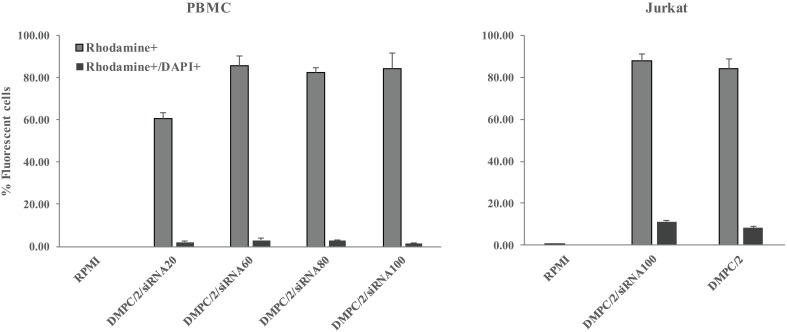
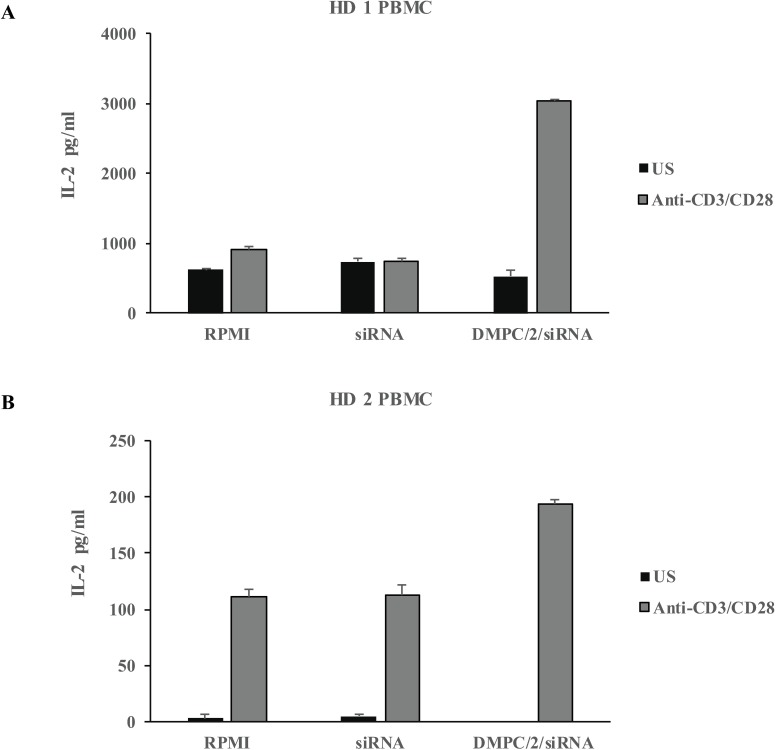
Type 1 diabetes and thyroid disease are T cell-dependent autoimmune endocrinopathies. The standard substitutive administration of the deficient hormones does not halt the autoimmune process; therefore, development of immunotherapies aiming to preserve the residual hormonal cells, is of crucial importance. PTPN22 C1858T mutation encoding for the R620W lymphoid tyrosine phosphatase variant, plays a potential pathophysiological role in autoimmunity. The PTPN22 encoded protein Lyp is a negative regulator of T cell antigen receptor signaling; R620W variant, leading to a gain of function with paradoxical reduced T cell activation, may represent a valid therapeutic target. We aimed to develop novel wild type PTPN22 short interfering RNA duplexes (siRNA) and optimize their delivery into Jurkat T cells and PBMC by using liposomal carriers. Conformational stability, size and polydispersion of siRNA in lipoplexes was measured by CD spectroscopy and DLS. Lipoplexes internalization and toxicity evaluation was assessed by confocal microscopy and flow cytometry analysis. Their effect on Lyp expression was evaluated by means of Western Blot and confocal microscopy. Functional assays through engagement of TCR signaling were established to evaluate biological consequences of down-modulation. Both Jurkat T cells and PBMC were efficiently transfected by stable custom lipoplexes. Jurkat T cell morphology and proliferation was not affected. Lipoplexes incorporation was visualized in CD3+ but also in CD3- peripheral blood immunotypes without signs of toxicity, damage or apoptosis. Efficacy in affecting Lyp protein expression was demonstrated in both transfected Jurkat T cells and PBMC. Moreover, impairment of Lyp inhibitory activity was revealed by increase of IL-2 secretion in culture supernatants of PBMC following anti-CD3/CD28 T cell receptor-driven stimulation. The results of our study open the pathway to future trials for the treatment of autoimmune diseases based on the selective inhibition of variant PTPN22 allele using lipoplexes of siRNA antisense oligomers.
Conflict of interest statement
Figures
Similar articles
-
Improvement of Lipoplexes With a Sialic Acid Mimetic to Target the C1858T PTPN22 Variant for Immunotherapy in Endocrine Autoimmunity.Front Immunol. 2022 Mar 9;13:838331. doi: 10.3389/fimmu.2022.838331. eCollection 2022. Front Immunol. 2022. PMID: 35355982 Free PMC article.
-
Preparation and In Vitro Evaluation of RITUXfab-Decorated Lipoplexes to Improve Delivery of siRNA Targeting C1858T PTPN22 Variant in B Lymphocytes.Int J Mol Sci. 2021 Dec 30;23(1):408. doi: 10.3390/ijms23010408. Int J Mol Sci. 2021. PMID: 35008834 Free PMC article.
-
Exploiting novel tailored immunotherapies of type 1 diabetes: Short interfering RNA delivered by cationic liposomes enables efficient down-regulation of variant PTPN22 gene in T lymphocytes.Nanomedicine. 2019 Jun;18:371-379. doi: 10.1016/j.nano.2018.11.001. Epub 2018 Nov 12. Nanomedicine. 2019. PMID: 30439564
-
The putative role of the C1858T polymorphism of protein tyrosine phosphatase PTPN22 gene in autoimmunity.Autoimmun Rev. 2013 May;12(7):717-25. doi: 10.1016/j.autrev.2012.12.003. Epub 2012 Dec 20. Autoimmun Rev. 2013. PMID: 23261816 Review.
-
Lymphoid-specific tyrosine phosphatase (Lyp): a potential drug target for treatment of autoimmune diseases.Curr Drug Targets. 2014 Mar;15(3):335-46. doi: 10.2174/13894501113146660236. Curr Drug Targets. 2014. PMID: 24188455 Review.
Cited by
-
Nanocarriers as a powerful vehicle to overcome blood-brain barrier in treating neurodegenerative diseases: Focus on recent advances.Asian J Pharm Sci. 2019 Sep;14(5):480-496. doi: 10.1016/j.ajps.2018.09.005. Epub 2018 Oct 22. Asian J Pharm Sci. 2019. PMID: 32104476 Free PMC article. Review.
-
Improvement of Lipoplexes With a Sialic Acid Mimetic to Target the C1858T PTPN22 Variant for Immunotherapy in Endocrine Autoimmunity.Front Immunol. 2022 Mar 9;13:838331. doi: 10.3389/fimmu.2022.838331. eCollection 2022. Front Immunol. 2022. PMID: 35355982 Free PMC article.
-
Preparation and In Vitro Evaluation of RITUXfab-Decorated Lipoplexes to Improve Delivery of siRNA Targeting C1858T PTPN22 Variant in B Lymphocytes.Int J Mol Sci. 2021 Dec 30;23(1):408. doi: 10.3390/ijms23010408. Int J Mol Sci. 2021. PMID: 35008834 Free PMC article.
-
Genetic Polymorphism of PTPN22 in Autoimmune Diseases: A Comprehensive Review.Medicina (Kaunas). 2022 Aug 2;58(8):1034. doi: 10.3390/medicina58081034. Medicina (Kaunas). 2022. PMID: 36013501 Free PMC article. Review.
-
Crispr/Cas Mediated Deletion of PTPN22 in Jurkat T Cells Enhances TCR Signaling and Production of IL-2.Front Immunol. 2018 Nov 12;9:2595. doi: 10.3389/fimmu.2018.02595. eCollection 2018. Front Immunol. 2018. PMID: 30483260 Free PMC article.
References
-
- Effraimidis G, Wiersinga WM. Mechanisms in endocrinology: autoimmune thyroid disease: old and new players. Eur J Endocrinol. 2014; 170: R241–252. doi: 10.1530/EJE-14-0047 - DOI - PubMed
-
- McLachlan SM, Rapoport B. Breaking tolerance to thyroid antigens: changing concepts in thyroid autoimmunity. Endocr Rev. 2014; 35: 59–105. doi: 10.1210/er.2013-1055 - DOI - PMC - PubMed
-
- Atkinson MA, Eisenbarth GS, Michels AW. Type 1 diabetes. Lancet 2014; 383: 69–82. doi: 10.1016/S0140-6736(13)60591-7 - DOI - PMC - PubMed
-
- Boitard C. Pancreatic islet autoimmunity. Presse Med. 2012; 41: e636–650. doi: 10.1016/j.lpm.2012.10.003 - DOI - PubMed
-
- Kakleas K, Soldatou A, Karachaliou F, Karavanaki K. Associated autoimmune diseases in children and adolescents with type 1 diabetes mellitus (T1D). Autoimmun Rev. 2015; 14: 781–797. doi: 10.1016/j.autrev.2015.05.002 - DOI - PubMed
MeSH terms
Substances
LinkOut - more resources
Full Text Sources
Other Literature Sources
Molecular Biology Databases
