. 2017 Jun 1;546(7656):118-123.
doi: 10.1038/nature22327. Epub 2017 Apr 24.

Phase-plate cryo-EM structure of a class B GPCR-G-protein complex

Affiliations

Phase-plate cryo-EM structure of a class B GPCR-G-protein complex

Yi-Lynn Liang et al. Nature. .

Abstract

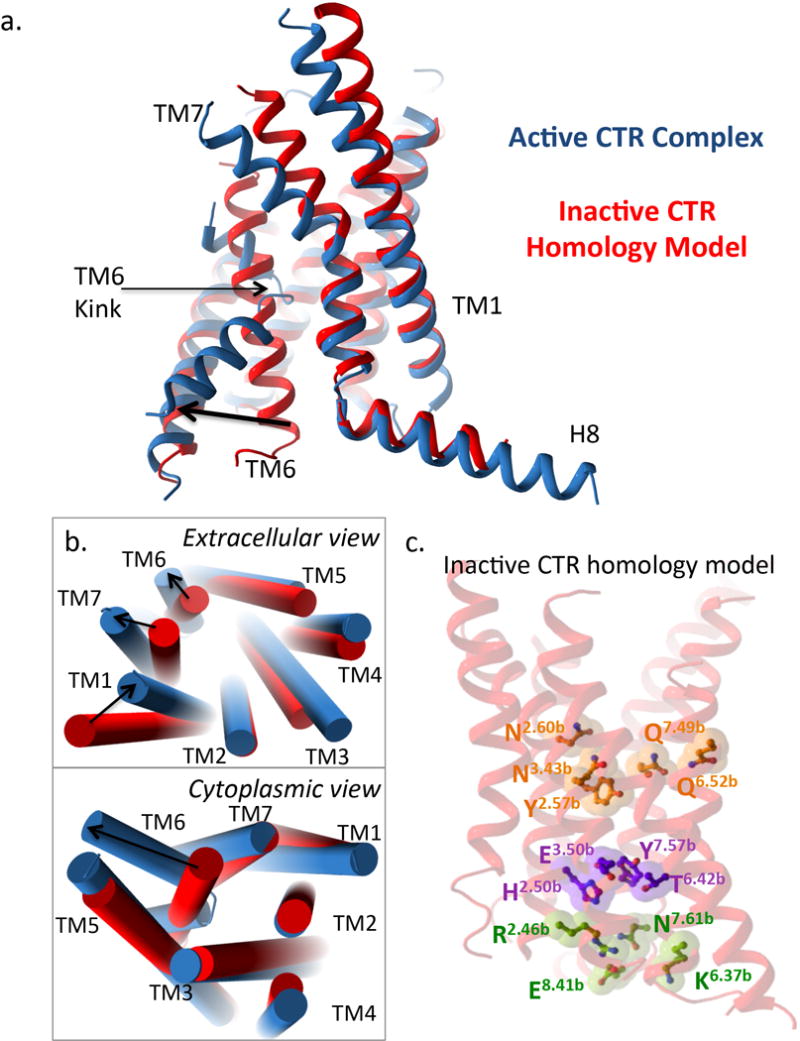
Class B G-protein-coupled receptors are major targets for the treatment of chronic diseases, such as osteoporosis, diabetes and obesity. Here we report the structure of a full-length class B receptor, the calcitonin receptor, in complex with peptide ligand and heterotrimeric Gαsβγ protein determined by Volta phase-plate single-particle cryo-electron microscopy. The peptide agonist engages the receptor by binding to an extended hydrophobic pocket facilitated by the large outward movement of the extracellular ends of transmembrane helices 6 and 7. This conformation is accompanied by a 60° kink in helix 6 and a large outward movement of the intracellular end of this helix, opening the bundle to accommodate interactions with the α5-helix of Gαs. Also observed is an extended intracellular helix 8 that contributes to both receptor stability and functional G-protein coupling via an interaction with the Gβ subunit. This structure provides a new framework for understanding G-protein-coupled receptor function.


Conflict of interest statement

The authors declare no competing financial interests for this manuscript.

Figures

Extended Data Figure 1
Extended Data Figure 1. Schematic of the CTR used in the study
In our construct HA-FLAG-3C-CTR-3C-8xHis, the native signal peptide of the CTR (residues 2-24) was replaced with an HA signal peptide (red), FLAG epitope (green) and a 3C cleavage site (yellow). The C-terminus was modified with a 3C cleavage site (yellow) and a His epitope (blue). Also highlighted on the schematic are consensus glycosylation sites (purple) and class B GPCR conserved disulphide bonds. Residues highlighted in bold are the most conserved residue in each helix and represent residues X.50 for each helix according to the class B GPCR numbering. The location of the 16 amino acid insertion within ICL1 for a common splice variant of the CTR (CTRb) is shown. In addition, the locations of the truncation sites within the CTR C-terminus/H8 assessed in this study are also highlighted.
Extended Data Figure 2
Extended Data Figure 2. Pharmacology of the CTR construct used in this study
a-d Pharmacological assessment in mammalian Cos7 cells (a, b) and HiveFive insect cells (c,d) of the untagged CTR and the construct shown in Extended Data Figure 1 (HA-FLAG-3C-CTR-3C-8xHis). The presence of purification tags does not alter receptor pharmacology. a, Radioligand competition binding for sCT in competition with the radiolabelled ligand 125I-sCT(8-32) in whole cells transiently expressing the WT or HA-FLAG-3C-CTR-3C-8xHis CTR. Data are normalized to maximum 125I-sCT(8-32) with nonspecific measured in the presence of 1μM unlabelled sCT(8-32). b, Concentration response curves assessing Gs activation via measurement of cAMP accumulation at the WT and HA-FLAG-3C-CTR-3C-8xHis CTR in the presence of sCT. c Radioligand competition binding for sCT in competition with the radiolabelled ligand 125I-sCT(8-32) performed with HA-FLAG-3C-CTR-3C-8xHis in the presence of Gs protein heterotrimer reveal similar affinity in insect cells vs mammalian cells. The presence of Nb35 does not alter ligand affinity. d, Concentration response curves to assess G protein activation by HA-FLAG-3C-CTR-3C-8xHis via GTPγS binding in the absence and presence of Gs protein heterotrimer reveals the tagged CTR can robustly activate Gs in insect cells. e, GTPγS binding to the HA-FLAG-3C-CTR-3C-8xHis in the presence of 1μM sCT is inhibited by increasing concentrations of Nb35. All data are mean + SEM of four independent experiments, conducted in duplicate or triplicate.
Extended Data Figure 3
Extended Data Figure 3. Expression and purification of the sCT:CTR:Gs complex
a, Flow chart of the purification steps for the hCTR-Gs complex. b, SDS-PAGE/Western Blot of samples obtained at various stages of hCTR-Gs purification. hCTR, Gs heterotrimer were co-expressed in insect cell membrane. Addition of the agonist salmon calcitonin initiates complex formation and was solubilised by detergent. Solubilised hCTR and hCTR-Gs complex was immobilised on FLAG antibody resin. FLAG eluted fractions were further purified by SEC. An anti-His antibody was used to detect FLAG-CTR-His, Gβ-His and Nb35-His (red) and an anti-Gs antibody was used to detect Gαs (green). c, Representative elution profile of FLAG purified complex on Superdex 200 Increase 10/30 SEC (top). SEC fractions containing hCTR-Gs complex (within dashed lines) were pooled, concentrated and analyzed by SEC on Superose 6 Increase 10/30 column (bottom). d, SDS-PAGE/Coomasie blue stain of the purified complex concentrated from the Superose 6 Increase 10/30 column. e, The stability of the purified hCTR-Gs was monitored by SEC following incubation at 4°C for 5 days.
Extended Data Figure 4
Extended Data Figure 4. Cryo-EM of the sCT:CTR:Gs complex
a, Representative Volta phase plate cryo-EM micrograph of the sCT:CTR:Gs complex (scale bar: 15 nm). b, Reference-free two-dimensional averages of the complex in MNG/CHS micelle. c, “Gold standard” Fourier shell correlation (FSC) curves, showing the overall nominal resolution at 4.1 Å and 3.8 Å on the stable region including TM domain and Gs protein complex without AHD. d, Final three-dimensional density map colored according to local resolution. e, FSC curves of the final refined model versus the final cryo-EM map (full dataset, black), of the outcome of model refinement with a half map versus the same map (red), and of the outcome of model refinement with a half map versus the other half map (green). At FSC=0.5, the resolution is 4.1 Å. f, EM density of TM1, TM5, TM6, TM7 and Helix 8.
Extended Data Figure 5
Extended Data Figure 5. Flexibility of ECD and AHD in the sCT:CTR:Gs complex
Representative maps from three-dimensional classification showing the dynamics of ECD and AHD. The overlaid maps are shown from top and side views. In the right panel the blue, green, purple and red density maps show the 4 3D classifications. These are overlayed on the left to demonstrate the observed flexibility on the Gαs AHD and the CTR ECD.
Extended Data Figure 6
Extended Data Figure 6. The N-terminal ECD of the CTR
a, Rigid body fitting of the structure of CTR ECD bound to sCT (PDB: 5II0) into the corresponding regions of the cryo-EM map revealed additional density (close to residue 130) that may be attributed to glycosylation. b-d, Asp mutation of four consensus glycosylation residues (N28D, N73D, N125D and N130D) reveals little role of glycosylation on cell surface expression (b), determined via a cell surface ELISA to the N-terminal epitope tag. c, Competition radioligand binding studies for sCT in competition with the radiolabelled ligand 125I-sCT(8-32) revealed reduced affinity for N130D, and to a lesser extent N125D compared to the WT CTR. d, Concentration response curves for cAMP accumulation for mutant receptors relative to WT show that N130D and to a lesser extent N125D also reduce the potency of sCT in functional experiments. All data are + SEM of five independent experiments, conducted in duplicate or triplicate.
Extended Data Figure 7
Extended Data Figure 7. Molecular modelling of sCT peptide reveals potential interactions between peptide and receptor
Cryo-EM density is shown in yellow fill, the sCT peptide model in yellow cartoon and the CTR in blue cartoon. a, Gln14 in sCT is predicted to form interactions with the backbone of ECL2 and b, Ser5, Thr6 are predicted to form hydrogen bonds with His302 in TM5 of the CTR, while Leu4 points down into the bundle towards TM6. c, Mutation of H302 to Ala (H302A) results in reduced potency for sCT in cAMP production (left) and phosphorylation of ERK1/2 (right) when expressed in 3T3-FlpIn cells. This supports a role H302 in sCT affinity. Data are the means + S.E.M of four independent experiments performed in duplicate
Extended Data Figure 8
Extended Data Figure 8. Comparisons of an inactive CTR homology model and the activated CTR structure
a, side view of the sCT/CTR/Gs receptor TM activated structure (blue) relative to the inactive CTR homology model (red). b, Tube representation for TM’s showing extracellular (top) and cytoplasmic (bottom) views of the sCT/CTR/Gs receptor TM activated structure (blue) relative to the inactive CTR homology model (red). In (a) and (b) large differences are observed at the extracellular ends of TM6 and TM7, with additional differences within TM1 and TM5. In addition, a very large outward movement is observed within TM6 of the active structure relative to the inactive homology model at the intracellular face. c, The positions of class B conserved polar residues located within the inactive CTR homology model.
Extended Data Figure 9
Extended Data Figure 9. CTR-Gs protein interactions
a, The α5-helix of Gαs (orange) docks into a cavity formed on the intracellular side of the receptor (blue) by the opening of TM6. G protein side chains within this cavity are supported by the cryo-EM map. b, H8 of the CTR forms an amphipathic helix with multiple bulky aromatics heavily embedded within the detergent micelle that are evident in the map. Residues within the more polar face of H8 are in the vicinity of Gβ, where they likely form polar interactions, although specific side chain density in this region is not evident. c, ICL1 is located in close proximity to the G protein. A common CTR splice variant contains a 16 amino acid insertion within this loop (between Arg174 and Ser175), an insertion that would sterically hinder G protein interactions with the receptor.
Extended Data Figure 10
Extended Data Figure 10. Comparison of the activated β2AR and CTR viewed from the extracellular face
Tube representation of the TMs of the CTR (blue) and β2AR (green) viewed from the cytoplasmic face (based on overlay of the Gs protein from each structure). Despite similarities in the position of TM tips at the intracellular face, there are very significant differences in location of the extracellular TM tips highlighting significant differences in the ligand binding mode and initiation of receptor activation between class A and B GPCRs.
Figure 1
Figure 1. The sCT:CTR:Gs Cryo-EM structure
a, Orthogonal views of the cryo-EM map. The sharpened map with variably colored densities (CTR TM:blue, sCT:yellow, heterotrimeric Gs:copper, light blue, purple, Nb35:red) is overlaid with the non-sharpened map in transparency showing density for the ECD. b, Structure of the complex determined after refinement in the cryo-EM map. c, Snapshots of map versus model from TM segments, RasGα α-helix 5 and Gβ.
Figure 2
Figure 2. The CTR TM bundle orthosteric peptide binding site
a, Cryo-EM density (yellow fill) for sCT in the CTR 7TM bundle (blue); The sCT N terminus sits one helical turn above a conserved polar network. Molecular models of the sCT backbone (yellow ribbon) align well with the density, however side chain density is not visible. b, Modelling suggests that the sCT hydrophobic face resides in a hydrophobic receptor environment formed by residues in TM1, TM2, TM3 and TM7.
Figure 3
Figure 3. Comparisons of inactive class B and the activated CTR structures
a, Side (left), extracellular (middle) and cytoplasmic (right) views of the sCT/CTR/Gs (blue) relative to inactive CRF-1R (PDB: 4Z9G, yellow) and GCGR (PDB: 5EE7, purple) structures. Differences in TMs at the extracellular and cytoplasmic faces are highlighted. b, The positions of class B conserved polar residues located within the activated CTR bundle (left), the inactive GCGR (middle) and the CP-376395 bound CRF-1R (right). The central polar network likely forms interactions in all structures, while the TM2-3-6-7 and TM2-6-7-H8 networks that stabilise class B inactive structures (as in the GCGR) are disrupted in the activated CTR. In the CRF-1R, CP-376395 binding also disrupts these interactions.
Figure 4
Figure 4. CTR-G protein interactions
a, α5-helix of Gαs (orange) docks into a CTR intracellular face cavity (blue) by the opening of TM6, forming polar and non-polar interactions. H41 at the Gαs αN-β1 boundary interacts with the CTR ICL2 backbone. b, CTR H8 bulky aromatics heavily embed within the detergent micelle. Residues on the opposing face are in the vicinity of Gβ, where they likely form polar interactions. c, CTR pharmacological characterisation in COS7 cells following gradual deletion of the C-terminus. Left; deletion after Trp406 (Δ407) results in heavily reduced cell surface expression. Further truncation after Gln399 (Δ400) further reduced cell surface expression highlighting bulky, detergent buried residues within H8 are crucial for CTR cell surface localisation. Middle; Δ407 and Δ400 had reduced maximal responses for cAMP production relative to WT. Right; Calculation of cAMP efficacy via application of the Black-Leff operational model to cAMP accumulation data, followed by correction for alterations in cell surface expression, reveal Δ407 has reduced cAMP efficacy (Logτc) that is not further reduced by additional truncation back to Gln399. This indicates residues Thr400-Trp406 are crucial for cAMP efficacy that may be associated with their interaction with Gβ. Pharmacological data are the mean ± S.E.M of 5 independent experiments performed in duplicate. * Statistically different from WT using one-way analysis of variance followed by Dunnett’s test (P<0.05).
Figure 5
Figure 5. Comparison of a class A and class B GPCR Gs ternary complex
a, Side view of the CTR:Gs complex (blue:CTR, orange:Gαs, aquamarine:Gβ, purple:Gγ, red:Nb35) aligned to the G protein complex (Gαβγ) of the β2AR:Gs complex (grey:G protein, green:β2AR). The G protein closely aligns in the two structures. There are major differences between the receptor TM domains at the extracellular surface. CTR has a more kinked TM6 and a longer H8; β2AR TM5 cytoplasmic face is extended. b, CTR (blue) and β2AR (green) TMs viewed from the cytoplasmic face. The intracellular TM tips (with the exception of TM4) overlay, highlighting conserved movements within the intracellular face of class A and B GPCRs for Gs coupling.

Comment in

References

    1. Congreve M, Marshall F. The impact of GPCR structures on pharmacology and structure-based drug design. Br J Pharmacol. 2010;159:986–996. - PMC - PubMed
    1. Kenakin T, Miller LJ. Seven transmembrane receptors as shapeshifting proteins: the impact of allosteric modulation and functional selectivity on new drug discovery. Pharmacol Rev. 2010;62:265–304. - PMC - PubMed
    1. Zhang D, Zhao Q, Wu B. Structural studies of G protein-coupled receptors. Mol Cells. 2015;38:836–842. - PMC - PubMed
    1. Rasmussen SG, et al. Crystal structure of the beta2 adrenergic receptor-Gs protein complex. Nature. 2011;477:549–555. - PMC - PubMed
    1. Hollenstein K, et al. Structure of class B GPCR corticotropin-releasing factor receptor 1. Nature. 2013;499:438–443. - PubMed

Publication types

MeSH terms