. 2017 Jul;174(14):2302-2317.
doi: 10.1111/bph.13832. Epub 2017 Jun 10.

Inhibition of semicarbazide-sensitive amine oxidase/vascular adhesion protein-1 reduces lipopolysaccharide-induced neuroinflammation

Affiliations

Inhibition of semicarbazide-sensitive amine oxidase/vascular adhesion protein-1 reduces lipopolysaccharide-induced neuroinflammation

Serena Becchi et al. Br J Pharmacol. 2017 Jul.

Abstract

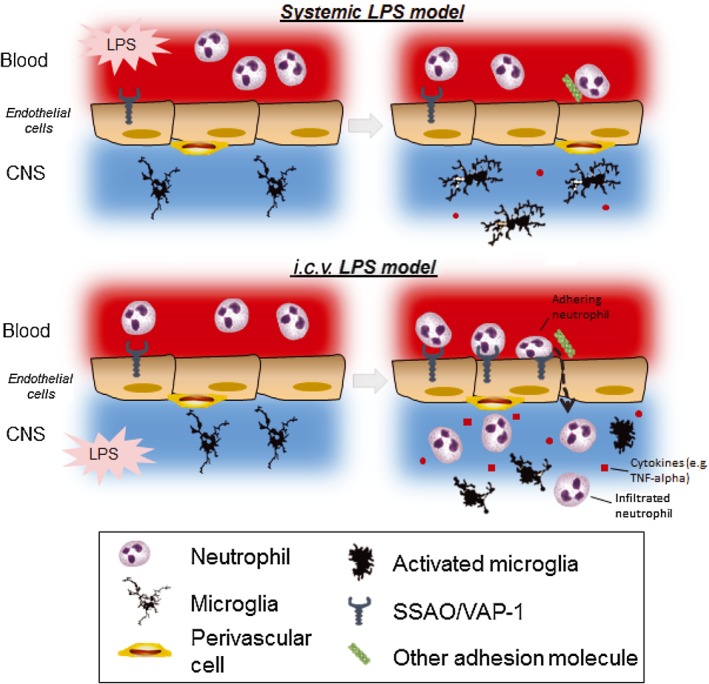
Background and purpose: Neuroinflammation is initiated by a variety of stimuli including infections, sepsis, neurodegenerative diseases or traumatic brain injury and, if not adequately controlled, can lead to various degrees of neuronal damage and behavioural impairment. A critical event in the initial steps of inflammation is neutrophil extravasation. Semicarbazide-sensitive amine oxidase (SSAO, also known as vascular adhesion protein 1 or VAP-1) regulates neutrophil adhesion and extravasation. Here, we elucidate the role of SSAO/VAP-1 in the early stage inflammatory response after LPS insult in the brain.

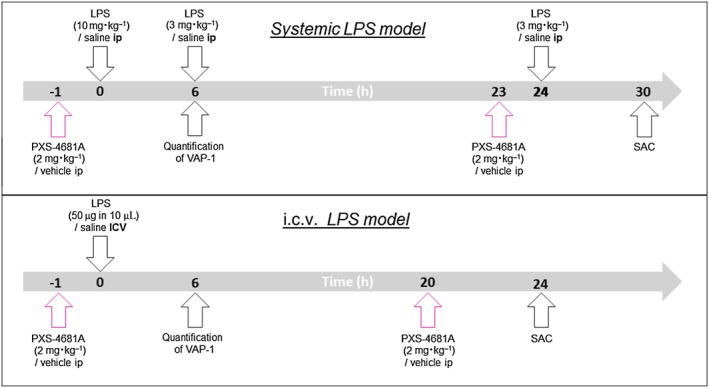
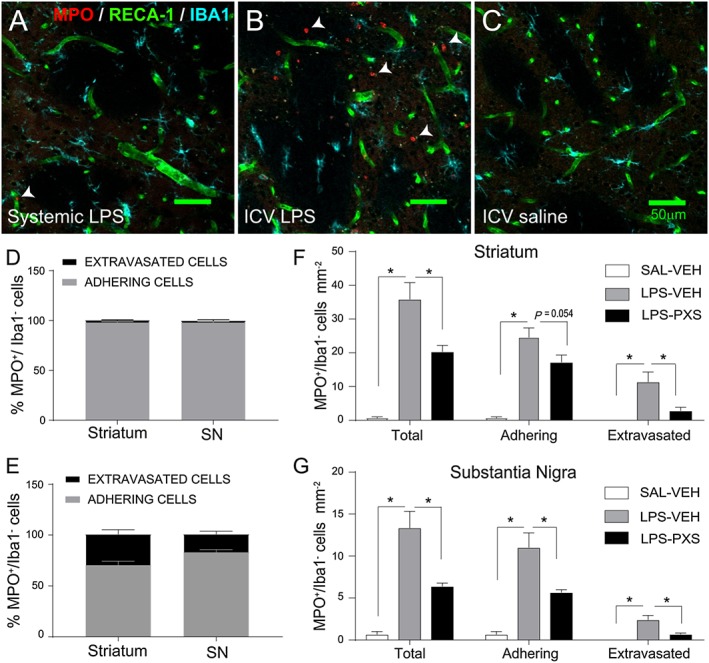
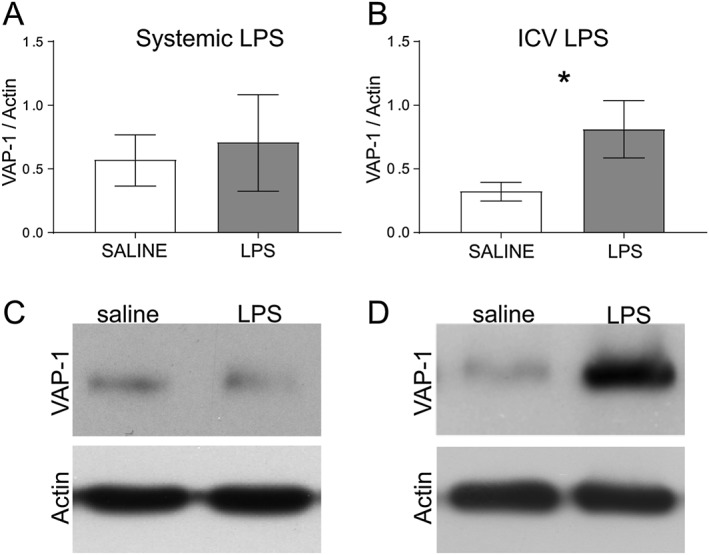
Experimental approach: PXS-4681A, a selective and irreversible SSAO/VAP-1 inhibitor, was tested in two rat models of neuroinflammation, following systemic or i.c.v. LPS. Immunohistochemical and immunofluorescence techniques were used to measure neutrophils and microglia. VAP-1 was quantitated by Western blotting.

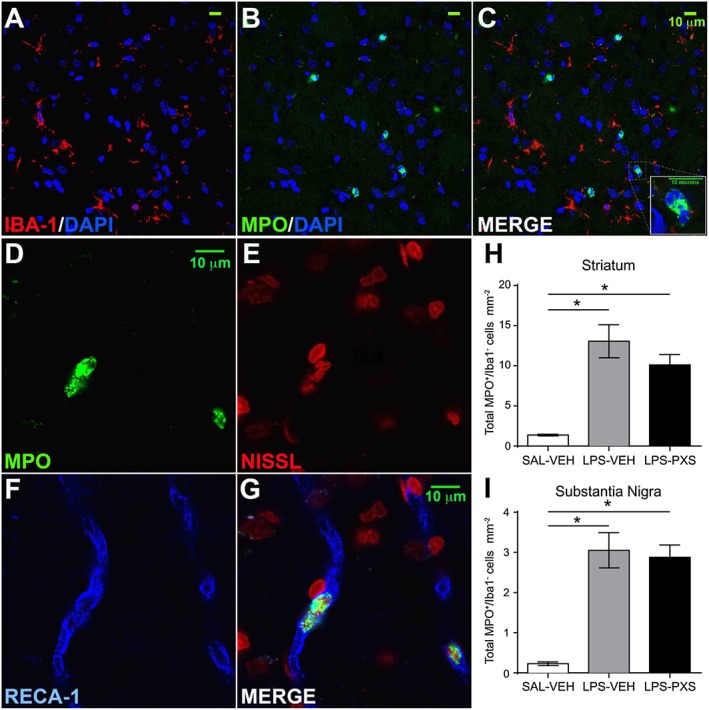
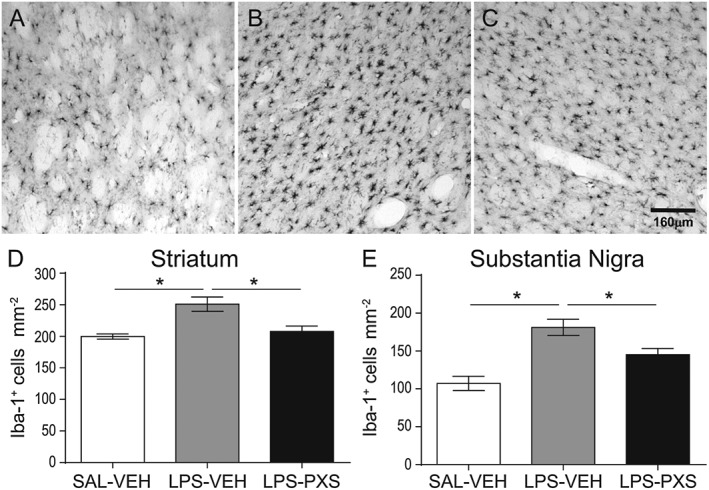
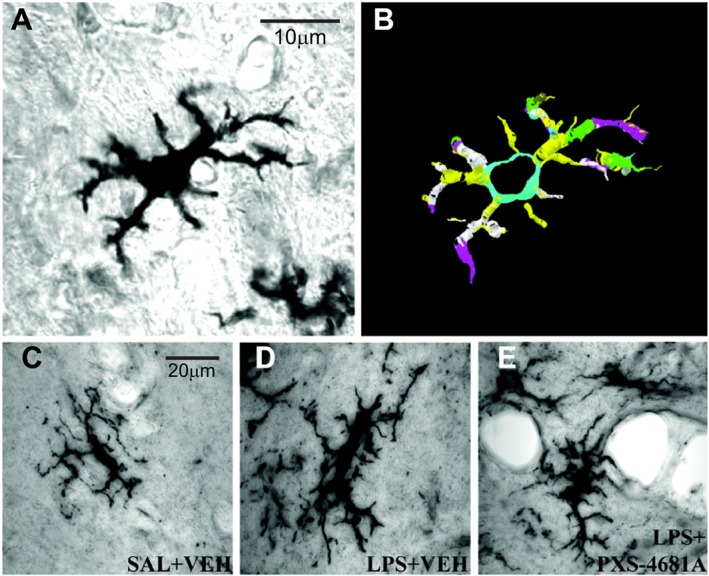
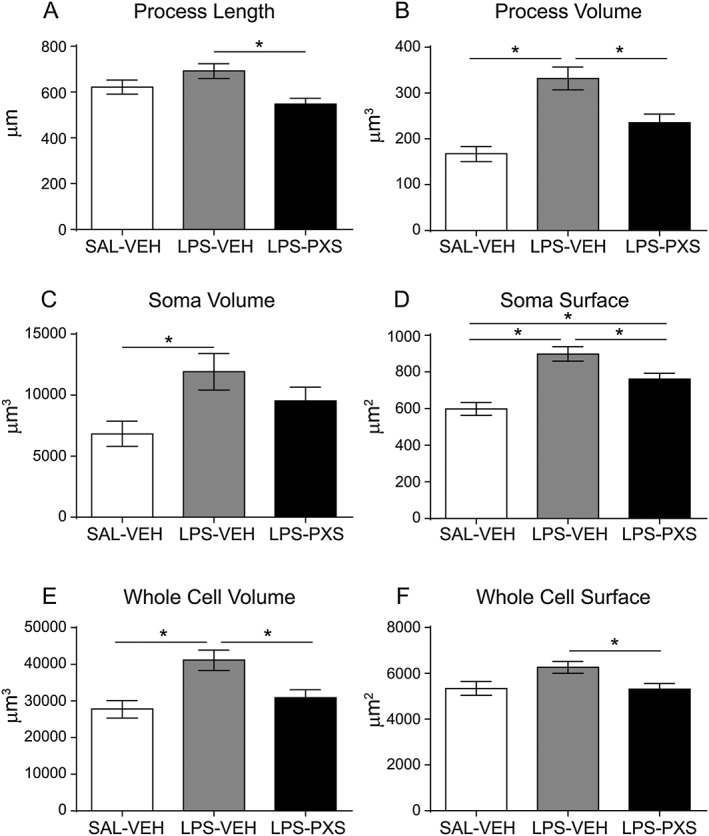
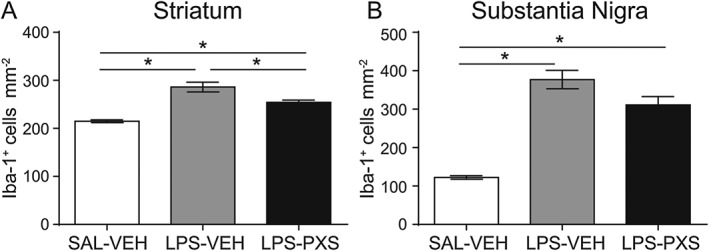
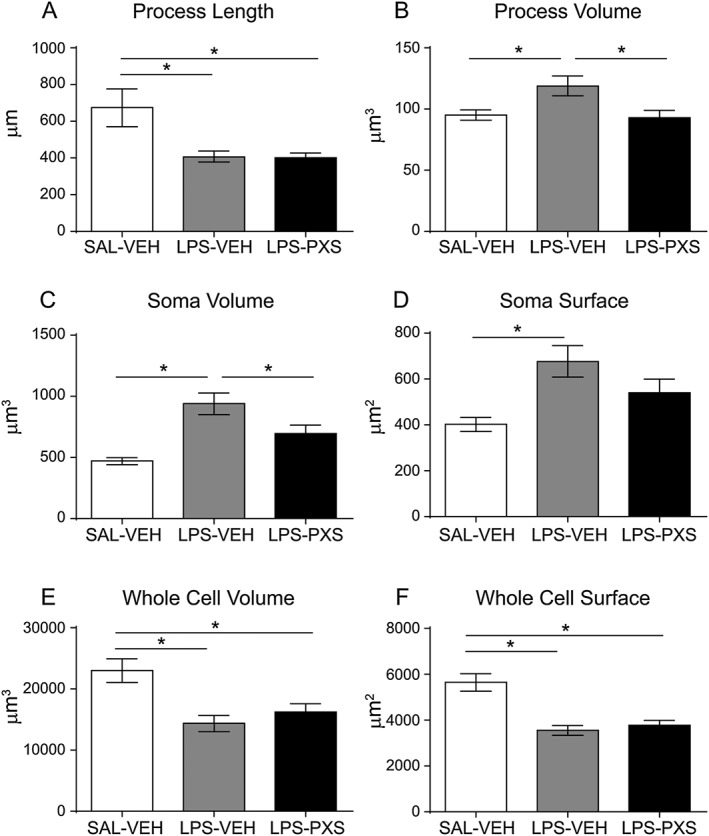
Key results: Both systemic and i.c.v. administration of LPS induced an increase in neutrophil recruitment and microglial response in various brain areas including the substantia nigra and striatum. PXS-4681A produced a significant inhibition of neutrophil recruitment and extravasation after i.c.v. LPS injection and also reversed microglial cell recruitment and morphological changes to the level of the sham controls in both LPS models.

Conclusions and implications: PXS-4681A acted as an effective anti-inflammatory agent after both systemic and i.c.v. LPS injections suggesting that SSAO/VAP-1 inhibition could be beneficial in the treatment of brain inflammation.


Figures

Figure 1
Figure 1
Experimental plan. (Top panel) In the systemic LPS model, rats received repeated i.p. injections of LPS at 0, 6 and 24 h with the aim of inducing a general inflammatory state both in the periphery and in the brain. PXS‐4681A (2 mg·kg−1) or vehicle was administered i.p. 1 h before the first dose of LPS and again 24 h after in order to maximize the effect of the inhibitor. At 30 h after the first dose of LPS, animals were killed to evaluate neuroinflammatory markers. (Bottom panel) In a second model, LPS was injected directly into the brain ventricles (i.c.v.) causing a more dramatic recruitment of leukocytes and microglia response compared with the systemic model. The rats received two treatments of 2 mg·kg−1 of PXS‐4681A or vehicle 1 h before LPS infusion and 20 h after. At 24 h, the rats were killed and brains were collected for histological assessment. In both models, VAP‐1 expression was quantified 6 h after i.p. or i.c.v. LPS treatment.
Figure 2
Figure 2
Neutrophil staining and quantification in the systemic LPS model. (A–C) Iba‐1 (red) / MPO (green) / DAPI (blue) staining to identify neutrophils and macrophages. Neutrophils are Iba‐1, express high level of MPO and characterized by a polylobate nucleus. (D–G) MPO (green) / Nissl (red) / RECA‐1 (blue) staining to identify neutrophils and endothelial cells of the blood vessels. After systemic LPS, neutrophils were mainly localized inside the blood vessels. (H–I) Quantification of total number of MPO+/Iba‐1 cells in the striatum and in the substantia nigra. Graphs represent (left to right) a group that received saline i.p. and vehicle i.p. (SAL‐VEH), LPS i.p. and vehicle i.p. (LPS‐VEH) and LPS i.p. and PXS‐4681A i.p. (LPS‐PXS). Systemic LPS (LPS‐VEH; n = 15) increased the recruitment of MPO+/Iba‐1 cells, compared with the saline group (SAL‐VEH; n = 10). Treatment with PXS‐4681A (LPS‐PXS; n = 15) did not change neutrophil recruitment in both areas. Data represent the mean values ± SEM. *P < 0.05; one‐way ANOVA followed by Tukey's multiple comparison test.
Figure 3
Figure 3
Microglia cell recruitment after systemic LPS. The micrographs represent Iba‐1+ cells in the striatum 30 h after LPS or saline i.p. first injection. Micrographs represent group SAL‐VEH (A), LPS‐VEH (B) and LPS‐PXS (C). Systemic LPS induces an increase in microglia response that is reversed by PXS‐4681A. The graphs represent microglia cell number in striatum (D) and substantia nigra (E). Graphs represent (left to right) a group that received saline i.p. and vehicle i.p. (SAL‐VEH), LPS i.p. and vehicle i.p. (LPS‐VEH) and LPS i.p. and PXS‐4681A i.p. (LPS‐PXS). Systemic LPS (LPS‐VEH; n = 15) increased Iba‐1+ cells recruitment as compared with saline group (SAL‐VEH; n = 10). PXS‐4681A (LPS‐PXS; n = 15) was able to decrease microglia cell recruitment induced by systemic LPS. Data represent mean values ± SEM. *P < 0.05, significantly different as indicated; one‐way ANOVA followed by Tukey's multiple comparison test.
Figure 4
Figure 4
Morphological differences of microglia cells between the groups and three‐dimensional digital reconstruction with Neurolucida software. (A) Original ramified Iba‐1‐labelled microglial cells at 100× (objective lens); (B) automatic reconstruction of the cell conducted in Neurolucida; (C–E) morphological differences of microglia cells between the groups. Micrographs represent respectively SAL + VEH (C), LPS + VEH (D) and LPS + PXS‐4681A (E) groups. LPS increased cell and soma sizes as well as length and volume of cell processes. Thirty hours after systemic LPS treatments, microglia were mostly in the early activation state with process extension and reorientation towards blood vessels. PXS‐4681A was able to restore microglia phenotype to control level. Scale bars are 20 μm.
Figure 5
Figure 5
Microglia processes and soma characterization with Neurolucida. The graphs represent length (A) and volume (B) of microglia processes, volume (C) and surface (D) of the soma and, lastly, volume (E) and surface (F) of the whole cell for each microglia cell. Systemic LPS (LPS‐VEH; n = 60 cells) increased cell and soma sizes as well as the volume of cell processes as compared with saline group (SAL‐VEH; n = 40 cells). PXS‐4681A (LPS‐PXS; n = 60 cells) was able to inhibit the morphological changes induced by LPS, decreasing the volume of the processes and of the whole cell as compared with LPS‐VEH group. Data represent mean values ± SEM. *P < 0.05, significantly different as indicated; ANOVA followed by Tukey's multiple comparison test.
Figure 6
Figure 6
Neutrophil recruitment in the systemic and i.c.v. LPS models. Differences in neutrophil recruitment in the striatum after (A) systemic LPS, (B) i.c.v. LPS and (C) i.c.v. saline. Systemic LPS increased neutrophil recruitment compared with the saline group but did not induce any extravasation in the brain parenchyma [MPO+/Iba1 cells – examples indicated by white arrows – were localized only within the endothelial cell RECA‐1+ (A)]. i.c.v. LPS dramatically increased neutrophil recruitment when compared with systemic LPS and saline: leukocytes extravasate at 24 h after the endotoxin insult [MPO+/Iba1 cells were localized within and outside the endothelial cell RECA‐1+ (B)]. Percentage of adhesion and extravasation of MPO+/Iba1 cells in systemic LPS (D) and i.c.v. LPS (E) models in striatum and substantia nigra (SN). Systemic LPS did not induce neutrophil extravasation when compared with i.c.v. LPS. (F–G) Quantification of neutrophil cells after i.c.v. LPS in the striatum and SN. Graphs represent (left to right) the group that received i.c.v. saline and vehicle i.p. (SAL‐VEH; n = 6), i.c.v. LPS and vehicle i.p. (LPS‐VEH; n = 8) and i.c.v. LPS and PXS‐4681A i.p. (LPS‐PXS; n = 8). i.c.v. LPS increased the number of neutrophils adhering to the blood vessels and extravasating in the tissue in both areas when compared with the saline group. SSAO/VAP‐1 activity was shown to be crucial in eliciting the neutrophilic inflammatory response: PXS‐4681A (LPS‐PXS; n = 8) decreased neutrophil infiltration as compared with LPS‐VEH group in the striatum (F) and interfere with the adhesion process in the substantia nigra (G). Data represent mean values ± SEM. *P < 0.05, significantly different as indicated; two‐way ANOVA followed by simple effect analysis with t‐test.
Figure 7
Figure 7
Microglia cell count in i.c.v. LPS model. Microglia responded to the i.c.v. inflammatory stimulus increasing in cells number in both striatum (A) and substantia nigra (B). Graphs represent (left to right) the group that received i.c.v. saline and vehicle i.p. (SAL‐VEH; n = 6), i.c.v. LPS and vehicle i.p. (LPS‐VEH; n = 8) and i.c.v. LPS and PXS‐4681A i.p. (LPS‐PXS; n = 8). i.c.v. LPS induced an increase in cell number in both areas, and SSAO/VAP‐1 inhibition decreased this increase in the striatum (A) but did not significantly change the LPS‐induce increase in the substantia nigra (B). Data represent average ± SEM. *P < 0.05, significantly different as indicated; one‐way ANOVA followed by Tukey's multiple comparison test.
Figure 8
Figure 8
Microglia morphological quantification in the i.c.v. LPS model. The graphs represent the following: (A) length and (B) volume of microglia processes; (C) volume and (D) surface of the soma; and, lastly, (E) volume and (F) surface of the whole cell for each microglia cell in the striatum. Graphs represent (left to right) the group that received i.c.v. saline and vehicle i.p. (SAL‐VEH, n = 36 cells), i.c.v. LPS and vehicle i.p. (LPS‐VEH; n = 48 cells) and i.c.v. LPS and PXS‐4681A i.p. (LPS‐PXS; n = 48 cells). Despite there was no effect on process length, PXS‐4681A was able to decrease process volume (B) as well as soma volume (C) of microglia. Data represent mean values ± SEM. *P < 0.05, significantly different as indicated; ANOVA followed by Tukey's multiple comparison test.
Figure 9
Figure 9
VAP‐1 quantification in brain microvessels after (A, C) systemic LPS (n = 6) and (B, D) i.c.v. LPS (n = 6). Data represents means ± SEM. *P < 0.05, significantly different from saline; t‐test.
Figure 10
Figure 10
Schematic representation of the inflammatory sequence occurring in systemic and i.c.v. LPS models. (Top) When given systemically, a minimal amount of LPS can cross the BBB (Banks and Robinson, 2010), increasing rolling and adhering neutrophils on the endothelial cell layer. Systemic LPS might act on the BBB, activating endothelial cells, which affects leukocyte rolling and adhesion but does not increase the expression of VAP‐1 and thus does not increase leukocyte extravasation (Zhou et al., 2009). Systemic LPS also induced a mild response of microglia, characterized by increased cell number and changed morphology, consistent with other studies (Lemstra et al., 2007; Hoogland et al., 2015), possibly induced by the increase of cytokines in the brain parenchyma (Zhou et al., 2009). In peripheral organs, where the LPS action is not restricted by the BBB, systemic LPS leads to a strong neutrophil recruitment and extravasation associated with the release of proinflammatory cytokines that is inhibited by a SSAO/VAP‐1 inhibitor (Foot et al., 2013). We suggest that in the systemic LPS model, SSAO/VAP‐1 is involved mainly peripherally, leading to a reduced overall inflammatory response, which might result in a reduced microglia response in the brain. (Bottom) LPS given i.c.v. is not restricted by the BBB and can enter the brain parenchyma, resulting in a stronger neutrophil recruitment and extravasation and a stronger microglia response. We suggest that i.c.v. LPS induces a stronger signal from the brain parenchyma, eliciting a higher expression of VAP‐1 on the BBB and a higher neutrophil‐mediated inflammatory response. The increased adhesion and extravasation of neutrophils, in turn, amplifies microglial response. It is logical to assume then that a reduced neutrophil response would lead to decreased microglia activation in the brain as well.

Similar articles

Cited by

References

    1. Aalto K, Autio A, Kiss EA, Elima K, Nymalm Y, Veres TZ et al. (2011). Siglec‐9 is a novel leukocyte ligand for vascular adhesion protein‐1 and can be used in PET imaging of inflammation and cancer. Blood 118: 3725–3733. - PMC - PubMed
    1. Abella A, García‐Vicente S, Viguerie N, Ros‐Baró A, Camps M, Palacín M et al. (2004). Adipocytes release a soluble form of VAP‐1/SSAO by a metalloprotease‐dependent process and in a regulated manner. Diabetologia 47: 429–438. - PubMed
    1. Alexander SPH, Fabbro D, Kelly E, Marrion N, Peters JA, Benson HE et al. (2015a). The Concise Guide to PHARMACOLOGY 2015/16: Enzymes. Br J Pharmacol 172: 6024–6109. - PMC - PubMed
    1. Alexander SPH, Davenport AP, Kelly E, Marrion N, Peters JA, Benson HE et al. (2015b). The Concise Guide to PHARMACOLOGY 2015/16: G protein‐coupled receptors. Br J Pharmacol 172: 5744–5869. - PMC - PubMed
    1. Andonegui G, Goyert SM, Kubes P (2002). Lipopolysaccharide‐induced leukocyte‐endothelial cell interactions: a role for CD14 versus toll‐like receptor 4 within microvessels. J Immunol 169: 2111–2119. - PubMed

MeSH terms

Substances