

A diagnostic microdosing approach to investigate platinum sensitivity in non-small cell lung cancer
- PMID: 28437852
- PMCID: PMC5497716
- DOI: 10.1002/ijc.30747
A diagnostic microdosing approach to investigate platinum sensitivity in non-small cell lung cancer
Abstract
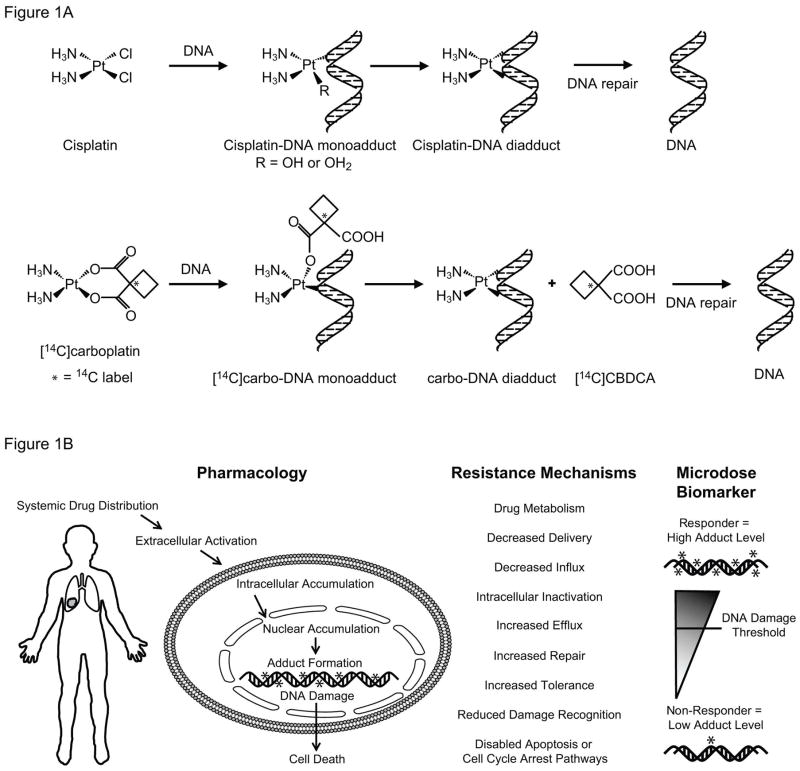
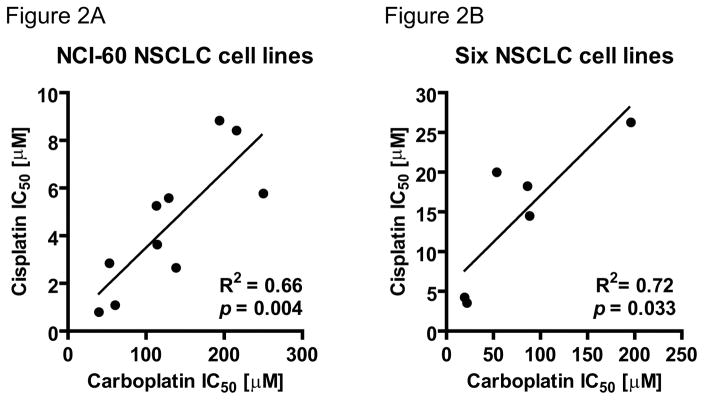
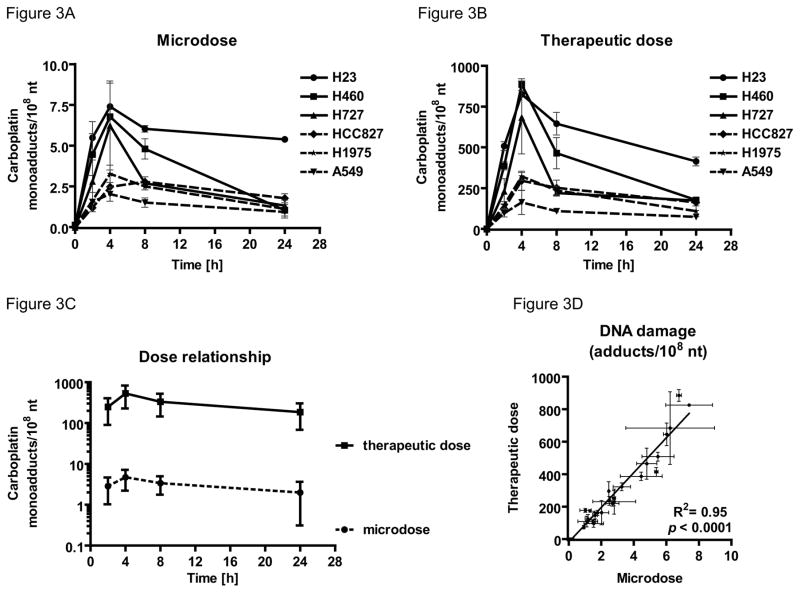
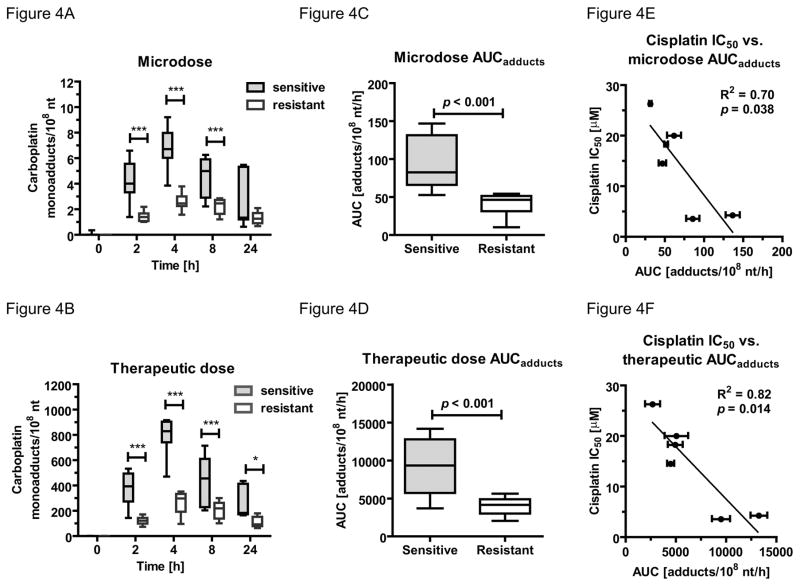
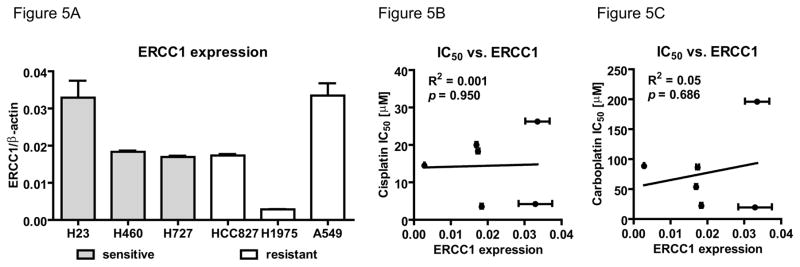
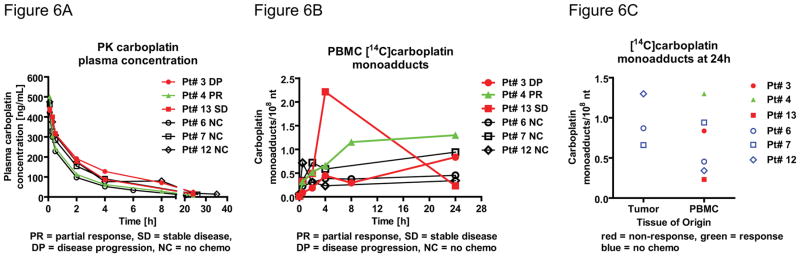
The platinum-based drugs cisplatin, carboplatin and oxaliplatin are often used for chemotherapy, but drug resistance is common. The prediction of resistance to these drugs via genomics is a challenging problem since hundreds of genes are involved. A possible alternative is to use mass spectrometry to determine the propensity for cells to form drug-DNA adducts-the pharmacodynamic drug-target complex for this class of drugs. The feasibility of predictive diagnostic microdosing was assessed in non-small cell lung cancer (NSCLC) cell culture and a pilot clinical trial. Accelerator mass spectrometry (AMS) was used to quantify [14 C]carboplatin-DNA monoadduct levels in the cell lines induced by microdoses and therapeutic doses of carboplatin, followed by correlation with carboplatin IC50 values for each cell line. The adduct levels in cell culture experiments were linearly proportional to dose (R2 = 0.95, p < 0.0001) and correlated with IC50 across all cell lines for microdose and therapeutically relevant carboplatin concentrations (p = 0.02 and p = 0.01, respectively). A pilot microdosing clinical trial was conducted to define protocols and gather preliminary data. Plasma pharmacokinetics (PK) and [14 C]carboplatin-DNA adducts in white blood cells and tumor tissues from six NSCLC patients were quantified via AMS. The blood plasma half-life of [14 C]carboplatin administered as a microdose was consistent with the known PK of therapeutic dosing. The optimal [14 C]carboplatin formulation for the microdose was 107 dpm/kg of body weight and 1% of the therapeutic dose for the total mass of carboplatin. No microdose-associated toxicity was observed in the patients. Additional accruals are required to significantly correlate adduct levels with response.
Keywords: accelerator mass spectrometry; biomarkers of response; diagnostic; microdosing; non-small cell lung cancer; platinum-based chemotherapy; predictive diagnostics.
© 2017 UICC.
Figures
Similar articles
-
Oxaliplatin-DNA Adducts as Predictive Biomarkers of FOLFOX Response in Colorectal Cancer: A Potential Treatment Optimization Strategy.Mol Cancer Ther. 2020 Apr;19(4):1070-1079. doi: 10.1158/1535-7163.MCT-19-0133. Epub 2020 Feb 6. Mol Cancer Ther. 2020. PMID: 32029633 Free PMC article.
-
Correlation of Platinum Cytotoxicity to Drug-DNA Adduct Levels in a Breast Cancer Cell Line Panel.Chem Res Toxicol. 2018 Dec 17;31(12):1293-1304. doi: 10.1021/acs.chemrestox.8b00170. Epub 2018 Nov 19. Chem Res Toxicol. 2018. PMID: 30381944 Free PMC article.
-
A microdosing approach for characterizing formation and repair of carboplatin-DNA monoadducts and chemoresistance.Int J Cancer. 2011 Sep 15;129(6):1425-34. doi: 10.1002/ijc.25814. Epub 2011 Mar 4. Int J Cancer. 2011. PMID: 21128223 Free PMC article.
-
Platinum-based chemotherapy in advanced non-small-cell lung cancer: optimal number of treatment cycles.Expert Rev Anticancer Ther. 2016 Jun;16(6):653-60. doi: 10.1586/14737140.2016.1170596. Epub 2016 Apr 8. Expert Rev Anticancer Ther. 2016. PMID: 27010977 Review.
-
Preliminary results of combined therapy with topotecan and carboplatin in advanced non-small-cell lung cancer.Oncology. 2001;61 Suppl 1:47-54. doi: 10.1159/000055392. Oncology. 2001. PMID: 11598415 Review.
Cited by
-
Phase 0/microdosing approaches: time for mainstream application in drug development?Nat Rev Drug Discov. 2020 Nov;19(11):801-818. doi: 10.1038/s41573-020-0080-x. Epub 2020 Sep 8. Nat Rev Drug Discov. 2020. PMID: 32901140 Review.
-
Oxaliplatin-DNA Adducts as Predictive Biomarkers of FOLFOX Response in Colorectal Cancer: A Potential Treatment Optimization Strategy.Mol Cancer Ther. 2020 Apr;19(4):1070-1079. doi: 10.1158/1535-7163.MCT-19-0133. Epub 2020 Feb 6. Mol Cancer Ther. 2020. PMID: 32029633 Free PMC article.
-
Correlation of Platinum Cytotoxicity to Drug-DNA Adduct Levels in a Breast Cancer Cell Line Panel.Chem Res Toxicol. 2018 Dec 17;31(12):1293-1304. doi: 10.1021/acs.chemrestox.8b00170. Epub 2018 Nov 19. Chem Res Toxicol. 2018. PMID: 30381944 Free PMC article.
-
Phase 0 trials/ Intra-Target-Microdosing (ITM) and the lung: a review.BMC Pulm Med. 2024 Aug 29;24(1):425. doi: 10.1186/s12890-024-03193-5. BMC Pulm Med. 2024. PMID: 39210357 Free PMC article. Review.
-
Toward Predicting Acute Myeloid Leukemia Patient Response to 7 + 3 Induction Chemotherapy via Diagnostic Microdosing.Chem Res Toxicol. 2018 Oct 15;31(10):1042-1051. doi: 10.1021/acs.chemrestox.8b00107. Epub 2018 Sep 10. Chem Res Toxicol. 2018. PMID: 30152692 Free PMC article.
References
-
- Siegel RL, Miller KD, Jemal A. Cancer statistics, 2016. CA: a cancer journal for clinicians. 2016;66:7–30. - PubMed
-
- Mao Y, Yang D, He J, Krasna MJ. Epidemiology of Lung Cancer. Surgical Oncology Clinics of North America. 2016;25:439–45. - PubMed
-
- Schiller JH, Harrington D, Belani CP, Langer C, Sandler A, Krook J, Zhu J, Johnson DH. Comparison of Four Chemotherapy Regimens for Advanced Non–Small-Cell Lung Cancer. New England Journal of Medicine. 2002;346:92–98. - PubMed
Publication types
MeSH terms
Substances
Grants and funding
LinkOut - more resources
Full Text Sources
Other Literature Sources
Medical
