

Comprehensive performance comparison of high-resolution array platforms for genome-wide Copy Number Variation (CNV) analysis in humans
- PMID: 28438122
- PMCID: PMC5402652
- DOI: 10.1186/s12864-017-3658-x
Comprehensive performance comparison of high-resolution array platforms for genome-wide Copy Number Variation (CNV) analysis in humans
Abstract
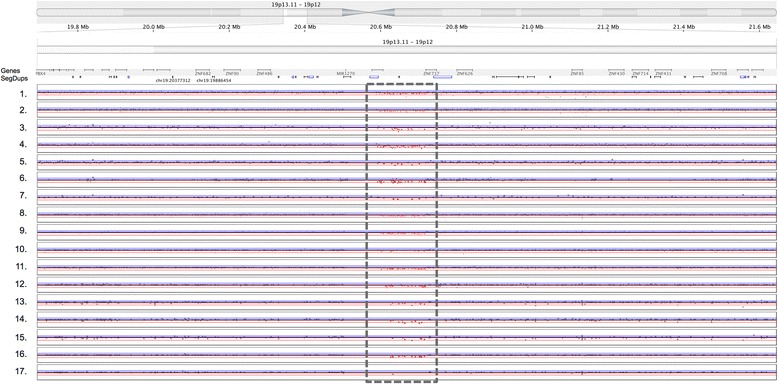
Background: High-resolution microarray technology is routinely used in basic research and clinical practice to efficiently detect copy number variants (CNVs) across the entire human genome. A new generation of arrays combining high probe densities with optimized designs will comprise essential tools for genome analysis in the coming years. We systematically compared the genome-wide CNV detection power of all 17 available array designs from the Affymetrix, Agilent, and Illumina platforms by hybridizing the well-characterized genome of 1000 Genomes Project subject NA12878 to all arrays, and performing data analysis using both manufacturer-recommended and platform-independent software. We benchmarked the resulting CNV call sets from each array using a gold standard set of CNVs for this genome derived from 1000 Genomes Project whole genome sequencing data.
Results: The arrays tested comprise both SNP and aCGH platforms with varying designs and contain between ~0.5 to ~4.6 million probes. Across the arrays CNV detection varied widely in number of CNV calls (4-489), CNV size range (~40 bp to ~8 Mbp), and percentage of non-validated CNVs (0-86%). We discovered strikingly strong effects of specific array design principles on performance. For example, some SNP array designs with the largest numbers of probes and extensive exonic coverage produced a considerable number of CNV calls that could not be validated, compared to designs with probe numbers that are sometimes an order of magnitude smaller. This effect was only partially ameliorated using different analysis software and optimizing data analysis parameters.
Conclusions: High-resolution microarrays will continue to be used as reliable, cost- and time-efficient tools for CNV analysis. However, different applications tolerate different limitations in CNV detection. Our study quantified how these arrays differ in total number and size range of detected CNVs as well as sensitivity, and determined how each array balances these attributes. This analysis will inform appropriate array selection for future CNV studies, and allow better assessment of the CNV-analytical power of both published and ongoing array-based genomics studies. Furthermore, our findings emphasize the importance of concurrent use of multiple analysis algorithms and independent experimental validation in array-based CNV detection studies.
Keywords: Array Comparative Genome Hybridization (aCGH); Copy Number Variation (CNV); SNP array.
Figures


Similar articles
-
Genome-wide mapping of copy number variation in humans: comparative analysis of high resolution array platforms.PLoS One. 2011;6(11):e27859. doi: 10.1371/journal.pone.0027859. Epub 2011 Nov 30. PLoS One. 2011. PMID: 22140474 Free PMC article.
-
Whole-genome sequencing analysis of CNV using low-coverage and paired-end strategies is efficient and outperforms array-based CNV analysis.J Med Genet. 2018 Nov;55(11):735-743. doi: 10.1136/jmedgenet-2018-105272. Epub 2018 Jul 30. J Med Genet. 2018. PMID: 30061371 Free PMC article.
-
SNP arrays: comparing diagnostic yields for four platforms in children with developmental delay.BMC Med Genomics. 2014 Dec 24;7:70. doi: 10.1186/s12920-014-0070-0. BMC Med Genomics. 2014. PMID: 25539807 Free PMC article.
-
Novel applications of array comparative genomic hybridization in molecular diagnostics.Expert Rev Mol Diagn. 2018 Jun;18(6):531-542. doi: 10.1080/14737159.2018.1479253. Epub 2018 May 31. Expert Rev Mol Diagn. 2018. PMID: 29848116 Review.
-
Comparative Analysis of CNV Calling Algorithms: Literature Survey and a Case Study Using Bovine High-Density SNP Data.Microarrays (Basel). 2013 Jun 25;2(3):171-85. doi: 10.3390/microarrays2030171. Microarrays (Basel). 2013. PMID: 27605188 Free PMC article. Review.
Cited by
-
Prenatal Diagnosis of Fetuses With Increased Nuchal Translucency by Genome Sequencing Analysis.Front Genet. 2019 Aug 16;10:761. doi: 10.3389/fgene.2019.00761. eCollection 2019. Front Genet. 2019. PMID: 31475041 Free PMC article.
-
Frequent copy number variants in a cohort of Mexican-Mestizo individuals.Mol Cytogenet. 2023 Jan 12;16(1):2. doi: 10.1186/s13039-022-00631-z. Mol Cytogenet. 2023. PMID: 36631885 Free PMC article.
-
Performance of copy number variants detection based on whole-genome sequencing by DNBSEQ platforms.BMC Bioinformatics. 2020 Nov 11;21(1):518. doi: 10.1186/s12859-020-03859-x. BMC Bioinformatics. 2020. PMID: 33176676 Free PMC article.
-
Single-cell analysis of copy-number alterations in serous ovarian cancer reveals substantial heterogeneity in both low- and high-grade tumors.Cell Cycle. 2020 Nov;19(22):3154-3166. doi: 10.1080/15384101.2020.1836439. Epub 2020 Oct 30. Cell Cycle. 2020. PMID: 33121339 Free PMC article.
-
Evaluating the Genetics of Common Variable Immunodeficiency: Monogenetic Model and Beyond.Front Immunol. 2018 May 14;9:636. doi: 10.3389/fimmu.2018.00636. eCollection 2018. Front Immunol. 2018. PMID: 29867916 Free PMC article.
References
-
- Laurent LC, Ulitsky I, Slavin I, Tran H, Schork A, Morey R, Lynch C, Harness JV, Lee S, Barrero MJ, et al. Dynamic changes in the copy number of pluripotency and cell proliferation genes in human ESCs and iPSCs during reprogramming and time in culture. Cell Stem Cell. 2011;8(1):106–118. doi: 10.1016/j.stem.2010.12.003. - DOI - PMC - PubMed
Publication types
MeSH terms
Grants and funding
LinkOut - more resources
Full Text Sources
Other Literature Sources
Molecular Biology Databases
Miscellaneous
