

Network-based analysis reveals novel gene signatures in peripheral blood of patients with chronic obstructive pulmonary disease
- PMID: 28438154
- PMCID: PMC5404332
- DOI: 10.1186/s12931-017-0558-1
Network-based analysis reveals novel gene signatures in peripheral blood of patients with chronic obstructive pulmonary disease
Abstract
Background: Chronic obstructive pulmonary disease (COPD) is currently the third leading cause of death and there is a huge unmet clinical need to identify disease biomarkers in peripheral blood. Compared to gene level differential expression approaches to identify gene signatures, network analyses provide a biologically intuitive approach which leverages the co-expression patterns in the transcriptome to identify modules of co-expressed genes.
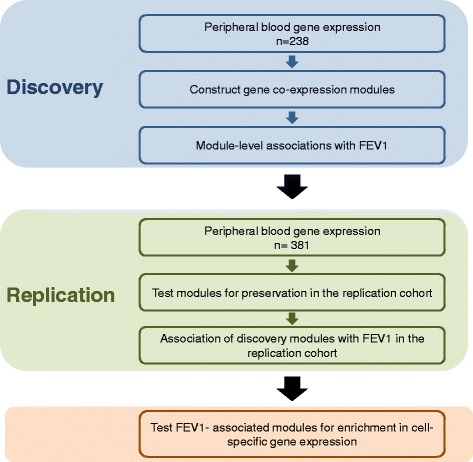
Methods: A weighted gene co-expression network analysis (WGCNA) was applied to peripheral blood transcriptome from 238 COPD subjects to discover co-expressed gene modules. We then determined the relationship between these modules and forced expiratory volume in 1 s (FEV1). In a second, independent cohort of 381 subjects, we determined the preservation of these modules and their relationship with FEV1. For those modules that were significantly related to FEV1, we determined the biological processes as well as the blood cell-specific gene expression that were over-represented using additional external datasets.
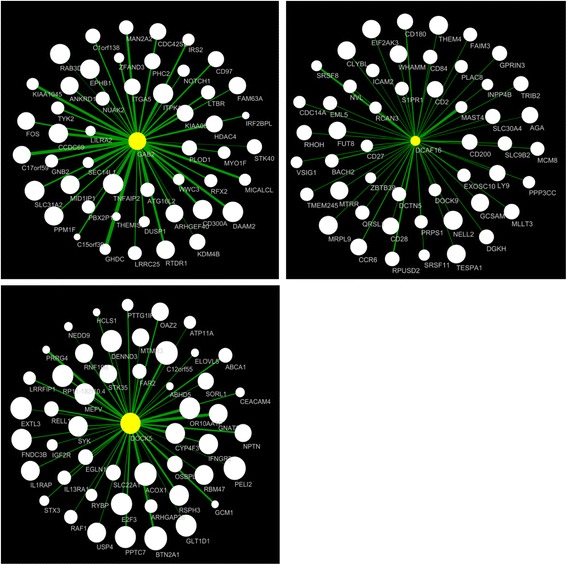
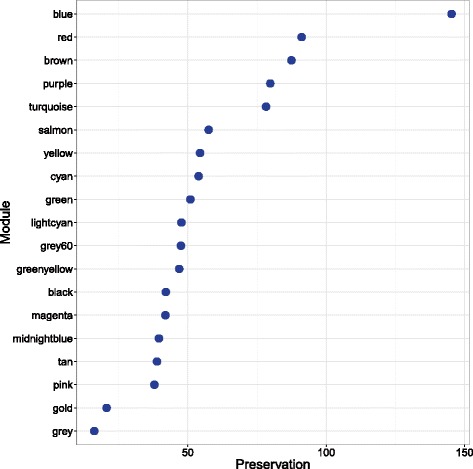
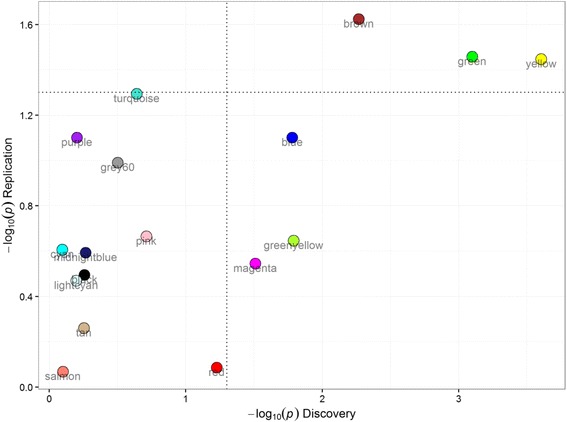
Results: Using WGCNA, we identified 17 modules of co-expressed genes in the discovery cohort. Three of these modules were significantly correlated with FEV1 (FDR < 0.1). In the replication cohort, these modules were highly preserved and their FEV1 associations were reproducible (P < 0.05). Two of the three modules were negatively related to FEV1 and were enriched in IL8 and IL10 pathways and correlated with neutrophil-specific gene expression. The positively related module, on the other hand, was enriched in DNA transcription and translation and was strongly correlated to CD4+, CD8+ T cell-specific gene expression.
Conclusions: Network based approaches are promising tools to identify potential biomarkers for COPD.
Trial registration: The ECLIPSE study was funded by GlaxoSmithKline, under ClinicalTrials.gov identifier NCT00292552 and GSK No. SCO104960.
Keywords: Biomarker; Blood; COPD; Co-expression; FEV1; Gene expression; Transcriptome; WGCNA; mRNA.
Figures
Similar articles
-
Differential DNA methylation marks and gene comethylation of COPD in African-Americans with COPD exacerbations.Respir Res. 2016 Nov 5;17(1):143. doi: 10.1186/s12931-016-0459-8. Respir Res. 2016. PMID: 27814717 Free PMC article.
-
Identifying a gene expression signature of frequent COPD exacerbations in peripheral blood using network methods.BMC Med Genomics. 2015 Jan 13;8:1. doi: 10.1186/s12920-014-0072-y. BMC Med Genomics. 2015. PMID: 25582225 Free PMC article. Clinical Trial.
-
Variable DNA methylation of aging-related genes is associated with male COPD.Respir Res. 2019 Nov 4;20(1):243. doi: 10.1186/s12931-019-1215-7. Respir Res. 2019. PMID: 31684967 Free PMC article.
-
The clinical value of suPAR in diagnosis and prediction for patients with chronic obstructive pulmonary disease: a systematic review and meta-analysis.Ther Adv Respir Dis. 2020 Jan-Dec;14:1753466620938546. doi: 10.1177/1753466620938546. Ther Adv Respir Dis. 2020. PMID: 32643535 Free PMC article.
-
Omics and the Search for Blood Biomarkers in Chronic Obstructive Pulmonary Disease. Insights from COPDGene.Am J Respir Cell Mol Biol. 2019 Aug;61(2):143-149. doi: 10.1165/rcmb.2018-0245PS. Am J Respir Cell Mol Biol. 2019. PMID: 30874442 Free PMC article. Review.
Cited by
-
Blood Gene Expression and Immune Cell Subtypes Associated with Chronic Obstructive Pulmonary Disease Exacerbations.Am J Respir Crit Care Med. 2023 Aug 1;208(3):247-255. doi: 10.1164/rccm.202301-0085OC. Am J Respir Crit Care Med. 2023. PMID: 37286295 Free PMC article.
-
Identification of the hub genes in gastric cancer through weighted gene co-expression network analysis.PeerJ. 2021 Mar 5;9:e10682. doi: 10.7717/peerj.10682. eCollection 2021. PeerJ. 2021. PMID: 33717664 Free PMC article.
-
Identification of biomarkers in common chronic lung diseases by co-expression networks and drug-target interactions analysis.Mol Med. 2020 Jan 17;26(1):9. doi: 10.1186/s10020-019-0135-9. Mol Med. 2020. PMID: 31952466 Free PMC article.
-
Voluntary exposure to a toxin: the genetic influence on ethanol consumption.Mamm Genome. 2018 Feb;29(1-2):128-140. doi: 10.1007/s00335-017-9726-3. Epub 2017 Dec 1. Mamm Genome. 2018. PMID: 29196862 Free PMC article.
-
Host Factor Interaction Networks Identified by Integrative Bioinformatics Analysis Reveals Therapeutic Implications in COPD Patients With COVID-19.Front Pharmacol. 2021 Dec 23;12:718874. doi: 10.3389/fphar.2021.718874. eCollection 2021. Front Pharmacol. 2021. PMID: 35002688 Free PMC article.
References
-
- WHO. The top 10 causes of death. Geneva: World Health Organization; 2014.
-
- Vestbo J, Hurd SS, Agusti AG, Jones PW, Vogelmeier C, Anzueto A, Barnes PJ, Fabbri LM, Martinez FJ, Nishimura M, et al. Global strategy for the diagnosis, management, and prevention of chronic obstructive pulmonary disease: GOLD executive summary. Am J Respir Crit Care Med. 2013;187:347–365. doi: 10.1164/rccm.201204-0596PP. - DOI - PubMed
-
- GOLD . Global initiative for chronic obstructive lung disease. 2011. - PubMed
Publication types
MeSH terms
Substances
Associated data
Grants and funding
LinkOut - more resources
Full Text Sources
Other Literature Sources
Medical
Research Materials
