. 2017 Apr 24;9(1):38.
doi: 10.1186/s13073-017-0427-z.

PathOS: a decision support system for reporting high throughput sequencing of cancers in clinical diagnostic laboratories

Affiliations

PathOS: a decision support system for reporting high throughput sequencing of cancers in clinical diagnostic laboratories

Kenneth D Doig et al. Genome Med. .

Abstract

Background: The increasing affordability of DNA sequencing has allowed it to be widely deployed in pathology laboratories. However, this has exposed many issues with the analysis and reporting of variants for clinical diagnostic use. Implementing a high-throughput sequencing (NGS) clinical reporting system requires a diverse combination of capabilities, statistical methods to identify variants, global variant databases, a validated bioinformatics pipeline, an auditable laboratory workflow, reproducible clinical assays and quality control monitoring throughout. These capabilities must be packaged in software that integrates the disparate components into a useable system.

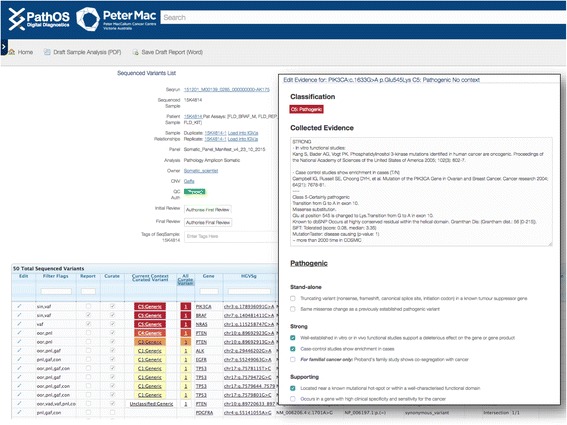
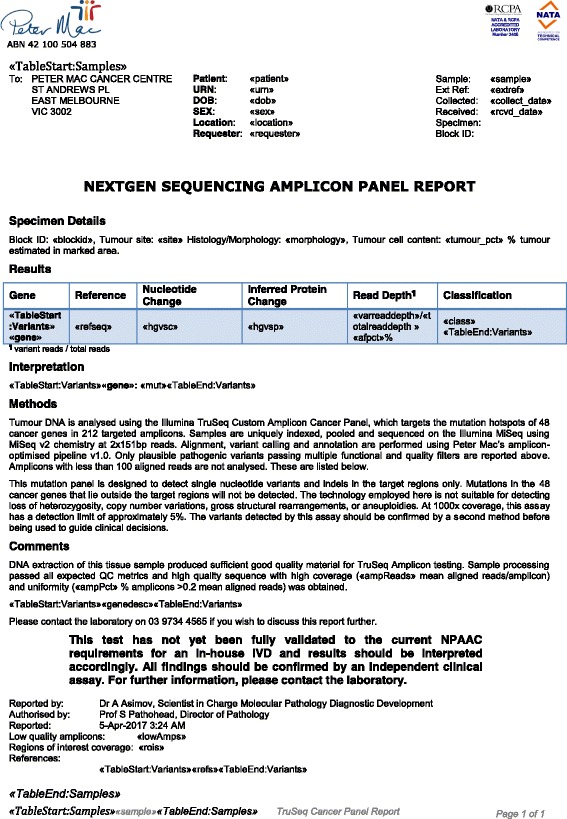
Results: To meet these needs, we developed a web-based application, PathOS, which takes variant data from a patient sample through to a clinical report. PathOS has been used operationally in the Peter MacCallum Cancer Centre for two years for the analysis, curation and reporting of genetic tests for cancer patients, as well as the curation of large-scale research studies. PathOS has also been deployed in cloud environments allowing multiple institutions to use separate, secure and customisable instances of the system. Increasingly, the bottleneck of variant curation is limiting the adoption of clinical sequencing for molecular diagnostics. PathOS is focused on providing clinical variant curators and pathology laboratories with a decision support system needed for personalised medicine. While the genesis of PathOS has been within cancer molecular diagnostics, the system is applicable to NGS clinical reporting generally.

Conclusions: The widespread availability of genomic sequencers has highlighted the limited availability of software to support clinical decision-making in molecular pathology. PathOS is a system that has been developed and refined in a hospital laboratory context to meet the needs of clinical diagnostics. The software is available as a set of Docker images and source code at https://github.com/PapenfussLab/PathOS .


Figures

Fig. 1
Fig. 1
Sample and variant volumes. Chart of the increase of sample and unique sequenced variants by month from January 2012. 2016 cancer diagnostic volumes for the Peter MacCallum Molecular Diagnostic Laboratory were 151 sequencing runs of 6023 samples yielding 213,581 unique variants
Fig. 2
Fig. 2
Variant allele frequency (VAF) distributions. The variant data for the first six months of 2016 have been aggregated to show the VAF distributions for amplicon and hybrid capture panels. All scatter plots display a bimodal distribution with a peak at 50% allele frequency for heterozygous variants and 100% for homozygous variants. The top left plot shows all variants in the custom myeloid amplicon panel prior to filtering (n = 66,210). It shows a number of peaks that are due to technical panel artefacts. The top right plot shows variants remaining (n = 13,649 20.6%) after removing; variants occurring in one sample replicate only, variants occurring in more than 35% of samples in the myeloid panel (panel artefacts) and variants with less than 100 total reads or less than 20 alternative reads. The resulting distribution is far smoother and free from technical artefacts. Note the large peak at low VAF%. The amplicon panel samples have high read coverage (mean 2297×) which captures low frequency variants from both the wet lab PCR processes and sequencer errors. In contrast, the bottom left plot shows variants from the hybrid capture cancer panel and has no low VAF peak (mean coverage 246×). This is due to multiple factors including lower coverage meaning fewer low VAF variants pass the variant caller threshold (3.0%), more stringent pipeline filtering for hybrid capture and different wet lab processing. The histogram shows all manually reported somatic variants over this period and shows a skew towards low VAF% due to tumour purity (samples of mixed tumour and normal cells) and tumour heterogeneity (variants occurring only within clones in a heterogeneous tumour)
Fig. 3
Fig. 3
Quality control of runs and samples. Screen shots of graphical quality control metrics. Quality control is monitored at the sample, sequencing run and amplicon level. a A sequencing run’s read yield is compared to all previous runs of the same assay and should reside between ± 2 standard deviations for the last ten runs. Failed runs can be seen here dropping below the lower bound. b All samples within a run can be compared and samples with below average reads are highlighted in red. c The per amplicon reads over all samples in the run are binned and graphed to highlight their distribution and highlight any amplicons with less than 100 reads. Non-template controls are included in each run and are flagged if they contain any reads. Both a sequencing run and samples within the run must be QC passed or failed by the user prior to curation reports being produced. d The configurable heatmap of number of reads by amplicon and sample. Lighter horizontal bands indicate poorly performing amplicons while lighter vertical bars show poorly sequenced samples, typically due to insufficient or fragmented sample DNA
Fig. 4
Fig. 4
User filtering of variants. Screenshot showing multi-clause filtering dialogue box. Users can construct complex multi-clause filters from over 70 variant attributes or choose from common preset filters. PathOS automatically applies one or more flags (when uploading samples) to each variant based on its annotations. These flags are available for user filtering as shown in the filter being applied in the screen shot. The flags are listed with typical filtering criteria in parenthesis: pass: Passed all filters. vaf: Low variant allele frequency (<8% Somatic, < 15% Germline). vrd: Low total read depth (<100 reads). vad: Low variant read depth (<20 reads). blk: Assay specific variant black list (user defined). oor: Out of assay specific region of interest (user defined). con: Inferred benign consequences (system defined). gmaf: High global minor allele frequency (>1%). pnl: Frequently occurring variant in assay (>35%). sin: Singleton variant in replicate samples (not in both samples)
Fig. 5
Fig. 5
Validating variants with the embedded genome browser. PathOS links directly to the highlighted variant locus in the browser and preloads the correct tracks for reads, variants and amplicon tracks
Fig. 6
Fig. 6
PathOS screenshots showing the curation workflow. The curator navigates to the screen on the left displaying all variants (filtered and unfiltered) for a sample. Using an existing search template or a user configurable search dialogue, high priority variants are selected for curation. Previously curated and known variants are shown at the top of the list together with their classification. New variants can be added to the curation database by selecting the “Curate” checkbox. The curator then selects from a set of evidence checkboxes (right screen) characterising the mutation. Details are displayed when the mouse hovers over the checkbox to guide the curator’s selection. When the evidence page is saved, the five-level classification is automatically set as adapted from the ACMG guidelines for classification of germline variants
Fig. 7
Fig. 7
Search results page. Key fields within PathOS objects are designated to be globally searchable by the integrated Apache Lucene search engine. This allows users to easily retrieve the main PathOS data objects: patients, samples, sequenced variants, curated variants, PubMed articles as well as user and system-defined tags. Matching text is highlighted showing the context of the search string within the hits. This screenshot shows hits found within PathOS for the string “braf”
Fig. 8
Fig. 8
Example MS Word template clinical report. An example of the MS Word mail merge style template that can be used for the format of PathOS clinical reports. Any Word template containing the fields matching PathOS database content may be used for a report template. PathOS with populate the report from patient, sequencing and curation data in PDF or MS Word format when users click on the generate draft report button
Fig. 9
Fig. 9
Curated variants by classification over time. This histogram shows counts of the number of curated variants added to PathOS by manual curation by month over the life of the system. Variants are broken down by pathogenicity classification showing a predominance of pathogenic variants due to the focus of clinical sequencing to find disease-causing mutations

References

    1. Doig K, Papenfuss AT, Fox S. Clinical cancer genomic analysis: data engineering required. Lancet Oncol. 2015;16:1015–7. doi: 10.1016/S1470-2045(15)00195-3. - DOI - PubMed
    1. Wong SQ, Fellowes A, Doig K, Ellul J, Bosma TJ, Irwin D, et al. Assessing the clinical value of targeted massively parallel sequencing in a longitudinal, prospective population-based study of cancer patients. Br J Cancer. 2015;112:1411–20. doi: 10.1038/bjc.2015.80. - DOI - PMC - PubMed
    1. NATA. http://www.nata.com.au. Accessed 19 Apr 2017.
    1. Bettegowda C, Sausen M, Leary RJ, Kinde I, Wang Y, Agrawal N, et al. Detection of circulating tumor DNA in early- and late-stage human malignancies. Sci Transl Med. 2014;6:224ra224. doi: 10.1126/scitranslmed.3007094. - DOI - PMC - PubMed
    1. Interactive_Biosoftware. Alamut Visual. 2016. http://www.interactive-biosoftware.com/alamut-visual/. Accessed 19 Apr 2017.

Publication types

LinkOut - more resources