Early strong intrathecal inflammation in cerebellar type multiple system atrophy by cerebrospinal fluid cytokine/chemokine profiles: a case control study
- PMID: 28438224
- PMCID: PMC5404297
- DOI: 10.1186/s12974-017-0863-0
Early strong intrathecal inflammation in cerebellar type multiple system atrophy by cerebrospinal fluid cytokine/chemokine profiles: a case control study
Abstract
Background: The pathology of multiple system atrophy cerebellar-type (MSA-C) includes glial inflammation; however, cerebrospinal fluid (CSF) inflammatory cytokine profiles have not been investigated. In this study, we determined CSF cytokine/chemokine/growth factor profiles in MSA-C and compared them with those in hereditary spinocerebellar ataxia (SCA).
Methods: We collected clinical data and CSF from 20 MSA-C patients, 12 hereditary SCA patients, and 15 patients with other non-inflammatory neurological diseases (OND), and measured 27 cytokines/chemokines/growth factors using a multiplexed fluorescent bead-based immunoassay. The size of each part of the hindbrain and hot cross bun sign (HCBS) in the pons was studied by magnetic resonance imaging.
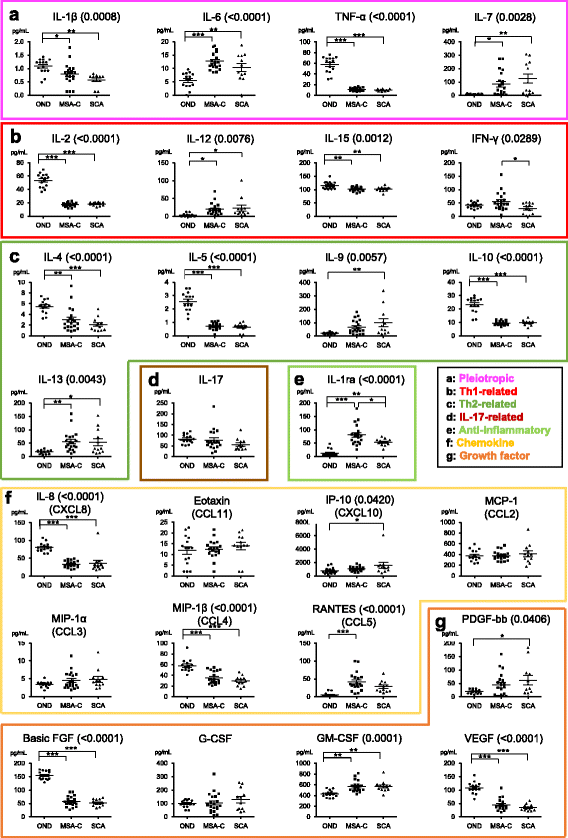
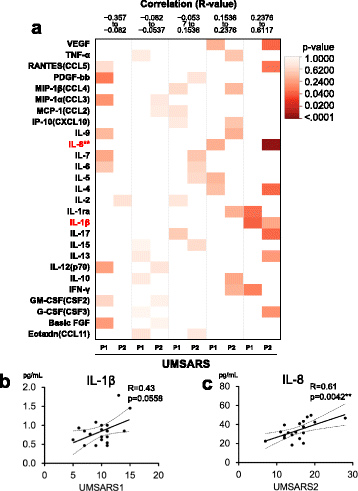
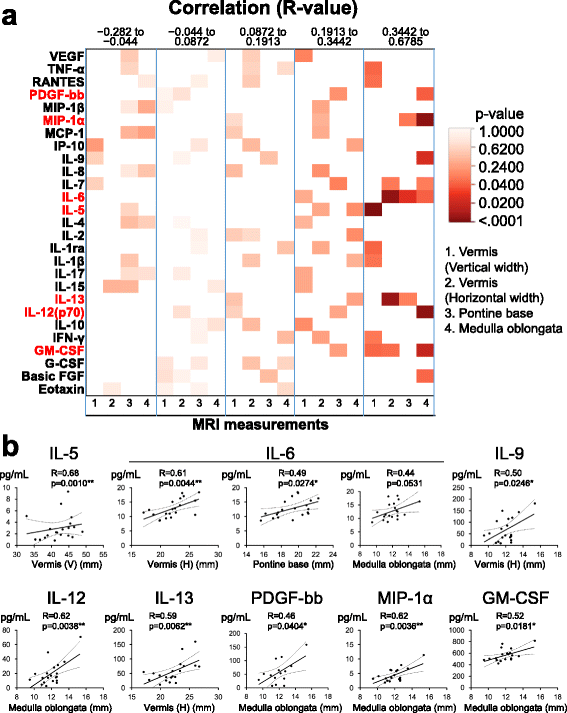
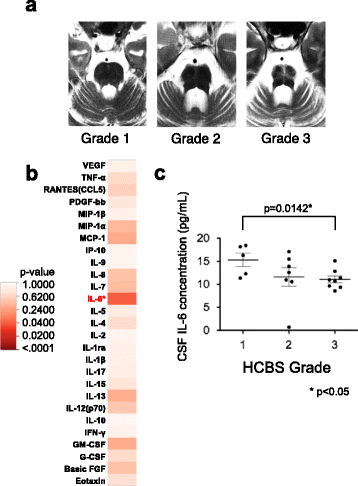
Results: Granulocyte-macrophage colony-stimulating factor (GM-CSF), interleukin (IL)-6, IL-7, IL-12, and IL-13 levels were significantly higher in MSA-C and SCA compared with OND. In MSA-C, IL-5, IL-6, IL-9, IL-12, IL-13, platelet-derived growth factor-bb, macrophage inflammatory protein (MIP)-1α, and GM-CSF levels positively correlated with anteroposterior diameters of the pontine base, vermis, or medulla oblongata. By contrast, in SCA patients, IL-12 and MIP-1α showed significant negative correlations with anteroposterior diameters of the pontine base, and unlike MSA-C, there was no cytokine with a positive correlation in SCA. IL-6 was significantly higher in MSA-C patients with the lowest grade of HCBS compared with those with the highest grade. Macrophage chemoattractant protein-1 (MCP-1) had a significant negative correlation with disease duration only in MSA-C patients. Tumor necrosis factor-alpha, IL-2, IL-15, IL-4, IL-5, IL-10, and IL-8 were all significantly lower in MSA-C and SCA compared with OND, while IL-1ra, an anti-inflammatory cytokine, was elevated only in MSA-C. IL-1β and IL-8 had positive correlations with Unified Multiple System Atrophy Rating Scale part 1 and 2, respectively, in MSA-C.
Conclusions: Although CSF cytokine/chemokine/growth factor profiles were similar between MSA-C and SCA, pro-inflammatory cytokines, such as IL-6, GM-CSF, and MCP-1, correlated with the disease stage in a way higher at the beginning only in MSA-C, reflecting early stronger intrathecal inflammation.
Keywords: Cerebrospinal fluid; Cytokine; Interleukin-6; Magnetic resonance imaging; Monocyte chemoattractant protein-1; Multiple system atrophy.
Figures


Similar articles
-
Characteristic cerebrospinal fluid cytokine/chemokine profiles in neuromyelitis optica, relapsing remitting or primary progressive multiple sclerosis.PLoS One. 2013 Apr 18;8(4):e61835. doi: 10.1371/journal.pone.0061835. Print 2013. PLoS One. 2013. PMID: 23637915 Free PMC article.
-
Cerebrospinal fluid cytokines in multiple system atrophy: A cross-sectional Catalan MSA registry study.Parkinsonism Relat Disord. 2019 Aug;65:3-12. doi: 10.1016/j.parkreldis.2019.05.040. Epub 2019 Jun 3. Parkinsonism Relat Disord. 2019. PMID: 31178335
-
Intrathecal activation of the IL-17/IL-8 axis in opticospinal multiple sclerosis.Brain. 2005 May;128(Pt 5):988-1002. doi: 10.1093/brain/awh453. Epub 2005 Mar 2. Brain. 2005. PMID: 15743872
-
Systemic inflammatory response to exhaustive exercise. Cytokine kinetics.Exerc Immunol Rev. 2002;8:6-48. Exerc Immunol Rev. 2002. PMID: 12690937 Review.
-
Cytokine/chemokine levels in the CSF and serum of anti-NMDAR encephalitis: A systematic review and meta-analysis.Front Immunol. 2023 Jan 23;13:1064007. doi: 10.3389/fimmu.2022.1064007. eCollection 2022. Front Immunol. 2023. PMID: 36761173 Free PMC article.
Cited by
-
Characterization of Mesenchymal Stem Cells Derived from Patients with Cerebellar Ataxia: Downregulation of the Anti-Inflammatory Secretome Profile.Cells. 2020 Jan 15;9(1):212. doi: 10.3390/cells9010212. Cells. 2020. PMID: 31952198 Free PMC article.
-
Induction of regional chemokine expression in response to human umbilical cord blood cell infusion in the neonatal mouse ischemia-reperfusion brain injury model.PLoS One. 2019 Sep 4;14(9):e0221111. doi: 10.1371/journal.pone.0221111. eCollection 2019. PLoS One. 2019. PMID: 31483787 Free PMC article.
-
Adipsin, MIP-1b, and IL-8 as CSF Biomarker Panels for ALS Diagnosis.Dis Markers. 2018 Oct 10;2018:3023826. doi: 10.1155/2018/3023826. eCollection 2018. Dis Markers. 2018. PMID: 30405855 Free PMC article.
-
A Review on Radiologic Hot Cross Bun Sign and Related Clinical Conditions.Cerebellum. 2025 Mar 21;24(3):70. doi: 10.1007/s12311-025-01830-1. Cerebellum. 2025. PMID: 40117078 Review.
-
Development and Validation of a Nomogram Based on Inflammatory Markers for Risk Prediction in Meige Syndrome Patients.J Inflamm Res. 2024 Oct 25;17:7721-7731. doi: 10.2147/JIR.S481649. eCollection 2024. J Inflamm Res. 2024. PMID: 39473982 Free PMC article.
References
Publication types
MeSH terms
Substances
LinkOut - more resources
Full Text Sources
Other Literature Sources
Research Materials
Miscellaneous

