

Protein conformational dynamics studied by 15N and 1H R1ρ relaxation dispersion: Application to wild-type and G53A ubiquitin crystals
- PMID: 28438365
- PMCID: PMC5531261
- DOI: 10.1016/j.ssnmr.2017.04.002
Protein conformational dynamics studied by 15N and 1H R1ρ relaxation dispersion: Application to wild-type and G53A ubiquitin crystals
Abstract
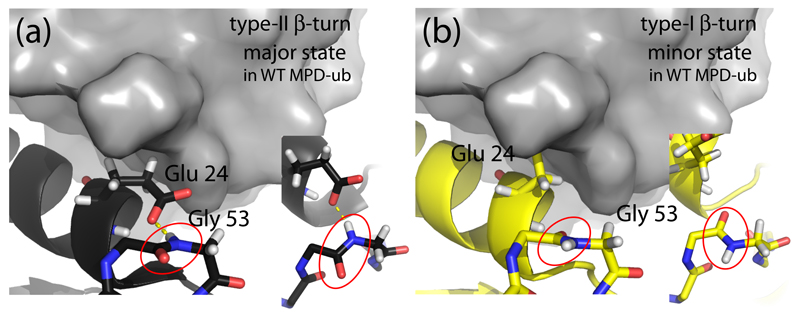
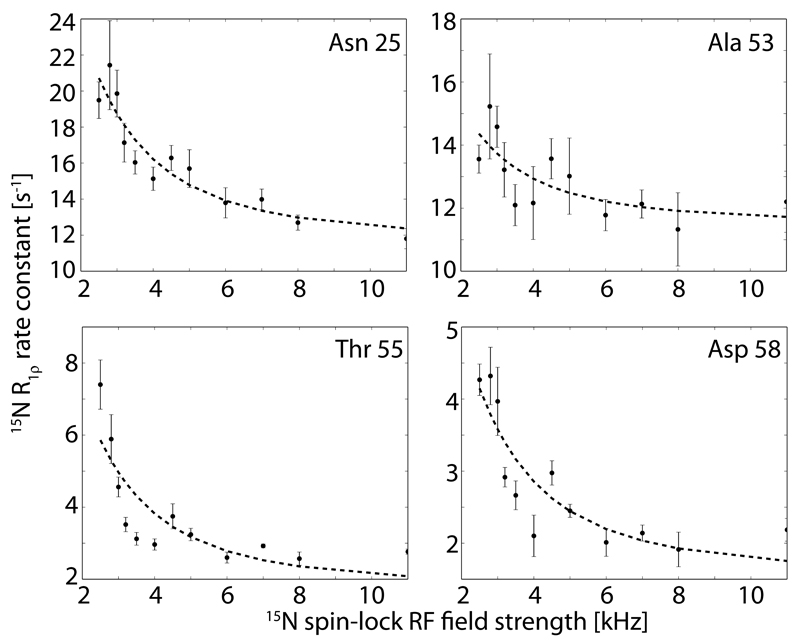
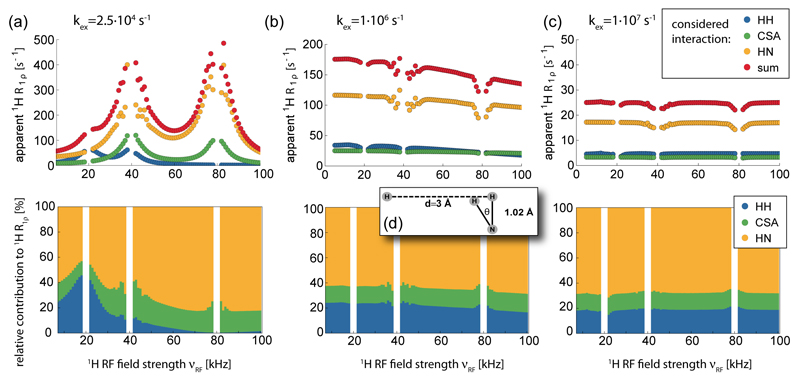
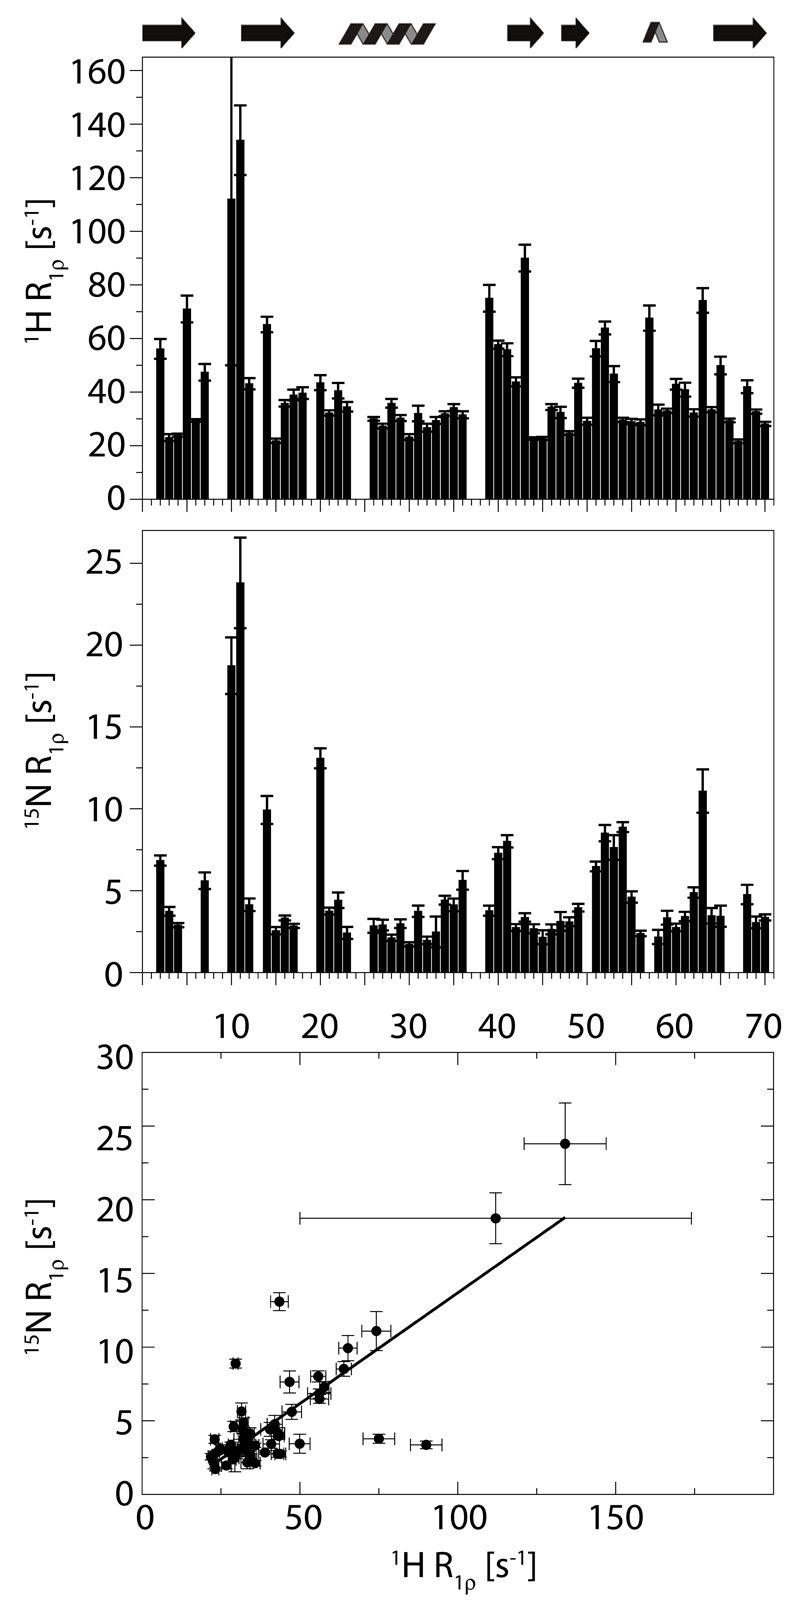
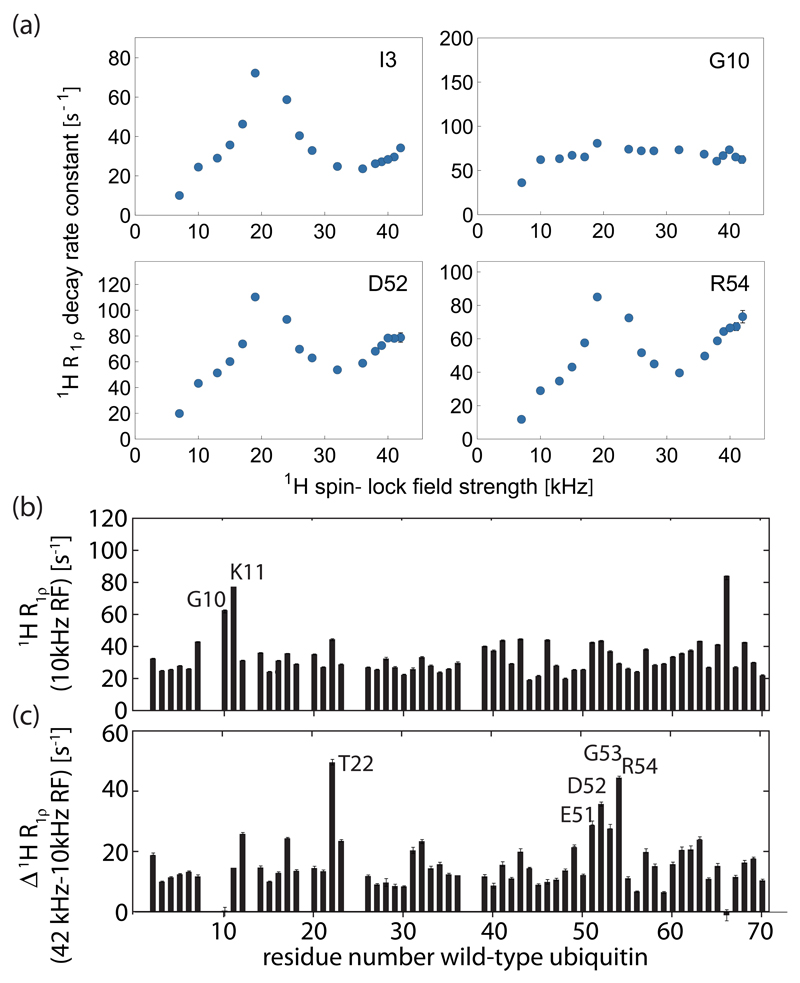
Solid-state NMR spectroscopy can provide site-resolved information about protein dynamics over many time scales. Here we combine protein deuteration, fast magic-angle spinning (~45-60kHz) and proton detection to study dynamics of ubiquitin in microcrystals, and in particular a mutant in a region that undergoes microsecond motions in a β-turn region in the wild-type protein. We use 15N R1ρ relaxation measurements as a function of the radio-frequency (RF) field strength, i.e. relaxation dispersion, to probe how the G53A mutation alters these dynamics. We report a population-inversion of conformational states: the conformation that in the wild-type protein is populated only sparsely becomes the predominant state. We furthermore explore the potential to use amide-1H R1ρ relaxation to obtain insight into dynamics. We show that while quantitative interpretation of 1H relaxation remains beyond reach under the experimental conditions, due to coherent contributions to decay, one may extract qualitative information about flexibility.
Keywords: Fast MAS; Protein dynamics; Proton detection; Proton relaxation; Solid-state NMR; Spin relaxation; β-turn.
Copyright © 2017 Elsevier Inc. All rights reserved.
Figures
Similar articles
-
Microsecond motions probed by near-rotary-resonance R1ρ15N MAS NMR experiments: the model case of protein overall-rocking in crystals.J Biomol NMR. 2018 May;71(1):53-67. doi: 10.1007/s10858-018-0191-4. Epub 2018 May 30. J Biomol NMR. 2018. PMID: 29845494 Free PMC article.
-
Recent advances in solid-state relaxation dispersion techniques.Solid State Nucl Magn Reson. 2020 Aug;108:101665. doi: 10.1016/j.ssnmr.2020.101665. Epub 2020 May 20. Solid State Nucl Magn Reson. 2020. PMID: 32574905 Review.
-
Cross-Correlated Relaxation of Dipolar Coupling and Chemical-Shift Anisotropy in Magic-Angle Spinning R1ρ NMR Measurements: Application to Protein Backbone Dynamics Measurements.J Phys Chem B. 2016 Sep 1;120(34):8905-13. doi: 10.1021/acs.jpcb.6b06129. Epub 2016 Aug 19. J Phys Chem B. 2016. PMID: 27500976 Free PMC article.
-
Probing transient conformational states of proteins by solid-state R(1ρ) relaxation-dispersion NMR spectroscopy.Angew Chem Int Ed Engl. 2014 Apr 22;53(17):4312-7. doi: 10.1002/anie.201311275. Epub 2014 Mar 18. Angew Chem Int Ed Engl. 2014. PMID: 24644028 Free PMC article.
-
Protein dynamics detected by magic-angle spinning relaxation dispersion NMR.Curr Opin Struct Biol. 2023 Oct;82:102660. doi: 10.1016/j.sbi.2023.102660. Epub 2023 Aug 1. Curr Opin Struct Biol. 2023. PMID: 37536064 Review.
Cited by
-
Solid-state NMR reveals a comprehensive view of the dynamics of the flexible, disordered N-terminal domain of amyloid-β fibrils.J Biol Chem. 2019 Apr 12;294(15):5840-5853. doi: 10.1074/jbc.RA118.006559. Epub 2019 Feb 8. J Biol Chem. 2019. PMID: 30737281 Free PMC article.
-
Deuteron Solid-State NMR Relaxation Measurements Reveal Two Distinct Conformational Exchange Processes in the Disordered N-Terminal Domain of Amyloid-β Fibrils.Chemphyschem. 2019 Jul 2;20(13):1680-1689. doi: 10.1002/cphc.201900363. Epub 2019 Jun 14. Chemphyschem. 2019. PMID: 31087613 Free PMC article.
-
Spinning faster: protein NMR at MAS frequencies up to 126 kHz.J Biomol NMR. 2019 Feb;73(1-2):19-29. doi: 10.1007/s10858-018-0219-9. Epub 2019 Jan 24. J Biomol NMR. 2019. PMID: 30680507 Free PMC article.
-
Deuteron rotating frame relaxation for the detection of slow motions in rotating solids.J Magn Reson. 2022 Apr;337:107171. doi: 10.1016/j.jmr.2022.107171. Epub 2022 Feb 19. J Magn Reson. 2022. PMID: 35219160 Free PMC article.
-
Aromatic ring flips in differently packed ubiquitin protein crystals from MAS NMR and MD.J Struct Biol X. 2022 Dec 6;7:100079. doi: 10.1016/j.yjsbx.2022.100079. eCollection 2023. J Struct Biol X. 2022. PMID: 36578472 Free PMC article.
References
-
- Lewandowski JR, Sass HJ, Grzesiek S, Blackledge M, Emsley L. Site-specific measurement of slow motions in proteins. J Am Chem Soc. 2011;133:16762–16765. - PubMed
-
- Schanda P, Huber M, Boisbouvier J, Meier BH, Ernst M. Solid-state NMR measurements of asymmetric dipolar couplings provide insight into protein side-chain motion. Angew Chemie (International Ed English) 2011;50:11005–11009. - PubMed
Publication types
MeSH terms
Substances
Grants and funding
LinkOut - more resources
Full Text Sources
Other Literature Sources
