

Empirical consideration of the effects of acquisition parameters and analysis model on clinically feasible q-ball imaging
- PMID: 28438712
- PMCID: PMC5500983
- DOI: 10.1016/j.mri.2017.04.007
Empirical consideration of the effects of acquisition parameters and analysis model on clinically feasible q-ball imaging
Abstract
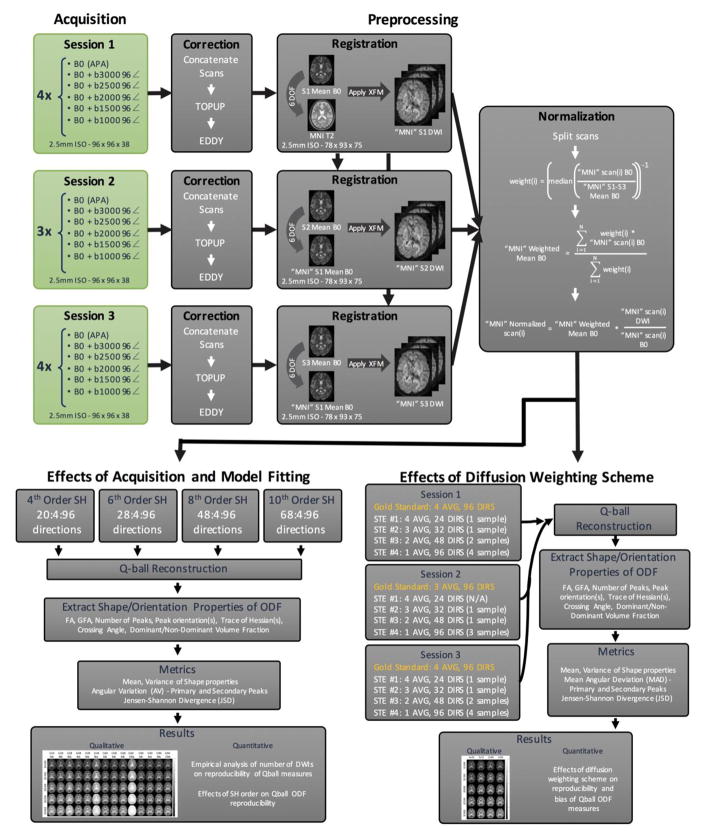
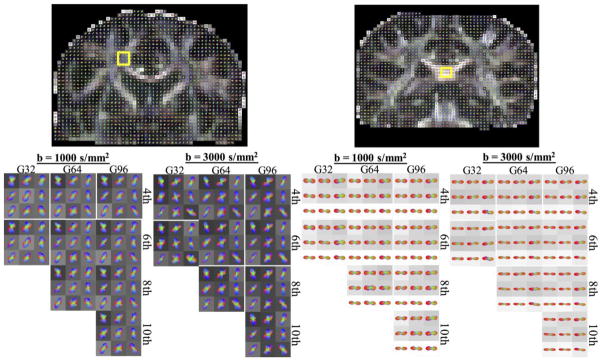
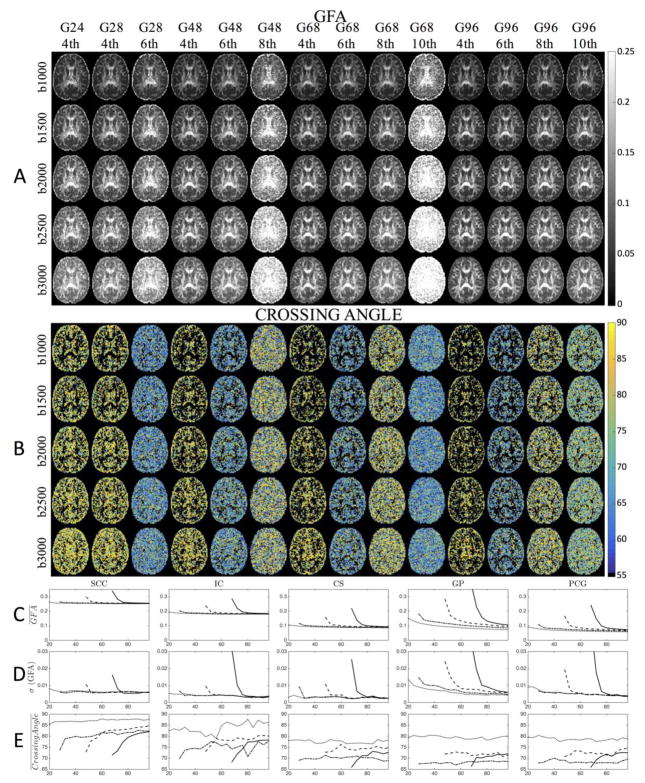
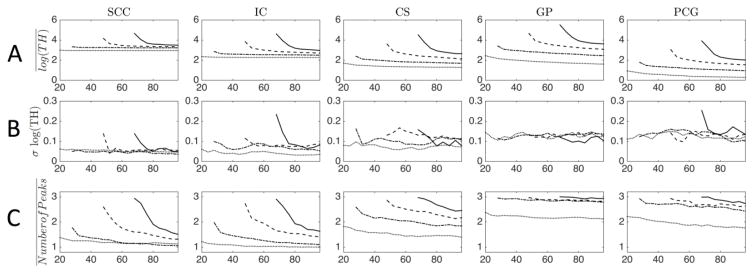
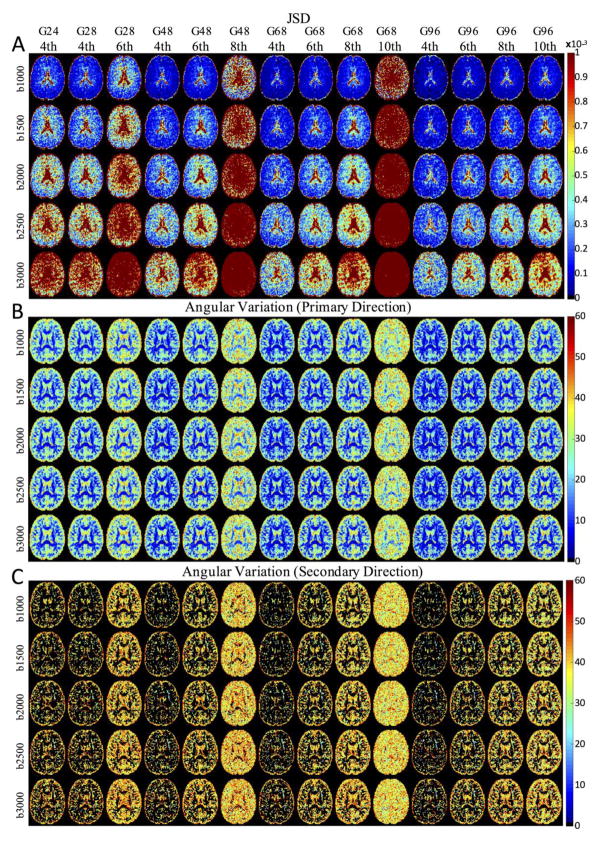
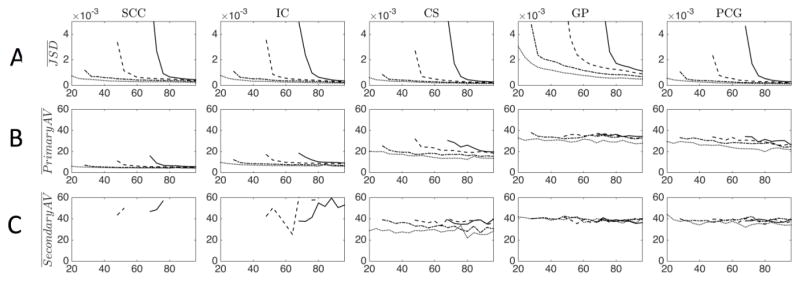
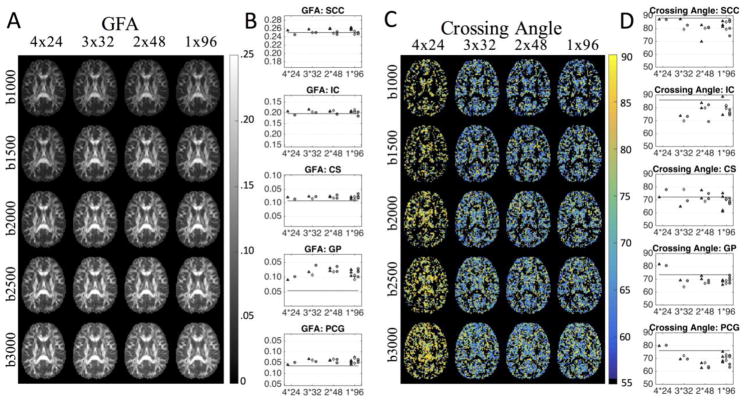
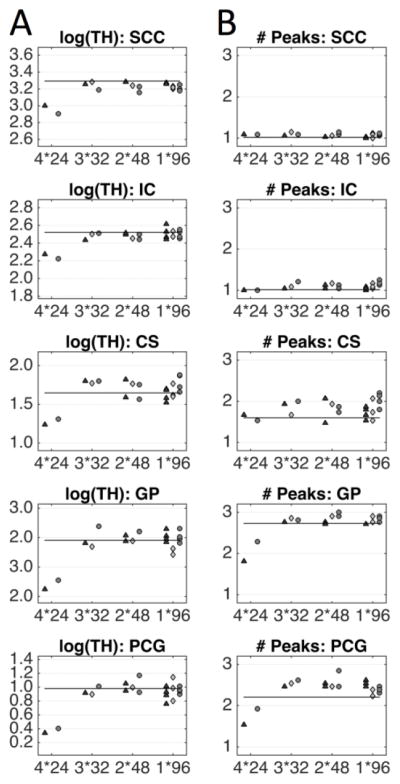
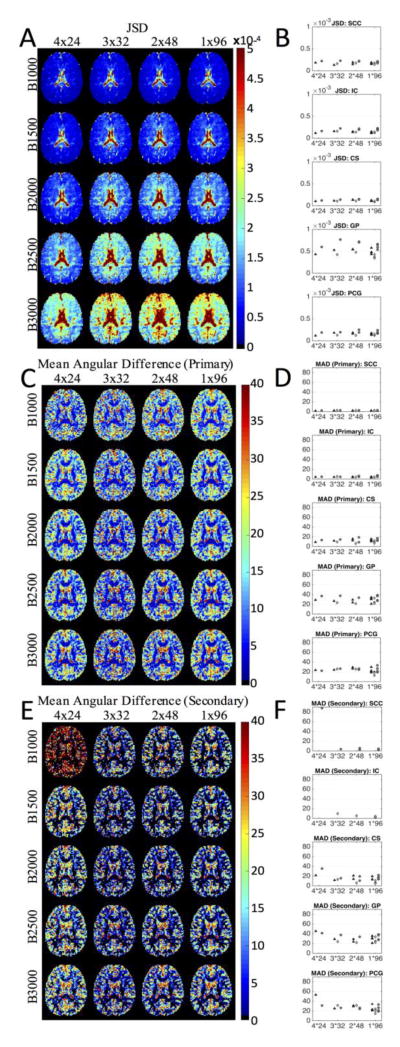
Q-ball imaging (QBI) is a popular high angular resolution diffusion imaging (HARDI) technique used to study brain architecture in vivo. Simulation and phantom-based studies suggest that QBI results are affected by the b-value, the number of diffusion weighting directions, and the signal-to-noise ratio (SNR). However, optimal acquisition schemes for QBI in clinical settings are largely undetermined given empirical (observed) imaging considerations. In this study, we acquire a HARDI dataset at five b-values with 11 repetitions on a single subject to investigate the effects of acquisition scheme and subsequent analysis models on the accuracy and precision of measures of tissue composition and fiber orientation derived from clinically feasible QBI at 3T. Clinical feasibility entails short scan protocols - less than 5minutes in the current study - resulting in lower SNR, lower b-values, and fewer diffusion directions than are typical in most QBI protocols with research applications, where time constraints are less prevalent. In agreement with previous studies, we find that the b-value and number of diffusion directions impact the magnitude and variation of QBI indices in both white matter and gray matter regions; however, QBI indices are most heavily dependent on the maximum order of the spherical harmonic (SH) series used to represent the diffusion orientation distribution function (ODF). Specifically, to ensure numerical stability and reduce the occurrence of false peaks and inflated anisotropy, we recommend oversampling by at least 8-12 more diffusion directions than the number of estimated coefficients for a given SH order. In addition, in an equal scan time comparison of QBI accuracy, we find that increasing the directional resolution of the HARDI dataset is preferable to repeating observations; however, our results indicate that as few as 32 directions at a low b-value (1000s/mm2) captures most of the angular information in the q-ball ODF. Our findings provide guidance for determining an optimal acquisition scheme for QBI in the low SNR and low scan time regime, and suggest that care must be taken when choosing the basis functions used to represent the QBI ODF.
Copyright © 2017 Elsevier Inc. All rights reserved.
Figures
Similar articles
-
Q-ball imaging models: comparison between high and low angular resolution diffusion-weighted MRI protocols for investigation of brain white matter integrity.Neuroradiology. 2016 Feb;58(2):209-15. doi: 10.1007/s00234-015-1616-3. Epub 2015 Nov 16. Neuroradiology. 2016. PMID: 26573606
-
Evaluation of the accuracy and angular resolution of q-ball imaging.Neuroimage. 2008 Aug 1;42(1):262-71. doi: 10.1016/j.neuroimage.2008.03.053. Epub 2008 Apr 9. Neuroimage. 2008. PMID: 18502152
-
Development and initial evaluation of 7-T q-ball imaging of the human brain.Magn Reson Imaging. 2008 Feb;26(2):171-80. doi: 10.1016/j.mri.2007.05.011. Epub 2007 Aug 9. Magn Reson Imaging. 2008. PMID: 17692489 Free PMC article.
-
Boosting the sampling efficiency of q-Ball imaging using multiple wavevector fusion.Magn Reson Med. 2007 Feb;57(2):289-96. doi: 10.1002/mrm.21090. Magn Reson Med. 2007. PMID: 17260358
-
Tractography and the connectome in neurosurgical treatment of gliomas: the premise, the progress, and the potential.Neurosurg Focus. 2020 Feb 1;48(2):E6. doi: 10.3171/2019.11.FOCUS19785. Neurosurg Focus. 2020. PMID: 32006950 Free PMC article. Review.
Cited by
-
Tractography reproducibility challenge with empirical data (TraCED): The 2017 ISMRM diffusion study group challenge.J Magn Reson Imaging. 2020 Jan;51(1):234-249. doi: 10.1002/jmri.26794. Epub 2019 Jun 9. J Magn Reson Imaging. 2020. PMID: 31179595 Free PMC article.
-
Empirical estimation of intravoxel structure with persistent angular structure and Q-ball models of diffusion weighted MRI.J Med Imaging (Bellingham). 2018 Jan;5(1):014005. doi: 10.1117/1.JMI.5.1.014005. Epub 2018 Mar 6. J Med Imaging (Bellingham). 2018. PMID: 29531965 Free PMC article.
-
A Comparative Study of Diffusion Fiber Reconstruction Models for Pyramidal Tract Branches.Front Neurosci. 2021 Dec 9;15:777377. doi: 10.3389/fnins.2021.777377. eCollection 2021. Front Neurosci. 2021. PMID: 34955727 Free PMC article.
-
Histological validation of diffusion MRI fiber orientation distributions and dispersion.Neuroimage. 2018 Jan 15;165:200-221. doi: 10.1016/j.neuroimage.2017.10.046. Epub 2017 Oct 23. Neuroimage. 2018. PMID: 29074279 Free PMC article.
References
-
- Mori S, Crain BJ, Chacko VP, van Zijl PC. Three-dimensional tracking of axonal projections in the brain by magnetic resonance imaging. Annals of neurology. 1999;45(2):265–269. - PubMed
-
- Basser PJ, Pajevic S, Pierpaoli C, Duda J, Aldroubi A. In vivo fiber tractography using DT-MRI data. Magnetic resonance in medicine: official journal of the Society of Magnetic Resonance in Medicine/Society of Magnetic Resonance in Medicine. 2000;44(4):625–632. - PubMed
-
- Alexander AL, Hasan KM, Lazar M, Tsuruda JS, Parker DL. Analysis of partial volume effects in diffusion-tensor MRI. Magnetic resonance in medicine: official journal of the Society of Magnetic Resonance in Medicine/Society of Magnetic Resonance in Medicine. 2001;45(5):770–780. - PubMed
MeSH terms
Grants and funding
LinkOut - more resources
Full Text Sources
Other Literature Sources
