. 2017 Jun 16;292(24):9975-9987.
doi: 10.1074/jbc.M117.776476. Epub 2017 Apr 24.

Allosteric mechanism of action of the therapeutic anti-IgE antibody omalizumab

Affiliations

Allosteric mechanism of action of the therapeutic anti-IgE antibody omalizumab

Anna M Davies et al. J Biol Chem. .

Abstract

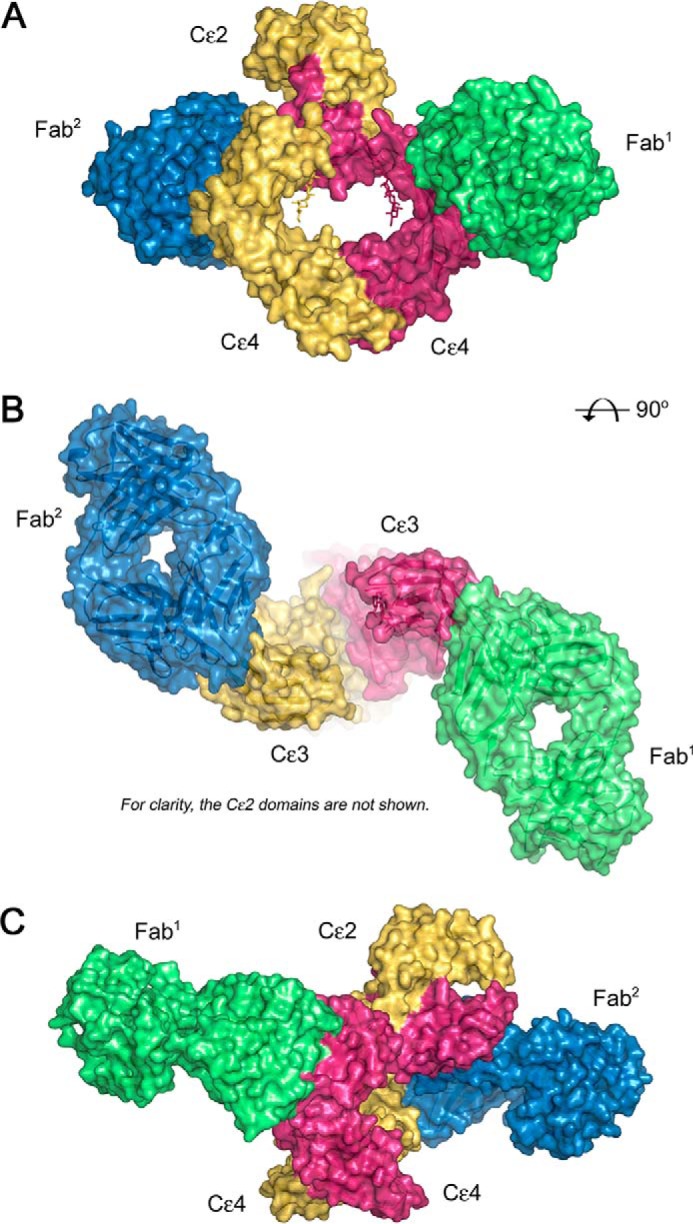
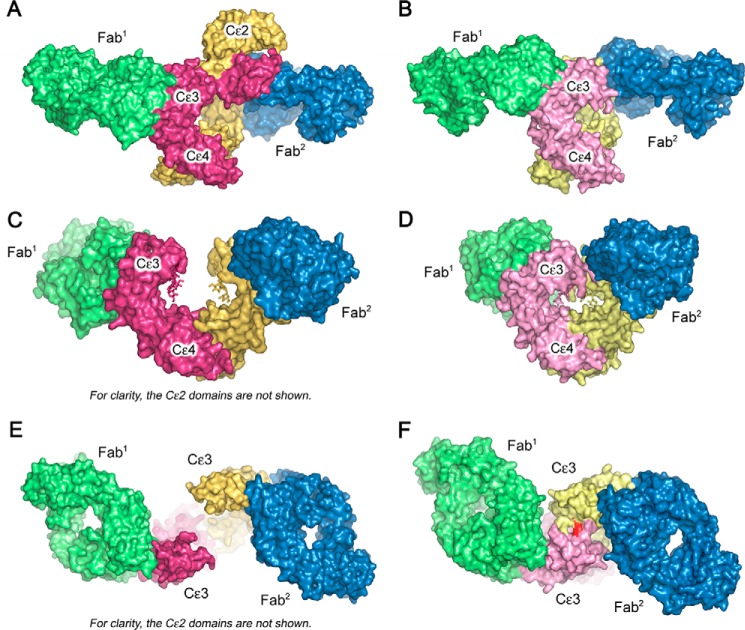
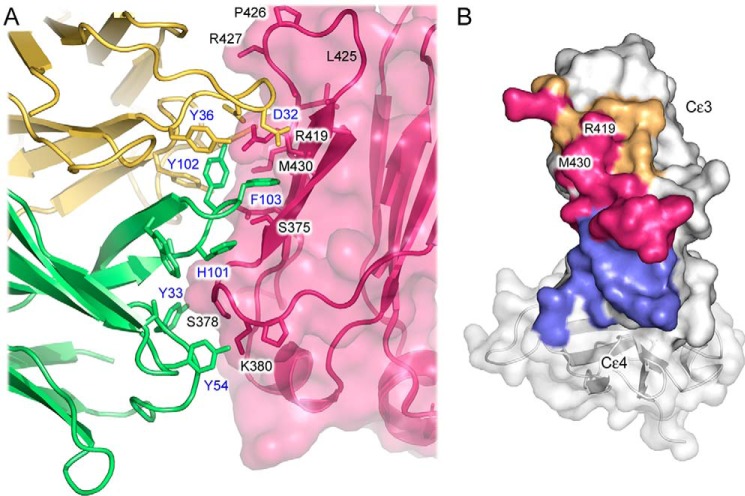
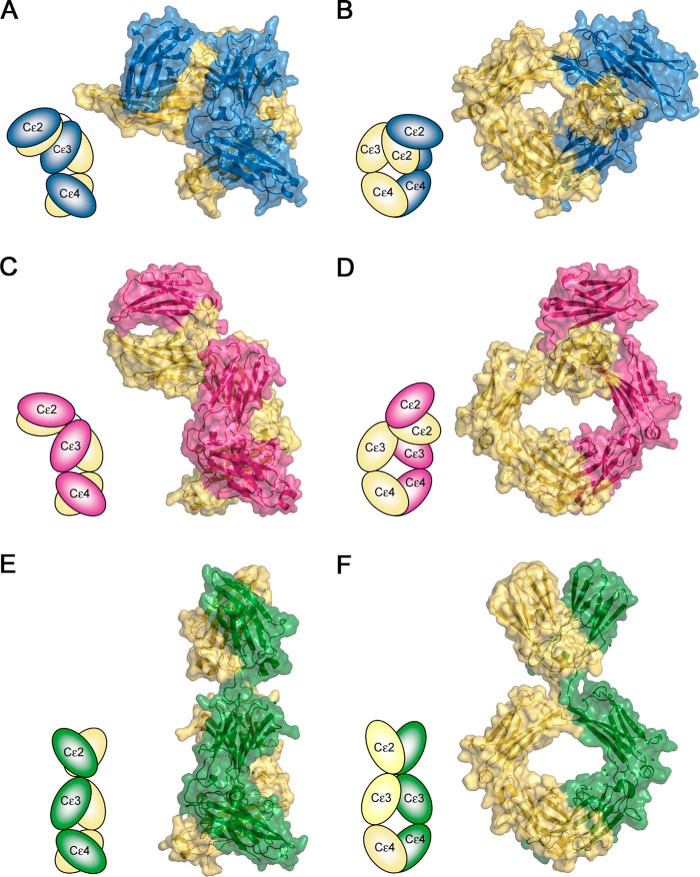
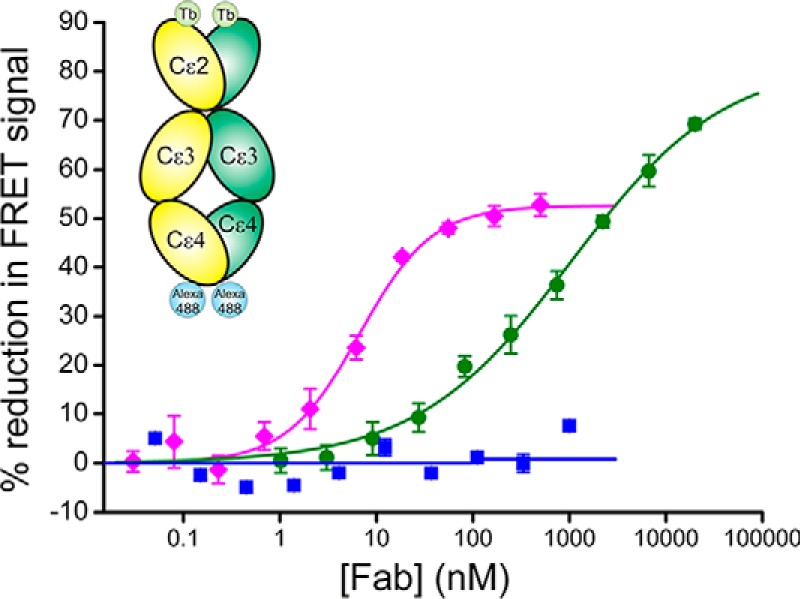
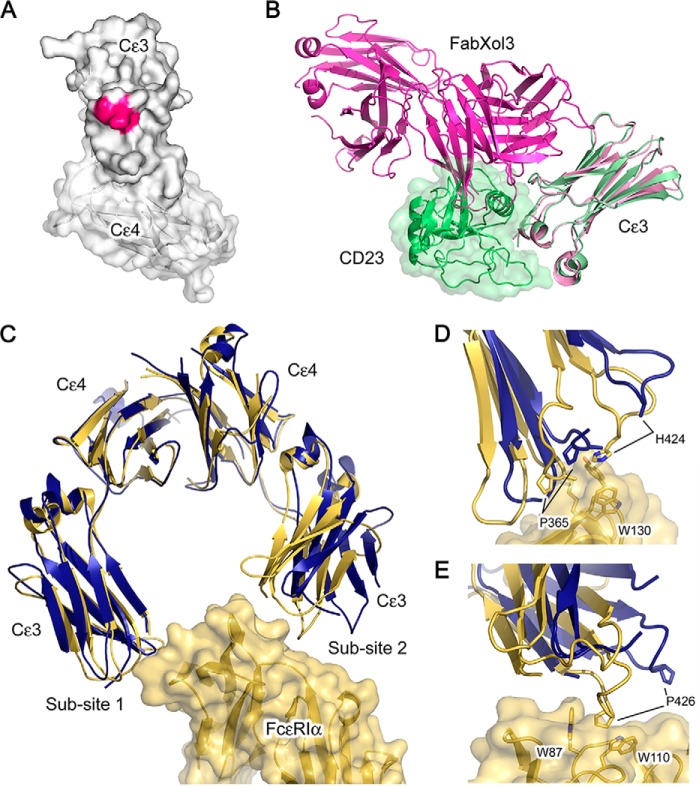
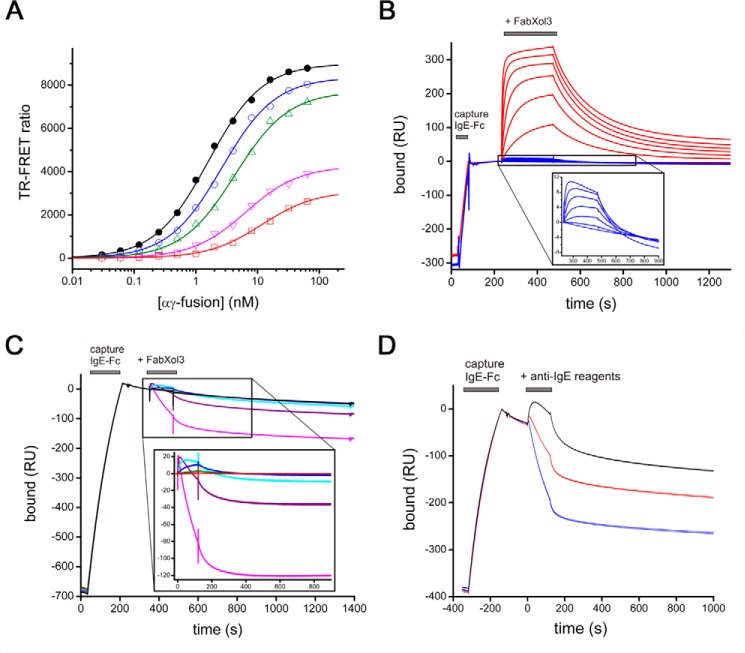
Immunoglobulin E and its interactions with receptors FcϵRI and CD23 play a central role in allergic disease. Omalizumab, a clinically approved therapeutic antibody, inhibits the interaction between IgE and FcϵRI, preventing mast cell and basophil activation, and blocks IgE binding to CD23 on B cells and antigen-presenting cells. We solved the crystal structure of the complex between an omalizumab-derived Fab and IgE-Fc, with one Fab bound to each Cϵ3 domain. Free IgE-Fc adopts an acutely bent structure, but in the complex it is only partially bent, with large-scale conformational changes in the Cϵ3 domains that inhibit the interaction with FcϵRI. CD23 binding is inhibited sterically due to overlapping binding sites on each Cϵ3 domain. Studies of omalizumab Fab binding in solution demonstrate the allosteric basis for FcϵRI inhibition and, together with the structure, reveal how omalizumab may accelerate dissociation of receptor-bound IgE from FcϵRI, exploiting the intrinsic flexibility and allosteric potential of IgE.

Keywords: X-ray crystallography; allergy; allosteric regulation; antibody; immunoglobulin E (IgE); omalizumab.


Conflict of interest statement

J. D., B. P. C., T. C., G. C., M. W., and A. J. H. are employees of UCB-Celltech. T. C., G. C., and A. J. H. are in receipt of stock options. UCB-Celltech has filed a patent application based on elements of this work with the UK Intellectual Property Office

Figures

Figure 1.
Figure 1.
Overall structure of IgE-Fc in complex with FabXol3. A, FabXol3 binds to IgE-Fc with 2:1 stoichiometry. Fab1 (green) engages IgE-Fc chain B (pink) exclusively through the Cϵ3 domain. Fab2 (blue) interacts with IgE-Fc chain A (yellow) through the Cϵ3 domain and forms a minor interaction with the Cϵ2 domain from IgE-Fc chain B (pink). B, two Fabs form a pseudo-symmetric complex about the 2-fold axis of the Fcϵ3–4 region. For clarity, the Cϵ2 domains are not shown. C, IgE-Fc is asymmetrically bent in the FabXol3 complex. The Cϵ2 domain from chain B (pink) contacts Fab2 (blue).
Figure 2.
Figure 2.
Comparison of the FabXol3/IgE-Fc and omalizumab Fab/Fcϵ3–4 complexes. A, side view of IgE-Fc (yellow and pink) in the FabXol3 (green and blue) complex, showing the asymmetric bend in IgE-Fc. B, side view of the constrained Fcϵ3–4 molecule (pale yellow and pink) in the omalizumab Fab (green and blue) complex (20). C, front view of IgE-Fc in the FabXol3 complex (90° clockwise rotation from the view shown in A). For clarity, the (Cϵ2)2 domain pair is not shown. D, front view of the constrained Fcϵ3–4 molecule in the omalizumab Fab complex (90° clockwise rotation from the view shown in B). E, top view of IgE-Fc in the FabXol3 complex (90° rotation toward the reader from the view shown in C). For clarity, the (Cϵ2)2 domain pair is not shown. F, top view of the constrained Fcϵ3–4 molecule in the omalizumab Fab complex (90° rotation toward the reader from the view shown in D). The position of the engineered disulfide bond that locks the Cϵ3 domains into a closed conformation is colored red.
Figure 3.
Figure 3.
A, interface between FabXol3 and IgE-Fc. The interface between FabXol3 Fab2 (heavy and light chains colored in green and yellow, respectively) and the Cϵ3 domain from IgE-Fc (pink) is shown. FabXol3 and Cϵ3 domain residue labels are colored blue and black, respectively. The interface includes hydrogen bonds and van der Waals interactions. A notable feature of the interface is a cation/π interaction between Arg-419 (Cϵ3 domain) and Phe-103 (FabXol3 CDRH3). The Phe-103 side chain is mostly buried in a pocket created by Thr-373, Trp-374, Ser-375, Gln-417, and Arg-419 (Cϵ3 domain). B, FabXol3 and DARPin E2_79 (21) bind to an overlapping interface on the Cϵ3 domain. IgE-Fc residues, which only form part of the FabXol3 interface, are colored orange, and those that only form part of the DARPin E2_79 interface, which includes part of the Cϵ3-Cϵ4 linker, are colored in blue. IgE-Fc residues colored in pink, which include Arg-419 and Met-430, are common to both FabXol3 and DARPin E2_79 interfaces.
Figure 4.
Figure 4.
Conformational flexibility in IgE-Fc. A, side view of free IgE-Fc (8) showing its acute asymmetric bend. B, front view of free IgE-Fc (90° anti-clockwise rotation from the view shown in A). C, side view of IgE-Fc from the FabXol3 complex, revealing a partially bent conformation. D, front view of IgE-Fc in the FabXol3 complex (90° anti-clockwise rotation from the view shown in C). E, side view of fully extended IgE-Fc captured by an anti-IgE-Fc Fab (aϵFab) (16). F, front view of extended IgE-Fc (90° anti-clockwise rotation from the view shown in E).
Figure 5.
Figure 5.
Effect of anti-IgE Fabs on IgE-Fc conformation measured by FRET. The FRET ratio (E520/E485) was measured in the presence of different concentrations of anti-IgE Fabs, either FabXol3 (magenta), aϵFab (green), or control Fab (blue). aϵFab has previously been shown to fully unbend IgE-Fc (16); the control Fab binds to the Cϵ2 domain of IgE-Fc and does not cause unbending of the molecule.
Figure 6.
Figure 6.
Disruption of the interaction between IgE-Fc and CD23 and between IgE-Fc and FcϵRI. A, Cϵ3 domain residues that are common to both FabXol3 and CD23 interfaces are colored pink. B, superposition of the Cϵ3 domains from the FabXol3/IgE-Fc complex (light pink) and the previously reported crystal structure of CD23 in complex with Fcϵ3–4 (11) (light green) reveals clashes between CD23 (green) and FabXol3 (dark pink). The CD23/Fcϵ3–4 complex structure (11) is with an IgE-Fc construct (Fcϵ3–4) that lacks the (Cϵ2)2 domain pair. For clarity, the Cϵ4 domains are not shown. C, in the FabXol3 complex, the Cϵ3 domains adopt the most open conformation reported thus far for IgE-Fc, which precludes engagement with FcϵRIα. The structure of IgE-Fc in complex with sFcϵRIα (8) is colored yellow, and the two sub-sites of receptor engagement are indicated. The structure of FabXol3 in complex with IgE-Fc (blue) was superposed on the Cϵ4 domains. D, positions of Pro-365 and His-424 at sub-site 1 are indicated to highlight the different positions adopted by the Cϵ3 domains. E, substantial displacement of Pro-426 in the FabXol3 complex prevents engagement of the proline sandwich at sub-site 2.
Figure 7.
Figure 7.
Interaction studies of FabXol3 with IgE-Fc. Direct binding was measured for IgE-Fc to immobilized FabXol3 (A), FabXol (B), and intact omalizumab (C). Fabs or intact antibodies were covalently immobilized at low density using an amine coupling kit (GE Healthcare); IgE-Fc was flowed over these surfaces at a variety of concentrations, using a 2-fold dilution series with a highest concentration of 100 nm. D, binding of FabXol3 to IgE-Fc captured via a C-terminal His tag; FabXol3 was flowed over IgE-Fc in a 2-fold dilution series with a highest concentration of 100 nm. E, binding of the second FabXol3-binding site was characterized using an SPR sandwich binding experiment. IgE-Fc was captured on a FabXol3 surface, and then a second FabXol3 molecule was added to the IgE-Fc/FabXol3 complex in a 2-fold dilution series starting at 1000 nm. For all binding experiments, all concentrations were run in duplicate.
Figure 8.
Figure 8.
Temperature dependence of the accelerated dissociation of the IgE-Fc/FabXol3 complex, mediated by the binding of the second FabXol3 molecule. Binding of the second FabXol3-binding site was characterized using SPR sandwich binding experiments at 5, 15, 25, and 35 °C (A–D). IgE-Fc was first captured on a FabXol3 surface and then a second FabXol3 molecule was added to the IgE-Fc/FabXol3 complex, in a 2-fold dilution series starting at 1.6 μm. At low temperature, almost no FabXol3-mediated accelerated dissociation of the IgE-Fc/FabXol3 complex occurs, whereas the effect is markedly increased at higher temperatures.
Figure 9.
Figure 9.
Analysis of competition binding experiments and accelerated dissociation. A, TR-FRET competition binding experiments between FabXol3 and αγ-fusion protein for IgE-Fc. Binding between terbium-labeled αγ-fusion protein and Alexa Fluor 647-labeled IgE-Fc was measured with increasing concentrations of unlabeled FabXol3 as inhibitor: 0 μm (black), 2.5 nm (blue), 5 nm (green), 10 nm (magenta), 20 nm (red). As an inhibitor, FabXol3 affects both the apparent KD and Bmax values of the interaction between IgE-Fc and αγ-fusion protein, indicating some allosteric inhibition properties. B, comparison of the ability of FabXol3 to bind to IgE-Fc captured by a C-terminal His tag (red) and IgE-Fc captured by binding to sFcϵRIα (blue); a 2-fold dilution series was tested for each, starting at 1000 nm. The inset shows that FabXol3 can still bind to the IgE-Fc/sFcϵRIα complex, but with a low Bmax value. C, accelerated dissociation of the IgE-Fc/sFcϵRIα complex mediated by increasing concentrations of FabXol3. The 1:1 IgE-Fc/sFcϵRIα complex was first established by capturing IgE-Fc on immobilized sFcϵRIα and then binding FabXol3 in a 5-fold dilution series starting at 5000 nm. The inset shows a magnification of the accelerated dissociation process. D, comparison of the accelerated dissociation of the IgE-Fc/sFcϵRIα complex mediated by intact omalizumab (black), FabXol (red), or FabXol3 (blue), each at a concentration of 5 μm. All binding experiments were performed at 25 °C, except those characterizing the second FabXol3-binding site (B), which were performed at 5 °C to minimize allosteric communication between the two sites.

References

    1. Gould H. J., and Sutton B. J. (2008) IgE in allergy and asthma today. Nat. Rev. Immunol. 8, 205–217 - PubMed
    1. Sutton B. J., and Davies A. M. (2015) Structure and dynamics of IgE–receptor interactions: FcϵRI and CD23/FcϵRII. Immunol. Rev. 268, 222–235 - PubMed
    1. Holgate S. T. (2014) New strategies with anti-IgE in allergic diseases. World Allergy Organ. J. 7, 17. - PMC - PubMed
    1. Holowka D., and Baird B. (1983) Structural studies on the membrane-bound immunoglobulin E (IgE)-receptor complex. 2. Mapping of distances between sites on IgE and the membrane surface. Biochemistry 22, 3475–3484 - PubMed
    1. Zheng Y., Shopes B., Holowka D., and Baird B. (1991) Conformations of IgE bound to its receptor FcϵRI and in solution. Biochemistry 30, 9125–9132 - PubMed

Publication types

MeSH terms

Associated data

LinkOut - more resources