

Short FtsZ filaments can drive asymmetric cell envelope constriction at the onset of bacterial cytokinesis
- PMID: 28438890
- PMCID: PMC5452018
- DOI: 10.15252/embj.201696235
Short FtsZ filaments can drive asymmetric cell envelope constriction at the onset of bacterial cytokinesis
Abstract
FtsZ, the bacterial homologue of eukaryotic tubulin, plays a central role in cell division in nearly all bacteria and many archaea. It forms filaments under the cytoplasmic membrane at the division site where, together with other proteins it recruits, it drives peptidoglycan synthesis and constricts the cell. Despite extensive study, the arrangement of FtsZ filaments and their role in division continue to be debated. Here, we apply electron cryotomography to image the native structure of intact dividing cells and show that constriction in a variety of Gram-negative bacterial cells, including Proteus mirabilis and Caulobacter crescentus, initiates asymmetrically, accompanied by asymmetric peptidoglycan incorporation and short FtsZ-like filament formation. These results show that a complete ring of FtsZ is not required for constriction and lead us to propose a model for FtsZ-driven division in which short dynamic FtsZ filaments can drive initial peptidoglycan synthesis and envelope constriction at the onset of cytokinesis, later increasing in length and number to encircle the division plane and complete constriction.
Keywords: Caulobacter crescentus; FtsZ; asymmetric division; bacterial cell division; electron cryotomography.
© 2017 The Authors.
Figures
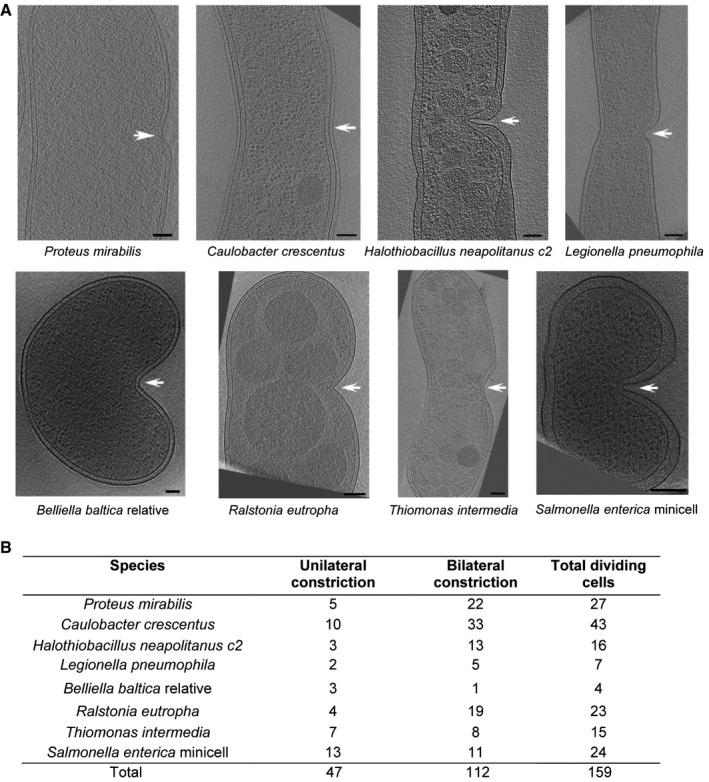
Representative central slices of tomograms of eight different constricted cells are shown, arranged so that the asymmetric division site is on the right (indicated by white arrows). Scale bars, 100 nm.
Table showing the numbers of cells observed constricting asymmetrically and symmetrically for each species.
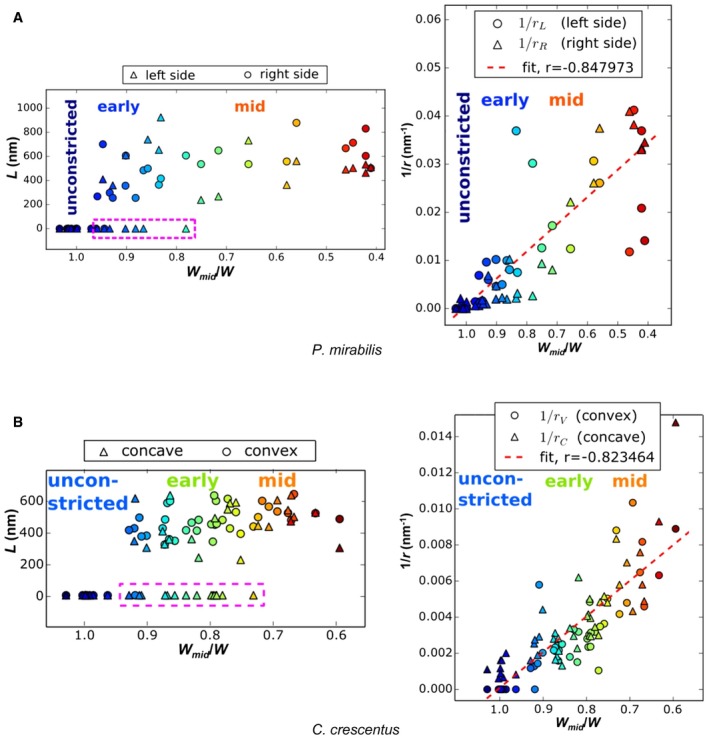
- A, B
Indentation length (L) and curvature sharpness (1/r) of P. mirabilis (A) and C. crescentus (B) cells increase as W mid/W decreases throughout division. The circles represent the measured values from the left sides; the triangles denote the measured values from the right sides. Note that these assignments are arbitrary for straight P. mirabilis cells. Colors in (A and B) indicate the corresponding numbers in Figs 2 and 3, respectively. The purple dashed boxes at left highlight cells with detectable indentation only on one side. The red dashed lines at right are the best‐fit line, showing a high degree of correlation. “Unconstricted”, “early”, and “mid” denote the pre‐constriction stage, early‐constriction stage, and mid‐constriction stages in cell division. These stages are roughly determined by W mid/W.
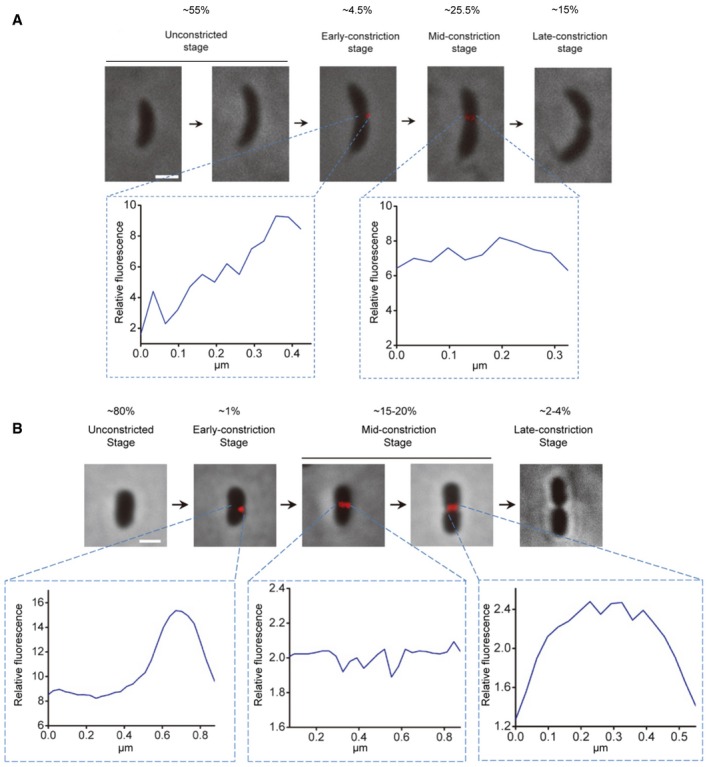
- A, B
Localization of new PG incorporation in different stages of C. crescentus (A) and P. mirabilis (B) cytokinesis. In each panel, the upper row shows the fluorescence (HADA) images of representative cells in different cell division stages overlaid with phase contrast images showing the cell profiles. The bottom rows show fluorescence profiles of the division plane of the indicated early‐constriction and mid‐constriction stage cells. The numbers in (A) and (B) are 1/10 values of the 8‐bit gray values measured using the NIH ImageJ software. Scale bars, 1 μm.
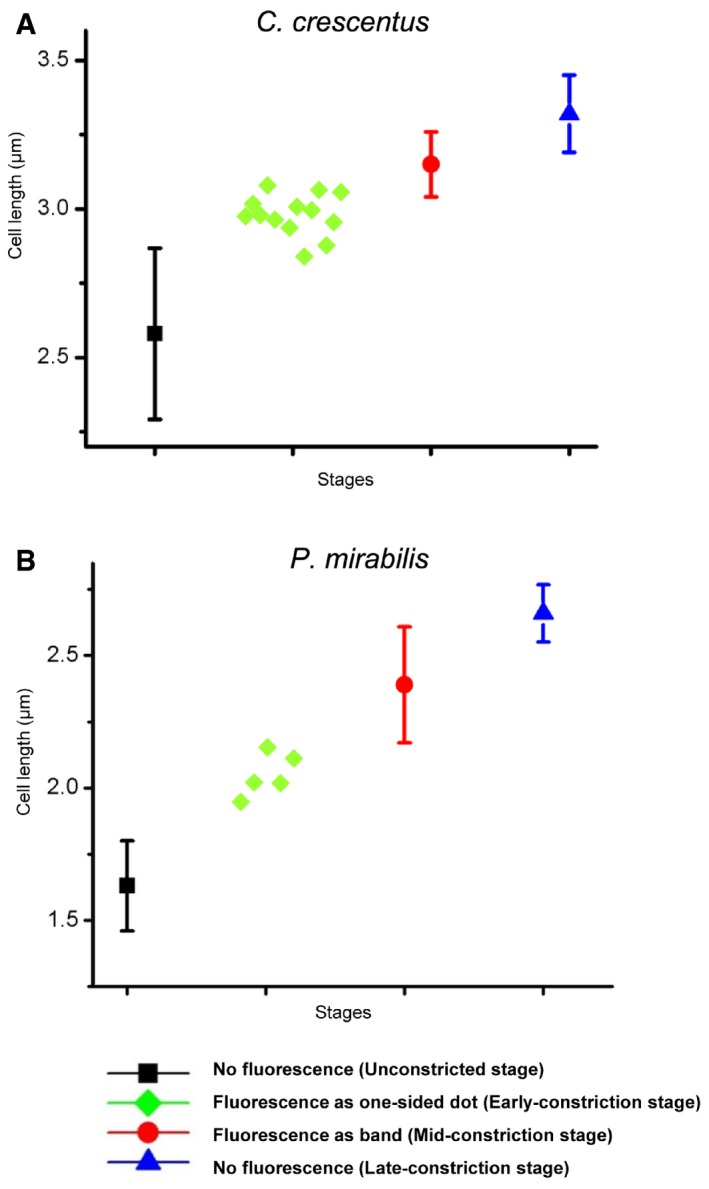
- A, B
For C. crescentus (A) and P. mirabilis (B) cells labeled with HADA, the cell length statistics for different stages are shown. For the unconstricted, mid‐constriction, and late‐constriction stages, the cell length was measured in 15 randomly selected cells, and the mean and standard deviation (bars) are plotted using the indicated symbols. The cell lengths of all observed early‐constriction stage cells with one‐sided HADA incorporation are plotted with green diamonds.
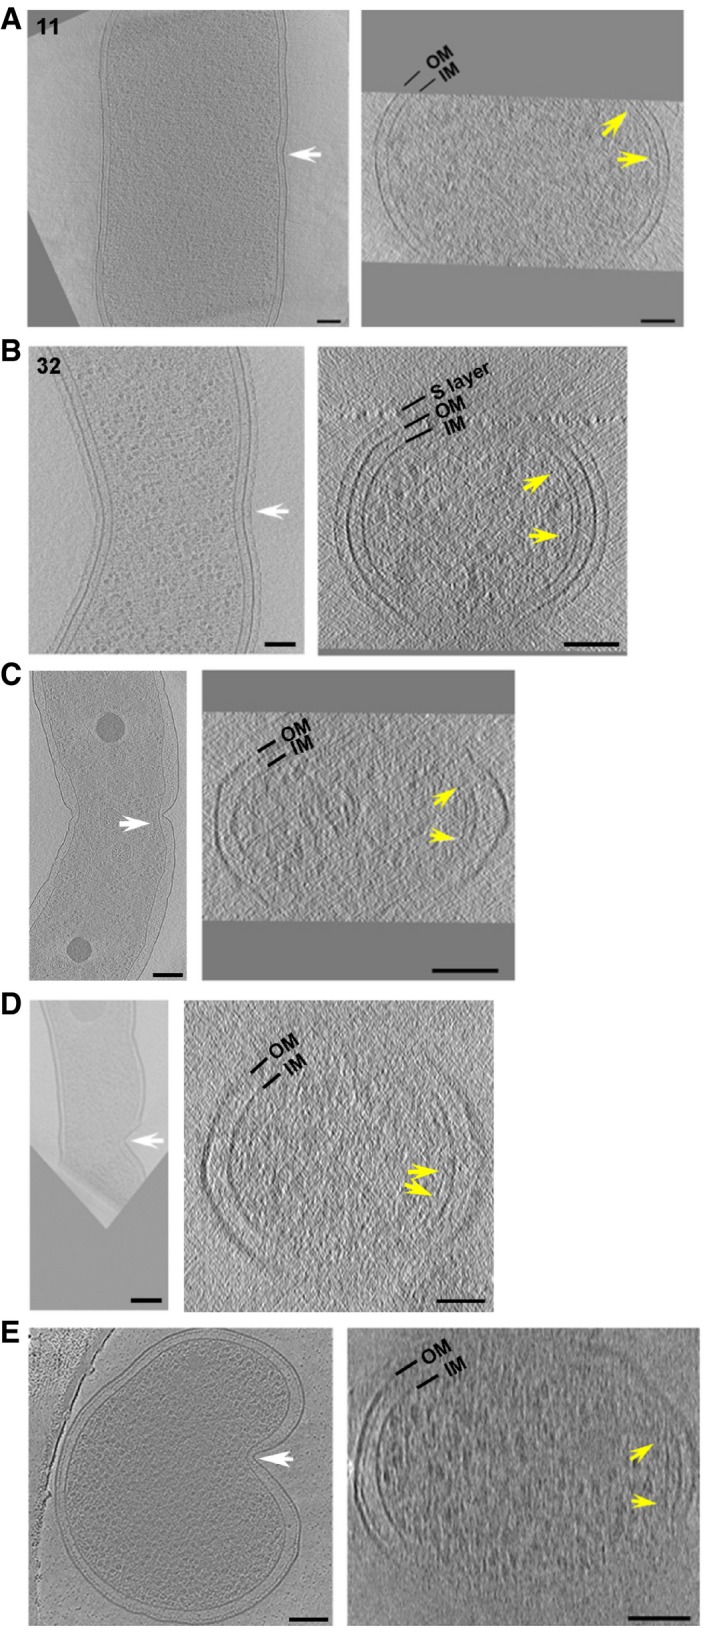
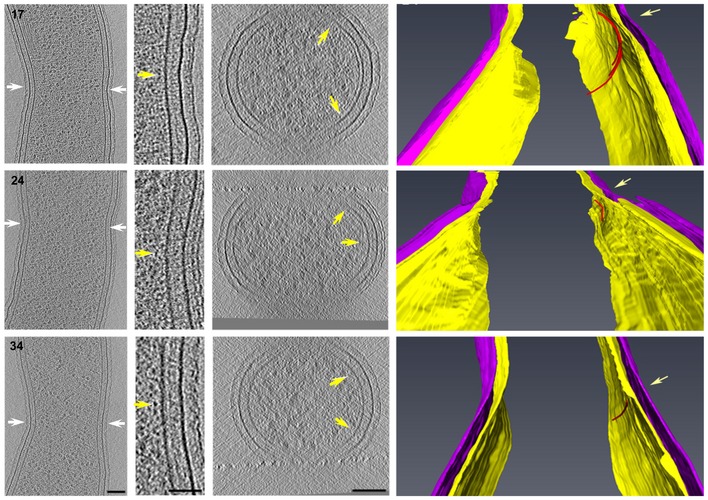
- A–E
Short FtsZ‐like filaments accompany early asymmetric cell constriction in P. mirabilis (A), C. crescentus (B), H. neapolitanus c2 (C), L. pneumophila (D), and S. enterica spp. enterica minicells (E). The two cells in (A) and (B) correspond to cells nos. 11 and 32 in Figs 2 and 3, respectively. A central x‐y slice is shown at left. White arrows highlight the asymmetric constriction and indicate the plane of the cross‐sectional x‐z slice shown at right. The limits of visibility or apparent ends of continuous FtsZ‐like filaments are marked by yellow arrows. OM, outer membrane; IM, inner membrane. Scale bars, 100 nm.
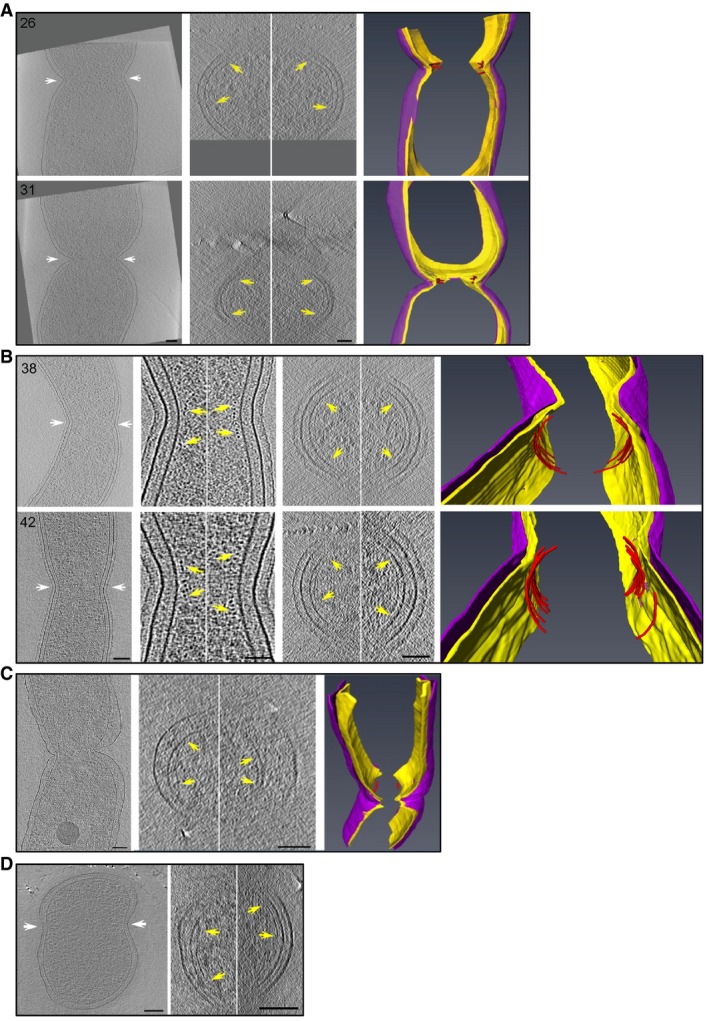
- A–D
FtsZ‐like filament localization in mid‐constriction stages of P. mirabilis (A), C. crescentus (B), H. neapolitanus c2 (C), and S. enterica spp. enterica minicells (D) division. Representative central x‐y slices of 3D tomographic reconstructions of mid‐constriction stage cells are shown on the left. Cell orientation is the same as in Fig 3. White arrows highlight the constriction sites and indicate the cross‐sectional x‐z slice plane. In (B), enlarged views of x‐y slices of both the inner (left) and outer (right) curvature of the division site are shown, with yellow arrows indicating FtsZ‐like filament cross sections. In all panels, the middle column shows an x‐z slice of the division site. Yellow arrows indicate FtsZ‐like filaments. Segmentations are shown at right, highlighting the inner (yellow) and outer (purple) membranes, and all FtsZ‐like filaments observed (red). The two cells in (A) correspond to cells nos. 26 and 31 in Fig 2; the two cells in (B) correspond to nos. 38 and 42 in Fig 3. Scale bars, 50 nm in second column in (B); all other scale bars, 100 nm; scale is the same in upper and lower panels in (A) and (B); segmentations not to scale.
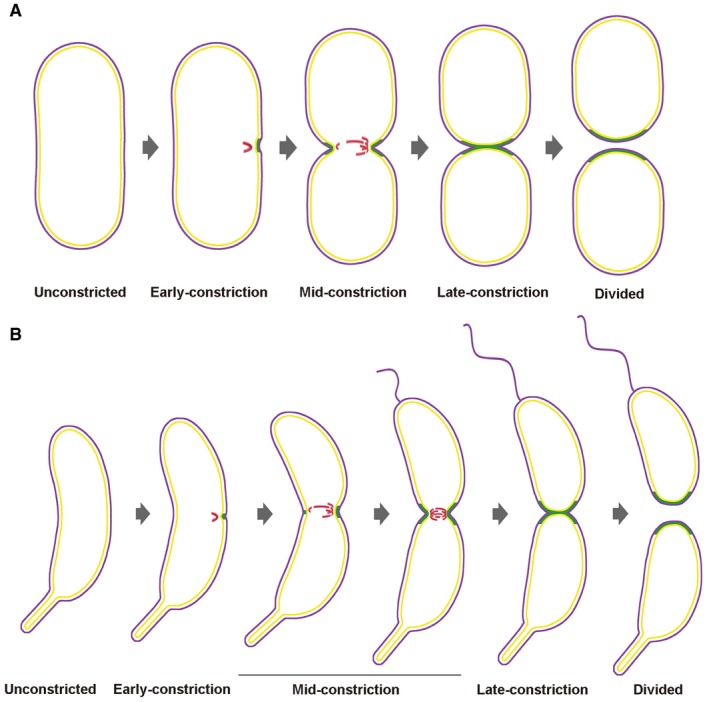
- A, B
The diagrams show progression through cell division of P. mirabilis (A) and C. crescentus (B). The cell envelope profiles were drawn according to the experimental images. FtsZ filaments are shown in red, new PG incorporation in green, and outer and inner membranes in purple and yellow, respectively. In the early‐constriction stage, short arc‐like FtsZ filaments assemble on one side of the cell, recruiting PG synthesis and driving initial, asymmetric constriction of the cell envelope. Later, FtsZ filaments accumulate, forming a bundle of overlapping filaments that covers the entire division plane in the mid‐constriction stage. Finally, these highly dynamic filaments drive PG synthesis and constriction symmetrically around the division plane until cytokinesis is complete.
Similar articles
-
FtsA Regulates Z-Ring Morphology and Cell Wall Metabolism in an FtsZ C-Terminal Linker-Dependent Manner in Caulobacter crescentus.J Bacteriol. 2020 Mar 11;202(7):e00693-19. doi: 10.1128/JB.00693-19. Print 2020 Mar 11. J Bacteriol. 2020. PMID: 31932314 Free PMC article.
-
The tubulin homologue FtsZ contributes to cell elongation by guiding cell wall precursor synthesis in Caulobacter crescentus.Mol Microbiol. 2007 May;64(4):938-52. doi: 10.1111/j.1365-2958.2007.05720.x. Mol Microbiol. 2007. PMID: 17501919
-
FzlA, an essential regulator of FtsZ filament curvature, controls constriction rate during Caulobacter division.Mol Microbiol. 2018 Jan;107(2):180-197. doi: 10.1111/mmi.13876. Epub 2017 Dec 1. Mol Microbiol. 2018. PMID: 29119622 Free PMC article.
-
FtsZ dynamics in bacterial division: What, how, and why?Curr Opin Cell Biol. 2021 Feb;68:163-172. doi: 10.1016/j.ceb.2020.10.013. Epub 2020 Nov 18. Curr Opin Cell Biol. 2021. PMID: 33220539 Free PMC article. Review.
-
A new factor stimulating peptidoglycan hydrolysis to separate daughter cells in Caulobacter crescentus.Mol Microbiol. 2010 Jul 1;77(1):11-4. doi: 10.1111/j.1365-2958.2010.07225.x. Epub 2010 May 24. Mol Microbiol. 2010. PMID: 20497501 Review.
Cited by
-
How advances in cryo-electron tomography have contributed to our current view of bacterial cell biology.J Struct Biol X. 2022 Feb 26;6:100065. doi: 10.1016/j.yjsbx.2022.100065. eCollection 2022. J Struct Biol X. 2022. PMID: 35252838 Free PMC article.
-
Simulations suggest a constrictive force is required for Gram-negative bacterial cell division.Nat Commun. 2019 Mar 19;10(1):1259. doi: 10.1038/s41467-019-09264-0. Nat Commun. 2019. PMID: 30890709 Free PMC article.
-
Unite to divide: Oligomerization of tubulin and actin homologs regulates initiation of bacterial cell division.F1000Res. 2018 Feb 28;7:235. doi: 10.12688/f1000research.13504.1. eCollection 2018. F1000Res. 2018. PMID: 29560258 Free PMC article. Review.
-
Locating macromolecules and determining structures inside bacterial cells using electron cryotomography.Biochim Biophys Acta Proteins Proteom. 2018 Sep;1866(9):973-981. doi: 10.1016/j.bbapap.2018.06.003. Epub 2018 Jun 13. Biochim Biophys Acta Proteins Proteom. 2018. PMID: 29908328 Free PMC article. Review.
-
The cell envelope of Thermotogae suggests a mechanism for outer membrane biogenesis.Proc Natl Acad Sci U S A. 2023 May 2;120(18):e2303275120. doi: 10.1073/pnas.2303275120. Epub 2023 Apr 24. Proc Natl Acad Sci U S A. 2023. PMID: 37094164 Free PMC article.
References
-
- Adams DW, Errington J (2009) Bacterial cell division: assembly, maintenance and disassembly of the Z ring. Nat Rev Microbiol 7: 642–653 - PubMed
-
- Addinall SG, Lutkenhaus J (1996) FtsZ‐spirals and ‐arcs determine the shape of the invaginating septa in some mutants of Escherichia coli . Mol Microbiol 22: 231–237 - PubMed
-
- Bi EF, Lutkenhaus J (1991) FtsZ ring structure associated with division in Escherichia coli . Nature 354: 161–164 - PubMed
MeSH terms
Substances
Grants and funding
LinkOut - more resources
Full Text Sources
Other Literature Sources
