. 2017 Jun 5;372(1722):20160128.
doi: 10.1098/rstb.2016.0128.

Disease ecology, health and the environment: a framework to account for ecological and socio-economic drivers in the control of neglected tropical diseases

Affiliations

Disease ecology, health and the environment: a framework to account for ecological and socio-economic drivers in the control of neglected tropical diseases

A Garchitorena et al. Philos Trans R Soc Lond B Biol Sci. .

Abstract

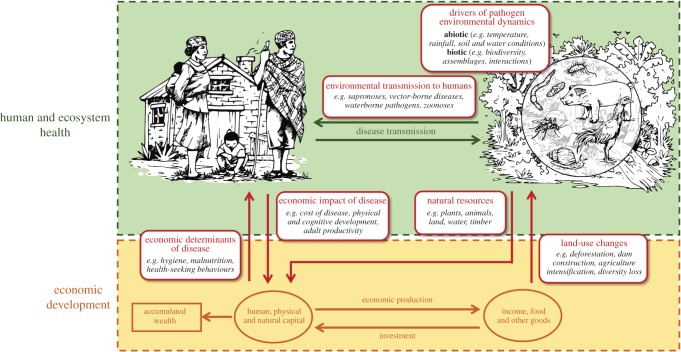
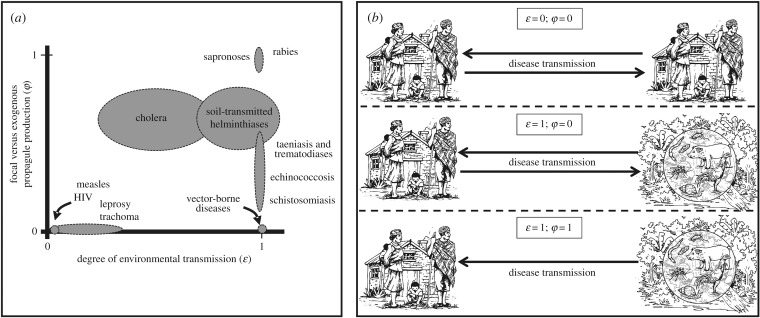
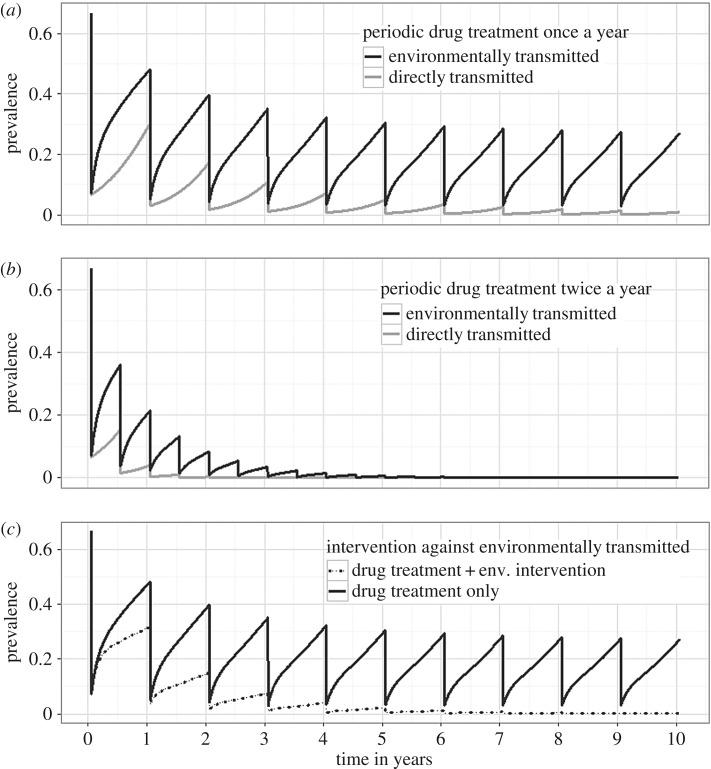
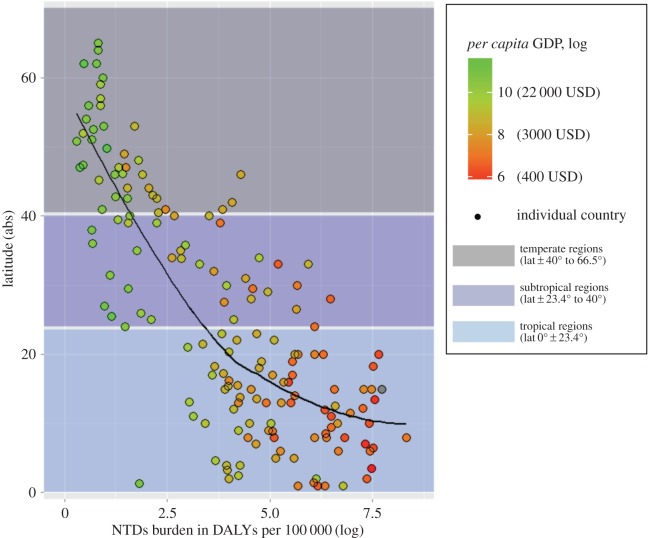
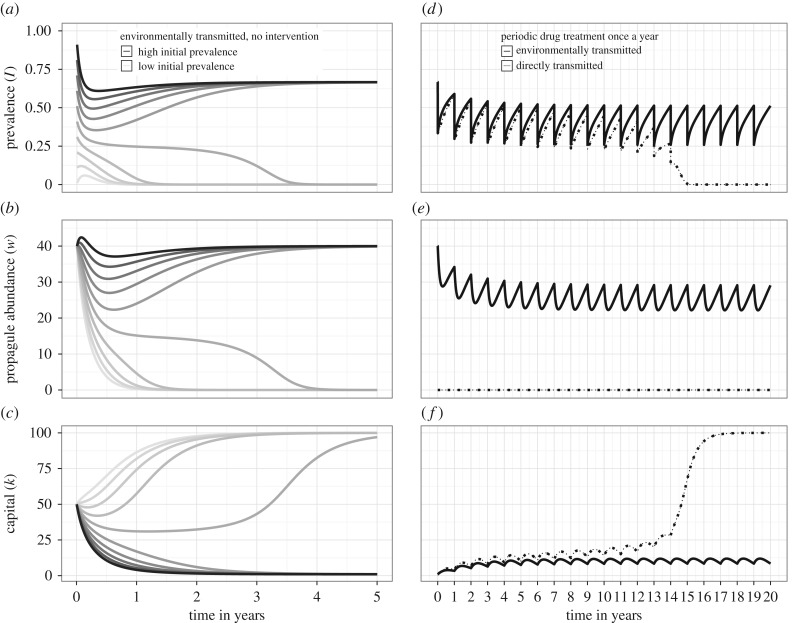
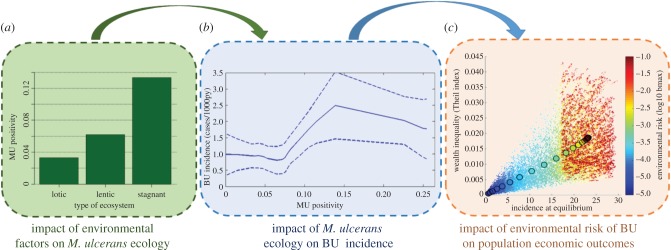
Reducing the burden of neglected tropical diseases (NTDs) is one of the key strategic targets advanced by the Sustainable Development Goals. Despite the unprecedented effort deployed for NTD elimination in the past decade, their control, mainly through drug administration, remains particularly challenging: persistent poverty and repeated exposure to pathogens embedded in the environment limit the efficacy of strategies focused exclusively on human treatment or medical care. Here, we present a simple modelling framework to illustrate the relative role of ecological and socio-economic drivers of environmentally transmitted parasites and pathogens. Through the analysis of system dynamics, we show that periodic drug treatments that lead to the elimination of directly transmitted diseases may fail to do so in the case of human pathogens with an environmental reservoir. Control of environmentally transmitted diseases can be more effective when human treatment is complemented with interventions targeting the environmental reservoir of the pathogen. We present mechanisms through which the environment can influence the dynamics of poverty via disease feedbacks. For illustration, we present the case studies of Buruli ulcer and schistosomiasis, two devastating waterborne NTDs for which control is particularly challenging.This article is part of the themed issue 'Conservation, biodiversity and infectious disease: scientific evidence and policy implications'.

Keywords: coupled ecological–economic systems; environmentally transmitted diseases; planetary health; sustainable disease control.


Conflict of interest statement

The authors declare no competing financial interests.

Figures

Figure 1.
Figure 1.
Coupled natural and human systems: feedbacks between ecosystems, infectious diseases and economic development. Many human pathogens in tropical regions, including those that cause NTDs, spend part of their lifecycle outside the human host, where environmental conditions drive their ecology and transmission (upper panel). Ecosystem and disease dynamics influence key forms of capital necessary for economic development of at-risk human communities (lower panel). Simultaneously, economic activities and resources affect those same dynamics by altering vulnerability to disease and introducing land-use change to ecosystems.
Figure 2.
Figure 2.
A conceptual framework to account for multiple pathways of disease transmission in coupled economic–epidemiological systems. (a) Qualitative classification of relevant infectious and parasitic diseases in developing countries according to two key parameters that regulate environmental transmission in this conceptual framework (ɛ and φ). Ellipsoids represent educated guesses about the parameter space occupied by each disease, including major NTD groups. (b) Graphical representation of the three main groups of diseases according to parameters ɛ and φ: directly transmitted (ɛ = 0; φ = 0), environmentally transmitted, with focal transmission dependent on human prevalence (ɛ = 1; φ = 0) and environmentally transmitted, driven purely by exogenous environmental factors (ɛ = 1; φ = 1).
Figure 3.
Figure 3.
Effectiveness of periodic drug treatment and environmental interventions for the control of diseases with different transmission pathways. Population prevalence dynamics over 10 years for a directly transmitted disease (grey lines) and an ETD (black lines) with human drug treatment dispensed once a year (a) or twice a year (b). We considered a 90% drop in prevalence after each treatment and R0 = 3 for both the directly transmitted and the ETD (see the electronic supplementary material, Appendix S1 for further parameter values). In (c), only the dynamics of an ETD are displayed, with model parameters set as in (a) and two interventions considered: only drug treatment administered once a year (solid line), and the same drug administration complemented with an environmental intervention (e.g. water sanitation, use of insecticide or biological control) that reduces life expectancy of the pathogen environmental stages by one-third (dashed line).
Figure 4.
Figure 4.
Latitudinal gradient in NTDs burden and poverty. Tropical and subtropical regions (blue and light blue shade) bear an overwhelming burden of NTDs, represented in the x-axis as DALY per 100 000 population (logarithmic scale). These regions accumulate 88.0% and 11.8% of the global number of NTD-related DALYs, respectively, which together represents more than 99% of the world burden. Concurrently, tropical and subtropical regions present some of the lowest levels of per capita GDP in the world (dot colour gradient from red for lowest GDP to green for highest GDP). The black solid line in the graph shows the relationship between latitude and NTD-related DALYs (loess nonlinear smoother). Figure was created with R statistical software (package ggplot2) with country data obtained from [–25].
Figure 5.
Figure 5.
Dynamics of coupled economic–epidemiological systems and impact of periodic drug treatment for directly and environmentally transmitted diseases. Graphs are based on the coupled system described in the main text, and parameter values described in the electronic supplementary material, Appendix S1. (a–c) Dynamics over 5 years in a coupled system for the case of an ETD with R0 = 3. Graphs display dynamics of human prevalence (I), pathogen environmental abundance (W), and per capita capital (k), starting from a range of initial conditions for prevalence I, with same k and W. Shades are increasingly dark for increasing values of initial prevalence. Bistability emerges from this system, with two equilibria depending on initial conditions: a high prevalence low capital equilibrium, and a low prevalence high capital equilibrium. (d–f) Impact of human drug treatment dispensed once a year on the dynamics over 20 years for a directly transmitted disease (dotted lines) and an ETD (solid lines) in a coupled economic–epidemiological system. Initial conditions were set as in the high-prevalence–low-capital equilibrium in the left panel, to assess the effectiveness of this intervention to break a theoretical disease-driven poverty trap. R0 = 3 for both types of disease.
Figure 6.
Figure 6.
Understanding feedbacks between environment, Buruli ulcer and economic development. A recent research initiative in Cameroon sought to characterize the environmental dynamics of M. ulcerans through frequent sampling of multiple aquatic ecosystems and molecular analyses, in order to gain new insights on the ecology and epidemiology of the disease. (a) The prevalence of the bacteria in aquatic sites (MU positivity) appeared to be favoured by specific conditions in stagnant and slow-flowing (lentic) ecosystems [46]. (b) Comparisons of M. ulcerans ecological dynamics with patterns of Buruli ulcer incidence from the same areas in mathematical and statistical models, showed that spatial and temporal patterns of Buruli ulcer (y-axis) were influenced by the environmental prevalence of M. ulcerans (x-axis) [48]. (c) Individual-based model simulations of a coupled economic–epidemiological system adapted to Buruli ulcer revealed that the disease can be responsible of economic inequalities in endemic populations, with increases in Theil index (y-axis) as a function of BU incidence (x-axis) and M. ulcerans environmental load (colour gradient) [38]. Figures are adapted from Garchitorena et al. [38,46,48].

References

    1. Sachs J. 2001. Macroeconomics and health: investing in health for economic development. Report of the Commission on Macroeconomics and Health. Geneva, Switzerland: WHO.
    1. Lozano R, et al. 2012. Global and regional mortality from 235 causes of death for 20 age groups in 1990 and 2010: a systematic analysis for the Global Burden of Disease Study 2010. Lancet 380, 2095–2128. (10.1016/S0140-6736(12)61728-0) - DOI - PMC - PubMed
    1. World Health Organization 2015. Investing to overcome the global impact of neglected tropical diseases: Third WHO report on neglected tropical diseases. Geneva, Switzerland: WHO.
    1. Hotez PJ, Fenwick A, Savioli L, Molyneux DH. 2009. Rescuing the bottom billion through control of neglected tropical diseases. Lancet 373, 1570–1575. (10.1016/S0140-6736(09)60233-6) - DOI - PubMed
    1. Hotez PJ, Kamath A. 2009. Neglected tropical diseases in sub-Saharan Africa: review of their prevalence, distribution, and disease burden. PLoS Negl. Trop. Dis. 3, e412 (10.1371/journal.pntd.0000412) - DOI - PMC - PubMed