. 2017 May 9;114(19):4881-4886.
doi: 10.1073/pnas.1618082114. Epub 2017 Apr 24.

Quantifying the influence of global warming on unprecedented extreme climate events

Affiliations

Quantifying the influence of global warming on unprecedented extreme climate events

Noah S Diffenbaugh et al. Proc Natl Acad Sci U S A. .

Abstract

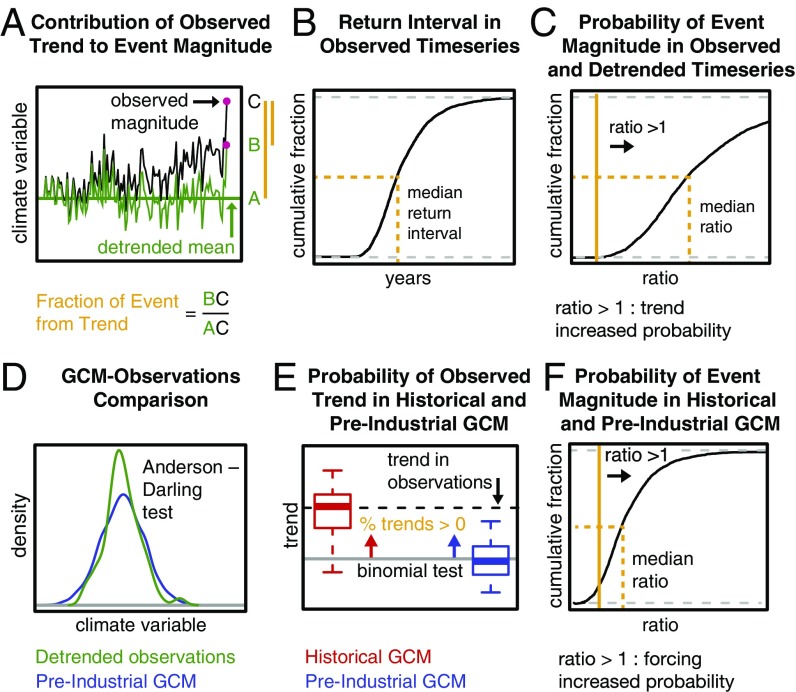
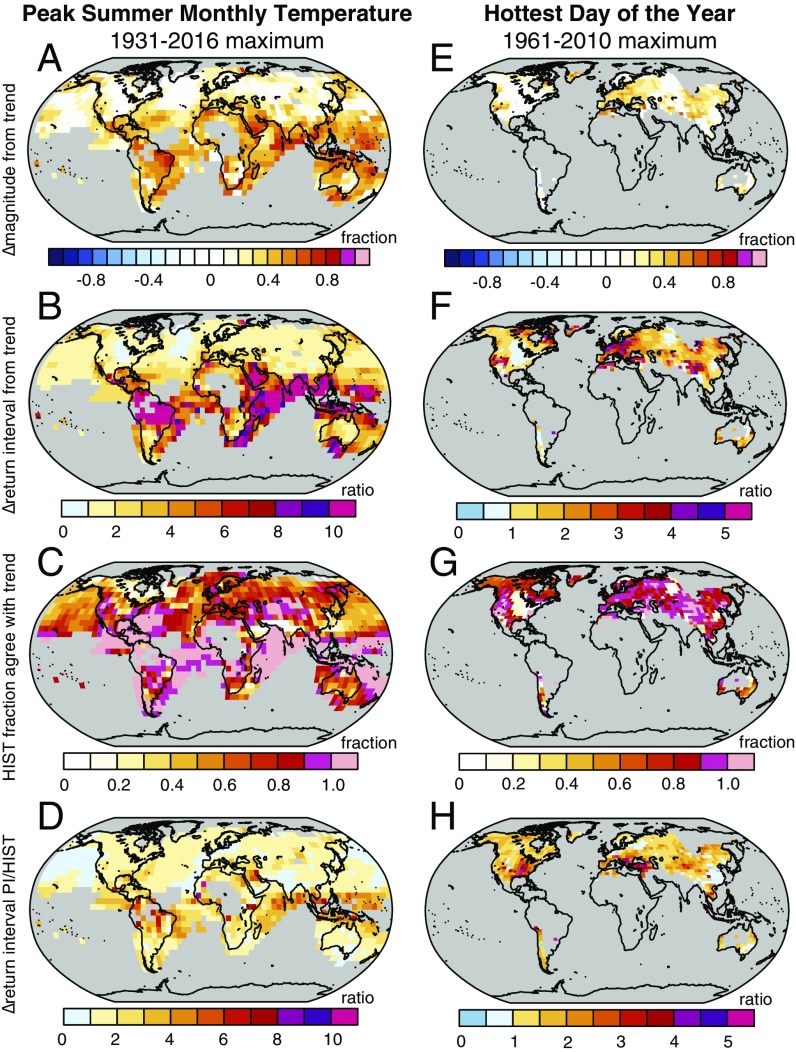
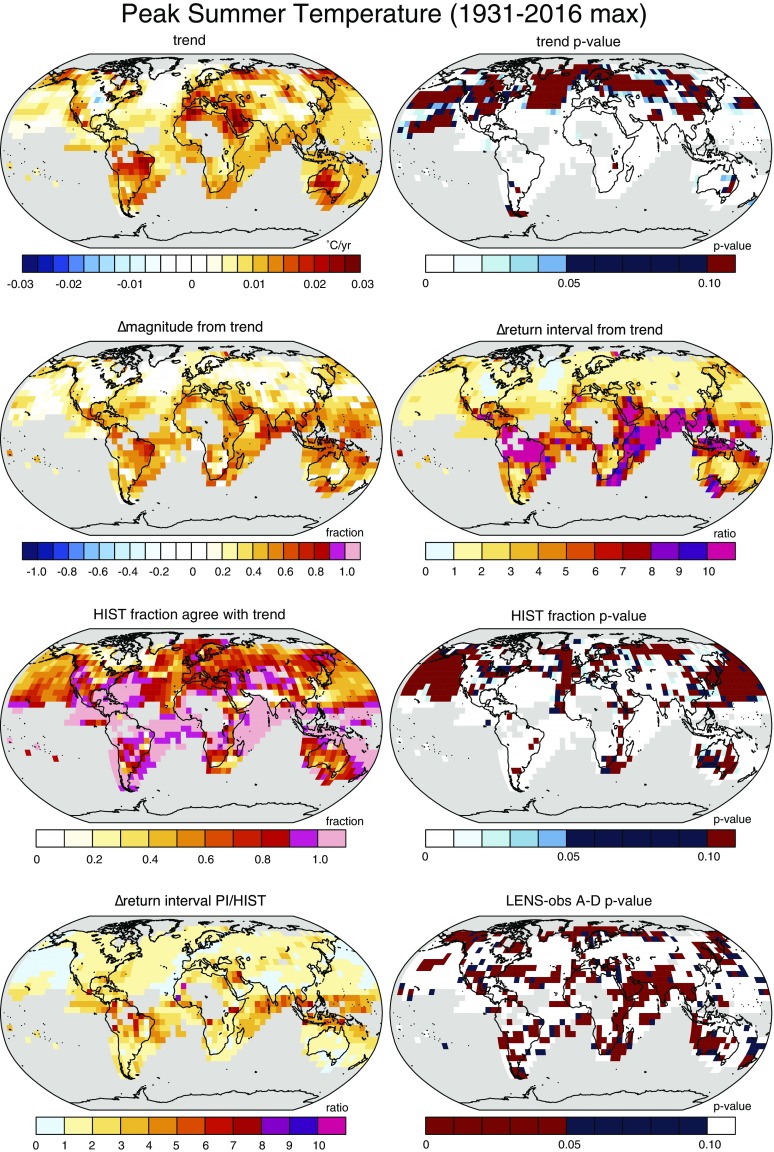
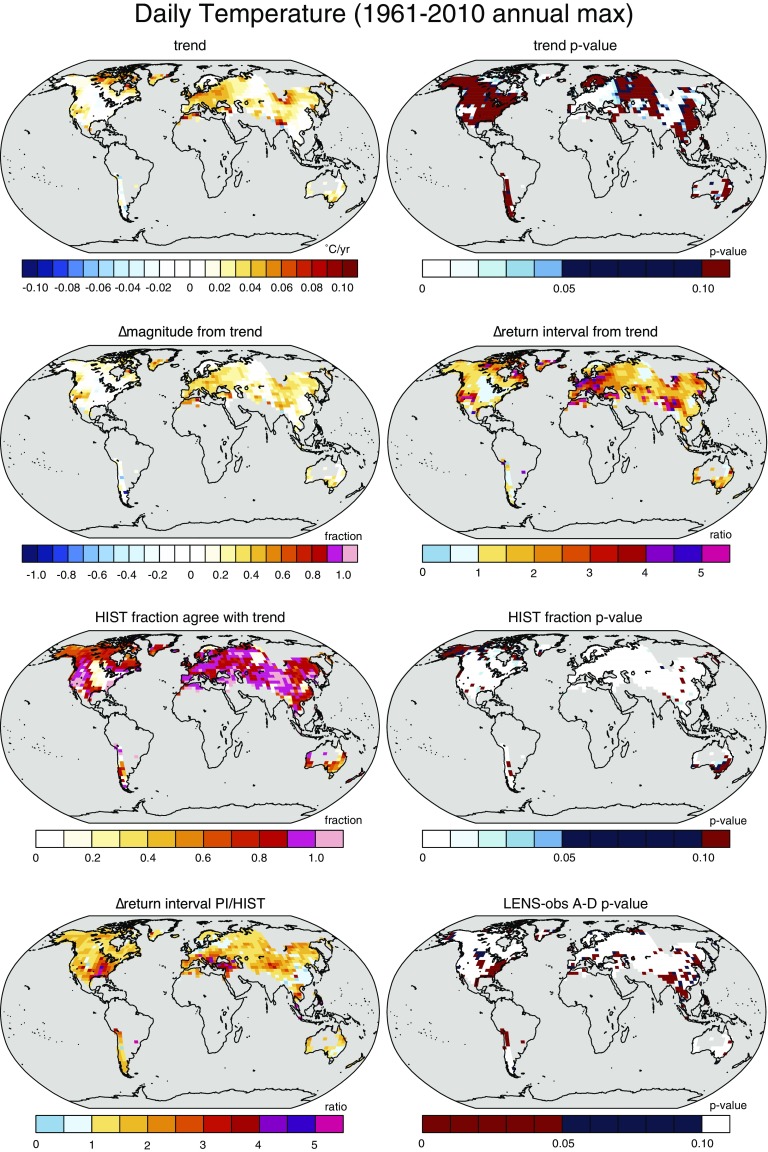
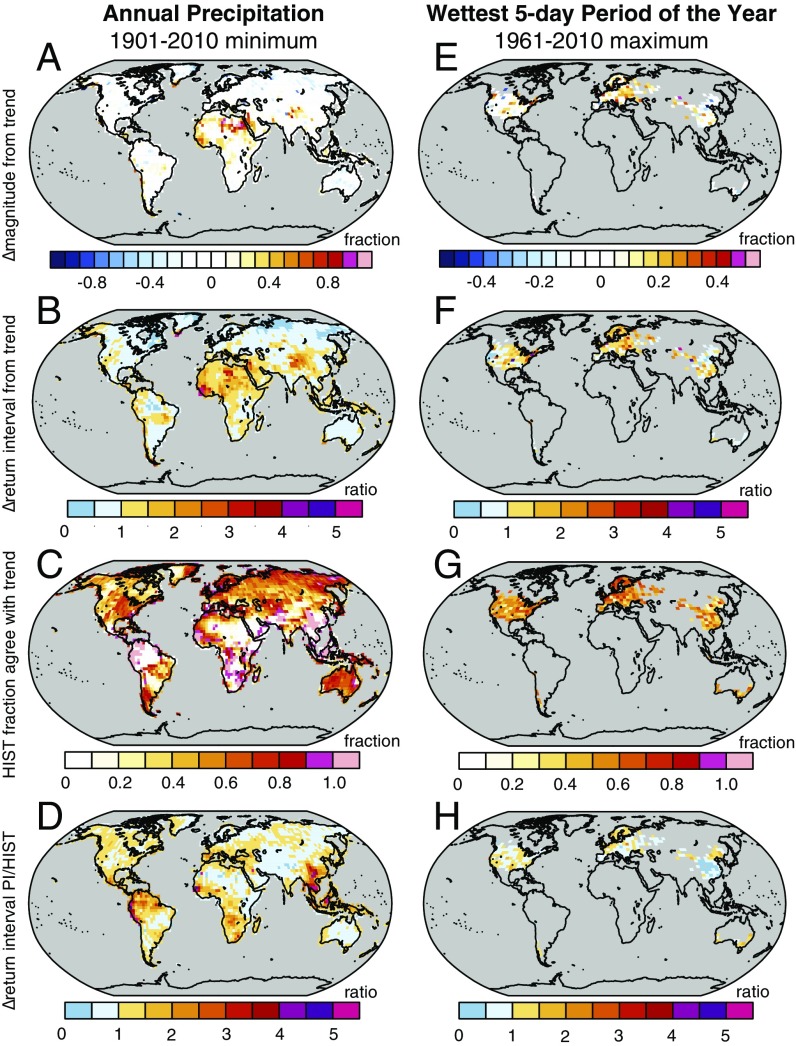
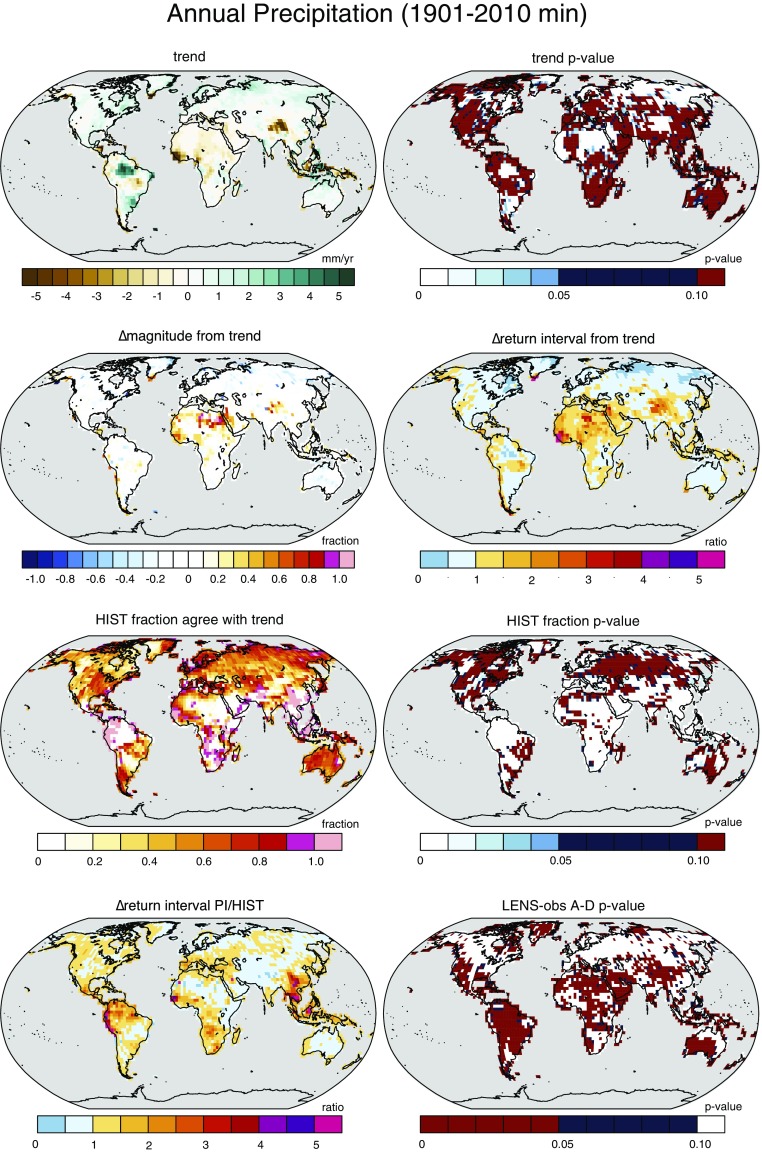
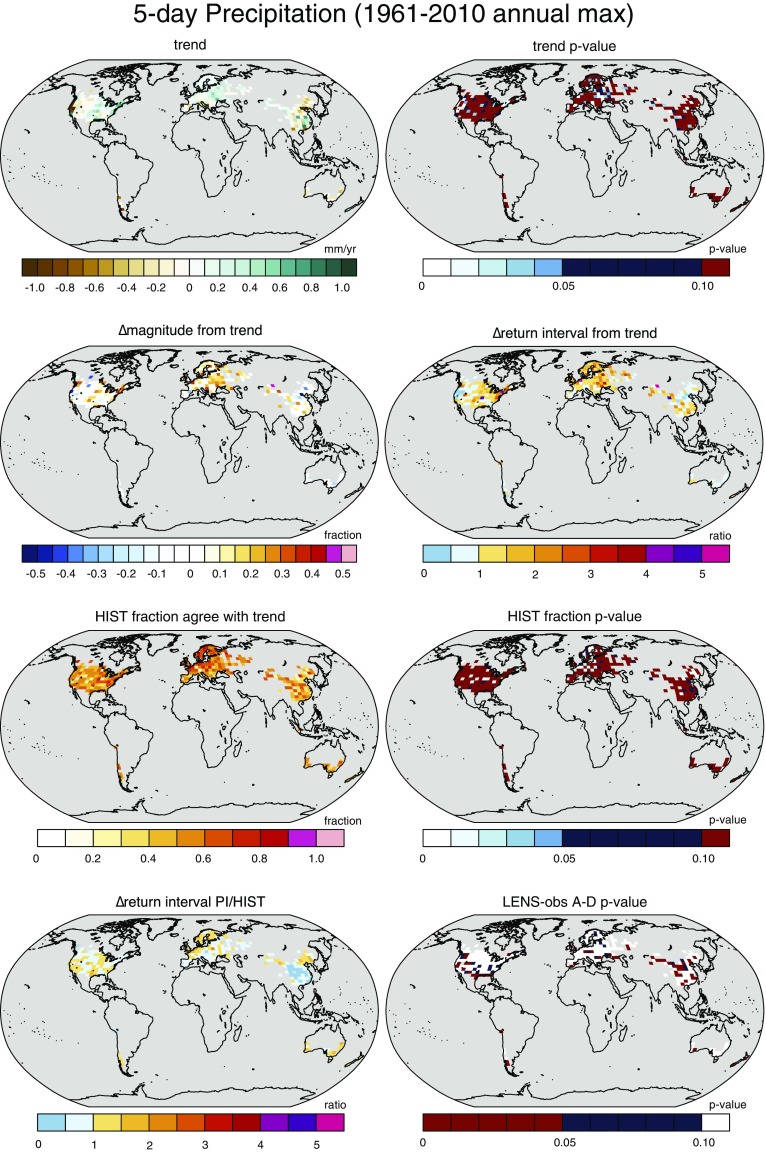
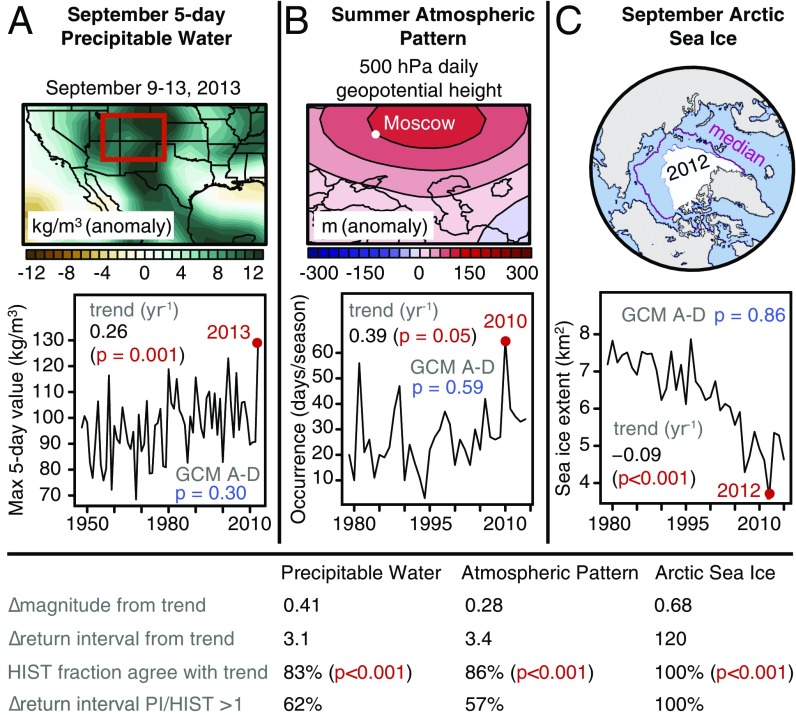
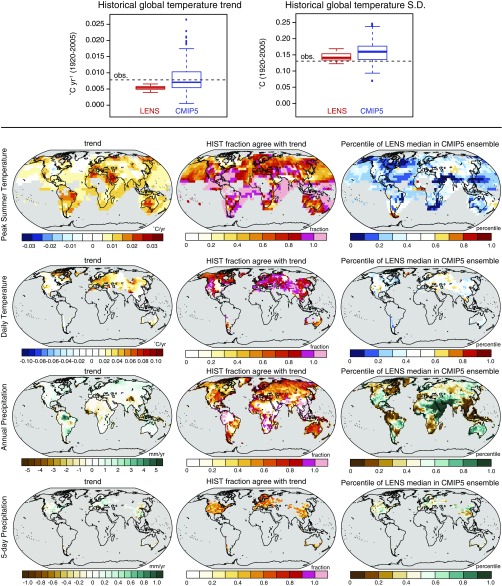
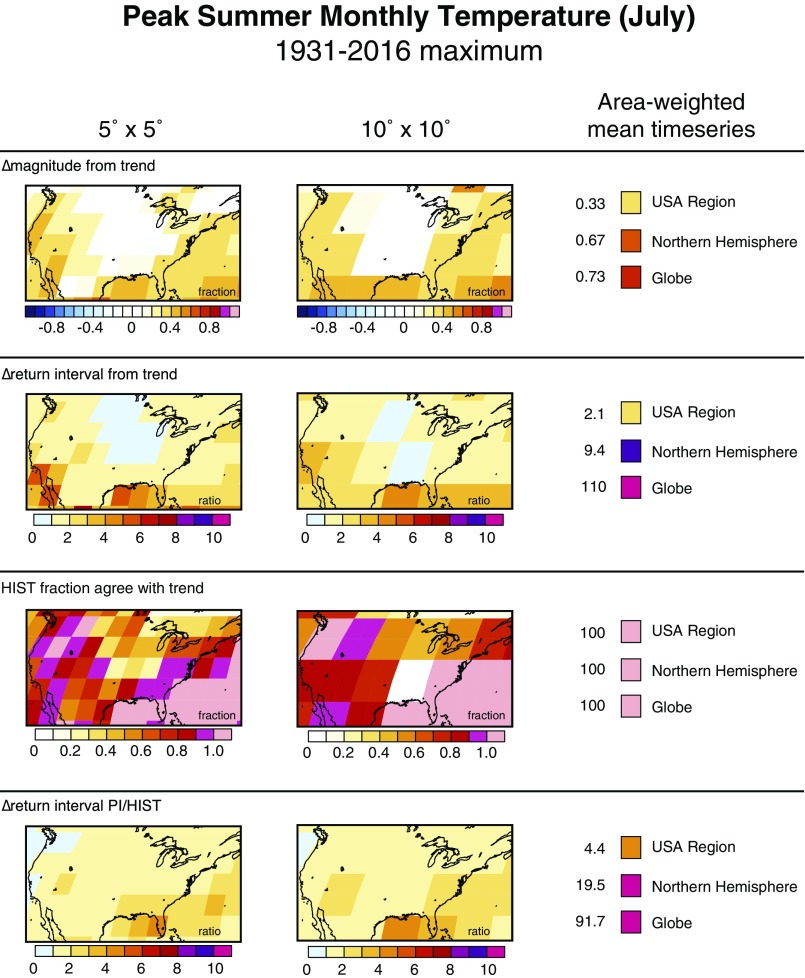
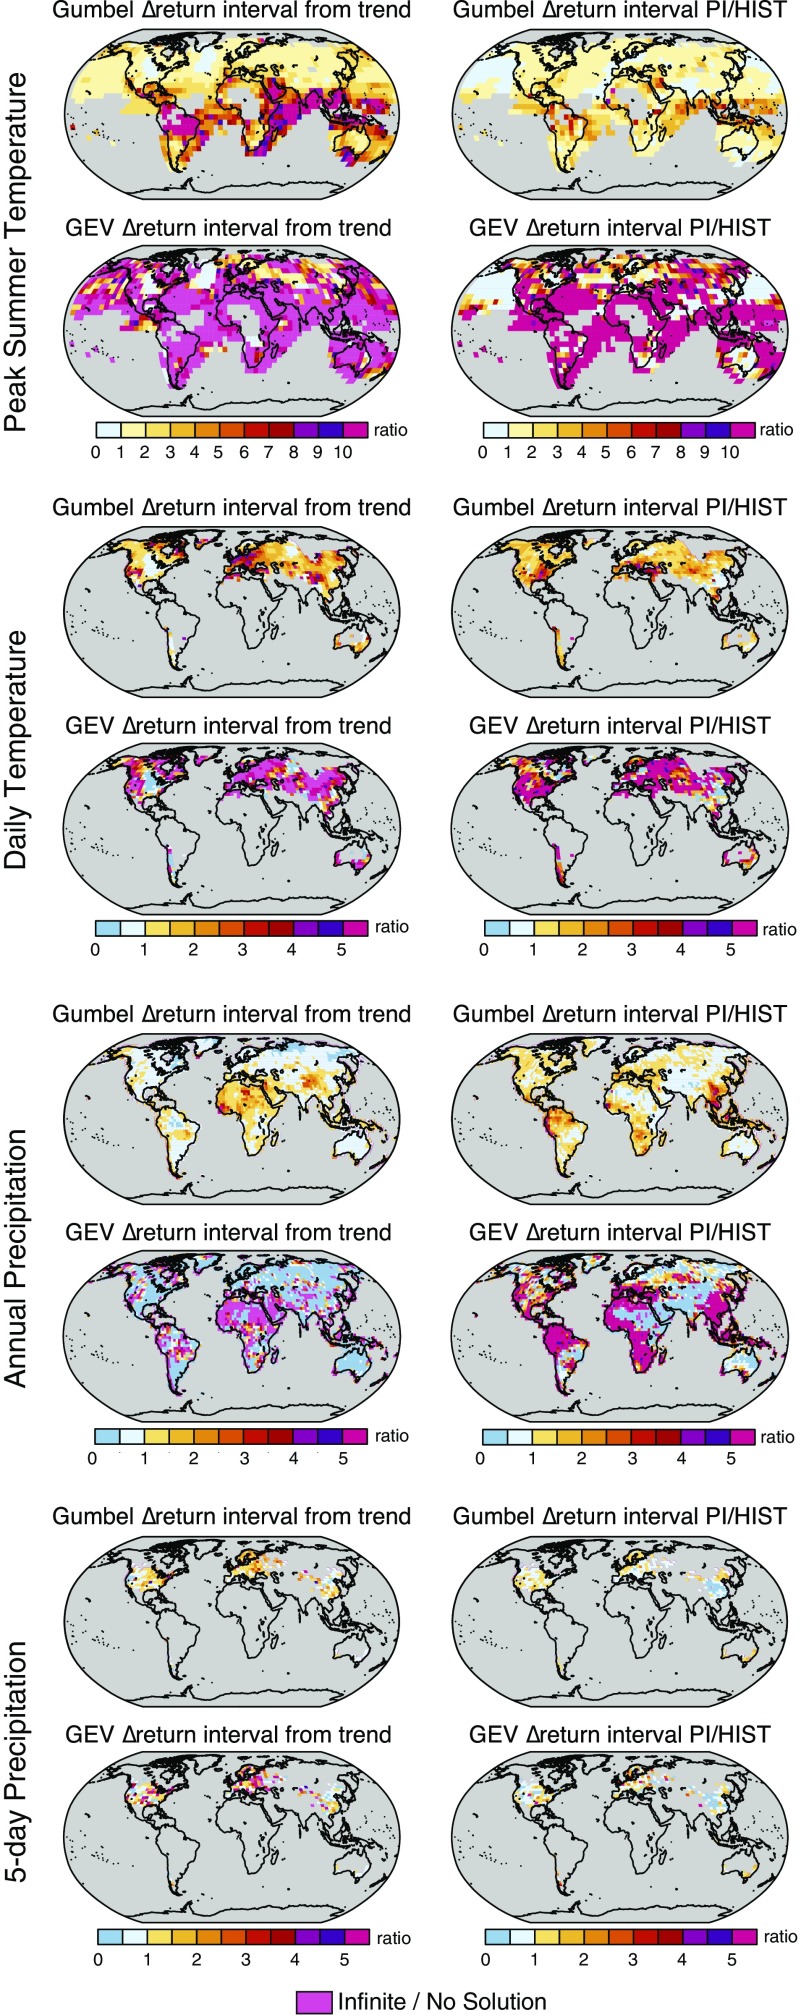
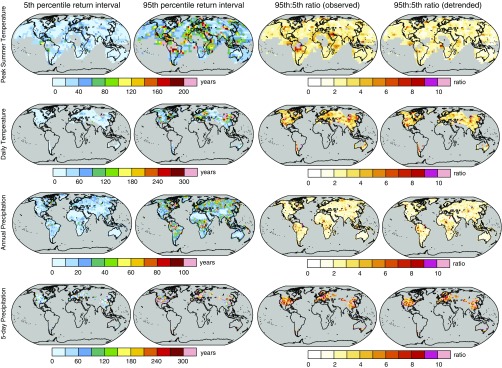
Efforts to understand the influence of historical global warming on individual extreme climate events have increased over the past decade. However, despite substantial progress, events that are unprecedented in the local observational record remain a persistent challenge. Leveraging observations and a large climate model ensemble, we quantify uncertainty in the influence of global warming on the severity and probability of the historically hottest month, hottest day, driest year, and wettest 5-d period for different areas of the globe. We find that historical warming has increased the severity and probability of the hottest month and hottest day of the year at >80% of the available observational area. Our framework also suggests that the historical climate forcing has increased the probability of the driest year and wettest 5-d period at 57% and 41% of the observed area, respectively, although we note important caveats. For the most protracted hot and dry events, the strongest and most widespread contributions of anthropogenic climate forcing occur in the tropics, including increases in probability of at least a factor of 4 for the hottest month and at least a factor of 2 for the driest year. We also demonstrate the ability of our framework to systematically evaluate the role of dynamic and thermodynamic factors such as atmospheric circulation patterns and atmospheric water vapor, and find extremely high statistical confidence that anthropogenic forcing increased the probability of record-low Arctic sea ice extent.

Keywords: climate change; climate extremes; event attribution; global warming.


Conflict of interest statement

The authors declare no conflict of interest.

Figures

Fig. 1.
Fig. 1.
Idealized examples of the primary metrics targeted by our attribution analysis. (A) The contribution of the observed trend to the event magnitude. (B) The uncertainty in the event return interval in the original time series. (C) The uncertainty in the contribution of the observed trend to the event probability. (D) Comparison of the observed interannual variability with the interannual variability simulated by the climate model. (E) The probability of the observed trend in the Historical Climate Model Simulations. (F) The uncertainty in the contribution of the historical forcing to the event probability.
Fig. 2.
Fig. 2.
Attribution metrics on a global grid for (AD) the maximum peak summer monthly temperature and (EH) the maximum hottest day of the year. (A and E) The contribution of the observed trend to the event magnitude. (B and F) The median contribution of the observed trend to the event probability. (C and G) The probability of the observed trend in the Historical Climate Model Simulations. (D and H) The median contribution of the historical forcing to the event probability. HIST, Historical Climate Model Simulations; PI, Pre-Industrial Control Simulation.
Fig. S1.
Fig. S1.
Attribution metrics for the maximum peak summer temperature in the 1931–2016 period. HIST, Historical Climate Model Simulations; PI, Pre-Industrial Control Simulation.
Fig. S2.
Fig. S2.
Attribution metrics for the maximum daily temperature in the 1961–2010 period. HIST, Historical Climate Model Simulations; PI, Pre-Industrial Control Simulation.
Fig. 3.
Fig. 3.
As in Fig. 2, but for (AD) the minimum annual precipitation and (EH) the maximum wettest 5-d period of the year. HIST, Historical Climate Model Simulations; PI, Pre-Industrial Control Simulation.
Fig. S3.
Fig. S3.
Attribution metrics for the minimum annual precipitation in the 1901–2010 period. HIST, Historical Climate Model Simulations; PI, Pre-Industrial Control Simulation.
Fig. S4.
Fig. S4.
Attribution metrics for the maximum 5-d precipitation in the 1961–2010 period. HIST, Historical Climate Model Simulations; PI, Pre-Industrial Control Simulation.
Fig. 4.
Fig. 4.
Analysis of climate variables associated with extreme climate events. (A) September 5-d precipitable water associated with the 2013 Colorado floods. (B) Summer 500-hPa geopotential height pattern associated with the 2010 Russia heatwave. (C) September Arctic sea ice extent. HIST, Historical Climate Model Simulations; PI, Pre-Industrial Control Simulation.
Fig. S5.
Fig. S5.
(Top) Box-and-whisker plots showing comparison of the global temperature trend (Left) and interannual SD (Right) in gridded observations, the LENS single-model ensemble, and the CMIP5 multimodel ensemble. (Bottom) Maps showing location of the LENS median trend value in the CMIP5 ensemble distribution (Right). For temperature variables, red (blue) colors indicate that the median LENS trend falls in the upper (lower) half of the CMIP5 distribution. For precipitation variables, green (brown) colors indicate that the median LENS trend falls in the upper (lower) half of the CMIP5 distribution. The observed trend (Left) and fraction of the LENS Historical realizations whose trend is of the same sign as the observed trend (Center) are reproduced from Figs. S1−S4 for reference. HIST, Historical Climate Model Simulations; S.D., interannual standard deviation.
Fig. S6.
Fig. S6.
Quantification of attribution metrics for maximum July temperature at progressively larger spatial scales, including 5° × 5°, 10° × 10°, national, hemispheric, and global. All calculations are made using the grid points that exhibit continuous data availability over the 1931–2016 period (e.g., Fig. 2A). For each spatial scaling, the weighted area average time series is calculated first, and then the attribution metrics are calculated from the weighted area average time series. HIST, Historical Climate Model Simulations; PI, Pre-Industrial Control Simulation.
Fig. S7.
Fig. S7.
Comparison of the change in probability calculated using the Gumbel variation of the GEV and the change in probability calculated using the generalized application of the GEV. HIST, Historical Climate Model Simulations; PI, Pre-Industrial Control Simulation.
Fig. S8.
Fig. S8.
Uncertainty in the return interval of the record event in the observed time series (first three columns) and the detrended time series (fourth column). Note that the maximum (or minimum, respectively) event is removed from the historical data prior to fitting the parametric distribution.

References

    1. Trenberth KE. Framing the way to relate climate extremes to climate change. Clim Change. 2012;115:283–290.
    1. Trenberth KE, Fasullo JT, Shepherd TG. Attribution of climate extreme events. Nat Clim Change. 2015;5:725–730.
    1. Shepherd TG. A common framework for approaches to extreme event attribution. Curr Clim Change Reports. 2016;2:28–38.
    1. Stott PA, et al. Attribution of extreme weather and climate-related events. Wiley Interdiscip Rev Clim Change. 2016;7:23–41. - PMC - PubMed
    1. National Academies of Sciences, Engineering, and Medicine . Attribution of Extreme Weather Events in the Context of Climate Change. Natl Acad Press; Washington, DC: 2016.

Publication types