. 2017 May 16;114(20):5312-5317.
doi: 10.1073/pnas.1619320114. Epub 2017 Apr 24.

CYCLOPS reveals human transcriptional rhythms in health and disease

Affiliations

CYCLOPS reveals human transcriptional rhythms in health and disease

Ron C Anafi et al. Proc Natl Acad Sci U S A. .

Abstract

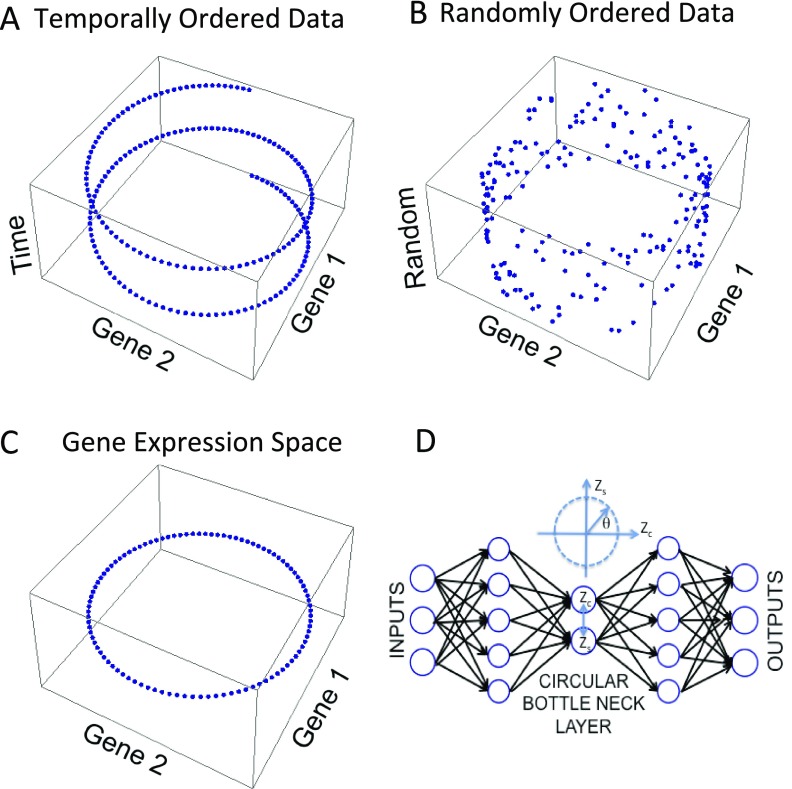
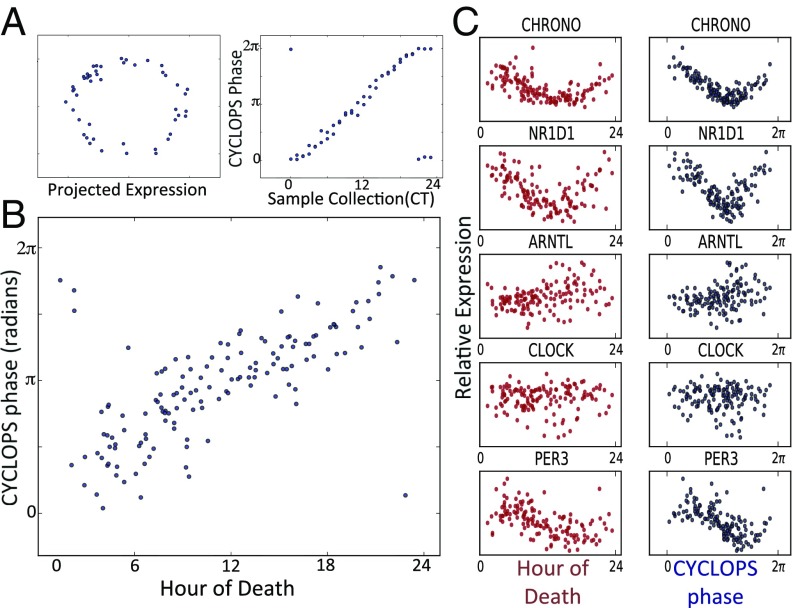
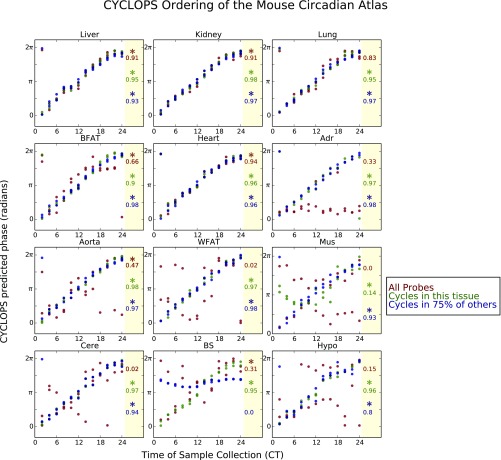
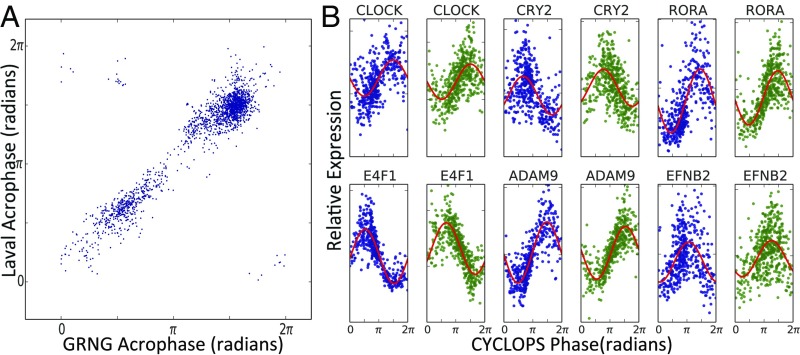
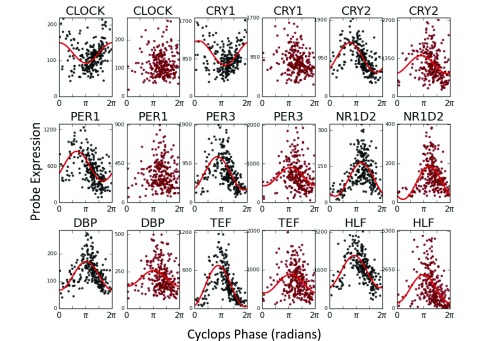
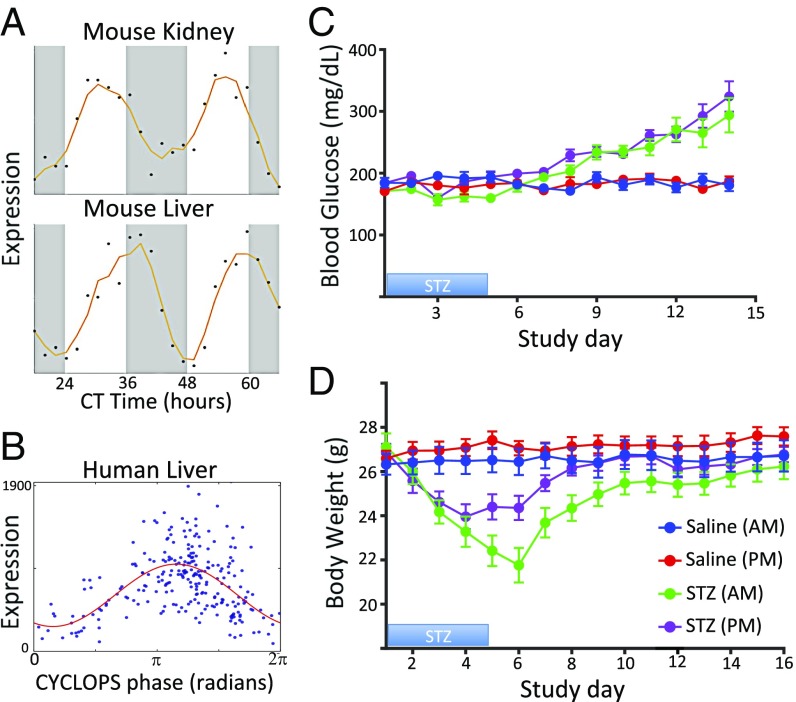
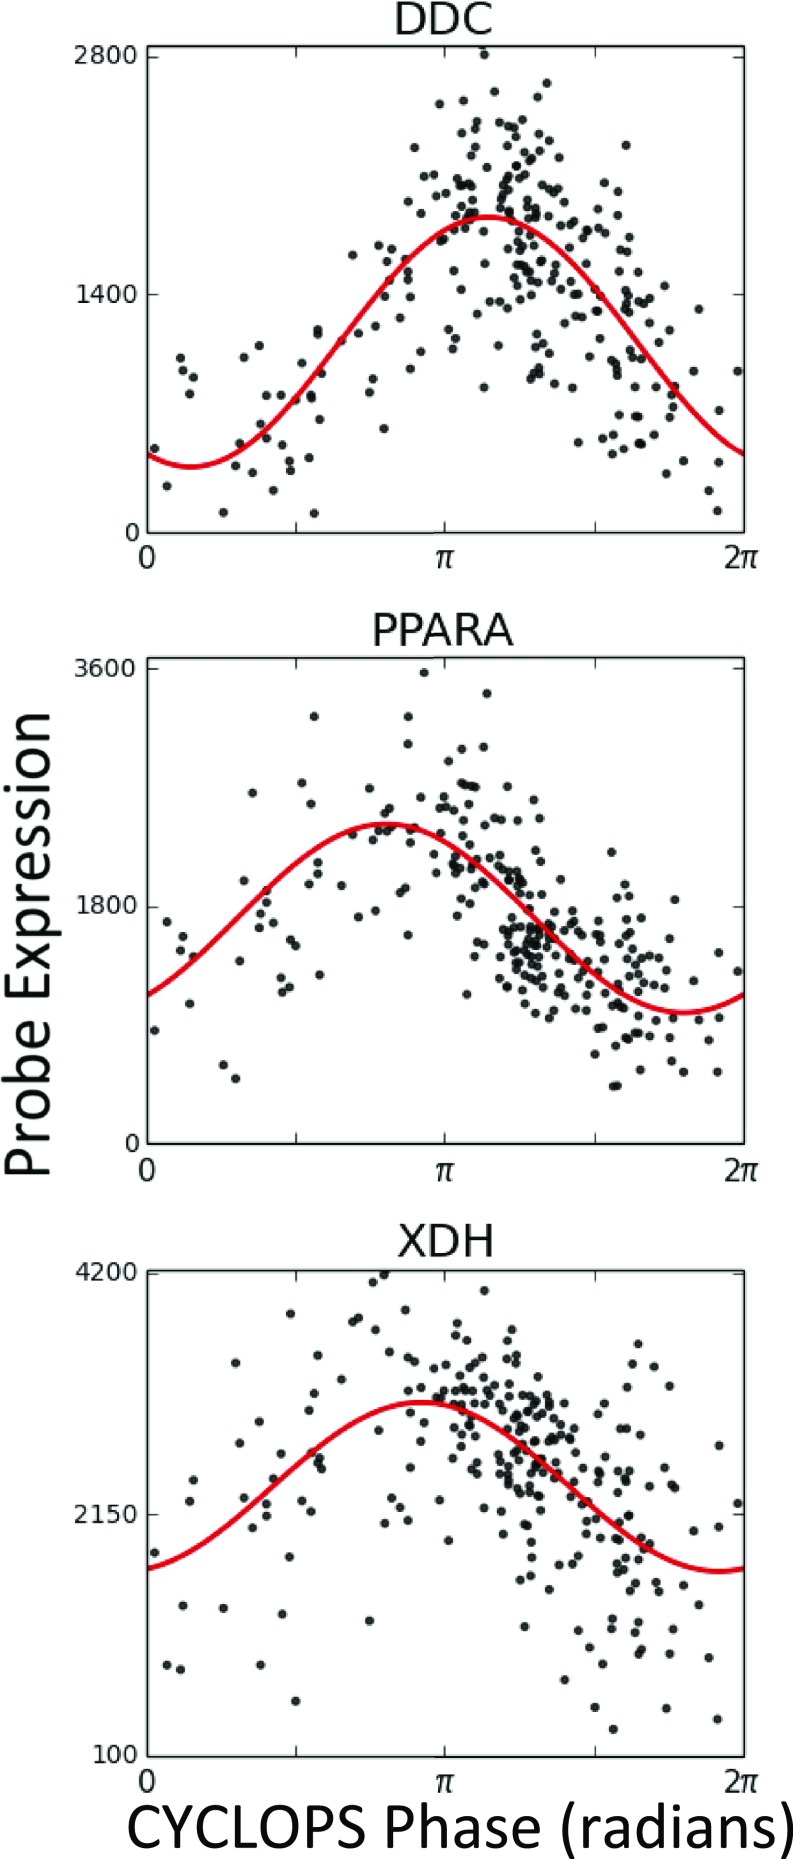
Circadian rhythms modulate many aspects of physiology. Knowledge of the molecular basis of these rhythms has exploded in the last 20 years. However, most of these data are from model organisms, and translation to clinical practice has been limited. Here, we present an approach to identify molecular rhythms in humans from thousands of unordered expression measurements. Our algorithm, cyclic ordering by periodic structure (CYCLOPS), uses evolutionary conservation and machine learning to identify elliptical structure in high-dimensional data. From this structure, CYCLOPS estimates the phase of each sample. We validated CYCLOPS using temporally ordered mouse and human data and demonstrated its consistency on human data from two independent research sites. We used this approach to identify rhythmic transcripts in human liver and lung, including hundreds of drug targets and disease genes. Importantly, for many genes, the circadian variation in expression exceeded variation from genetic and other environmental factors. We also analyzed hepatocellular carcinoma samples and show these solid tumors maintain circadian function but with aberrant output. Finally, to show how this method can catalyze medical translation, we show that dosage time can temporally segregate efficacy from dose-limiting toxicity of streptozocin, a chemotherapeutic drug. In sum, these data show the power of CYCLOPS and temporal reconstruction in bridging basic circadian research and clinical medicine.

Keywords: autoencoder; biological rhythms; circadian rhythms; gene expression; machine learning.


Conflict of interest statement

The authors declare no conflict of interest.

Figures

Fig. S1.
Fig. S1.
Graphical depiction of CYCLOPS. (A) The expression of two, out-of-phase genes periodic with a common frequency are plotted in the X and Y dimensions. Time is depicted in the Z dimension. (B) The same expression data are plotted with temporal information replaced with a random index. (C) The same data are plotted in expression space. The structure forms a circle. (D) CYCLOPS autoencoder: The neural network is trained so that its output reproduces its input with minimal error. Linear neurons project the data onto the circular bottleneck layer. The circular bottleneck layer is composed of two coupled neurons constrained to encode the data on a closed elliptical curve. Data from each sample are represented by a single angular phase representing the sample’s position on the ellipse.
Fig. 1.
Fig. 1.
Validation of CYCLOPS. Time course expression data from the mouse liver (18) were encoded with CYCLOPS. (A, Left) The linear encoding is visualized as a projection onto a plane where the data approximates an ellipse. (A, Right) Sample collection phase is plotted along the horizontal axis, whereas the CYCLOPS-estimated phase is plotted on the vertical axis. (B) Expression data from 146 human prefrontal cortex samples (10) encoded with CYCLOPS. The hour of death for each sample is plotted on the horizontal axis. The CYCLOPS-derived phases are plotted on the vertical axis. Time 0 is the same as 24 and phase 0 is the same as 2π; samples plotted near the corners of the graph are actually “near” the diagonal line of identity. (C) Expression of select transcripts is plotted as a function of both TOD (red) and CYCLOPS phase (blue).
Fig. S2.
Fig. S2.
Application of CYCLOPS to the Mouse Circadian Atlas. Time course expression data (1) from each of 12 mouse tissues (samples obtained every 2 h for 2 d) were encoded with the CYCLOPS neural network. The CYCLOPS-determined phases for each sample are plotted as a function of the true sample collection time. Temporal reconstruction was based on or “seeded with” (A) all well-expressed probes within coefficient of variation between 0.07 and 0.14 (shown in red); (B) the list of probes that were found to cycle in that tissue (shown in green); or (C) the list of probes that were found to cycle in 75% of the other tissues (shown in blue). Because time 0 is the same as 24 and phase 0 is the same as 2π, samples plotted near the corners of the graph are actually “near” the diagonal line of identity. To the Right of each graph, stars denote orderings that had a smoothness metric, Metsmooth<1 and a significant (P < 0.05) error statistic, Staterr. The circular correlation between each CYCLOPS ordering and the true time of data collection are also shown. Adr, adrenals; BFAT, brown fat; BS, brain stem; Cere, cerebellum; Hypo, hypothalamus; Mus, skeletal muscle; WFAT, white fat.
Fig. 2.
Fig. 2.
CYCLOPS analysis of circadian transcriptome in human lung. Using independent biopsy data sets (21) from the University of Groningen (GRNG) (Groningen, The Netherlands) and the University of Laval (Quebec City, QC, Canada), we used CYCLOPS to generate two reconstructions of the circadian transcriptome in the human lung. Modified cosinor regression was then used to identify cycling transcripts. (A) Results from the transcripts found to cycle in both datasets are shown. For each transcript, the acrophase in the Laval dataset is plotted against the transcript acrophase as determined from the Groningen data. (B) CYCLOPS-ordered expression data from Groningen and Quebec City are plotted in blue and green, respectively.
Fig. S3.
Fig. S3.
Expression of selected clock-controlled transcriptional outputs in human lung as determined by CYCLOPS. Using independent biopsy datasets (21) from the University of Groningen (Groningen, The Netherlands) and the University of Laval (Quebec City, QC, Canada), we used CYCLOPS to generate two reconstructions of the circadian transcriptome in the human lung. Expression data from human homologs of genes found to be cycling in mouse lung (1) were used in the ordering. Expression data for the labeled transcripts are plotted as a function of CYCLOPS phase. CYCLOPS-ordered expression data from Groningen are plotted in blue. CYCLOPS-ordered expression data from Quebec City are plotted in green.
Fig. S4.
Fig. S4.
Phase synchronized pathways and gene sets in human lung as determined by CYCLOPS: phase set enrichment analysis (30) was applied to the CYCLOPS-ordered human pulmonary transcriptome. Gene sets showing phase-clustered expression are shown. Sets further from the center of the circle display more unimodal phase clustering/synchronization. Gene sets and pathways that were also found to have phase clustered expression in the mouse lung (30) are highlighted in orange.
Fig. S5.
Fig. S5.
Distribution of lung biopsy sample collection times: Histogram showing the number of samples assigned to different CYCLOPS phases. As expected, most samples were collected in one of the four phase bins likely corresponding to the working day when the biopsies were collected.
Fig. 3.
Fig. 3.
CYCLOPS analysis of noncancerous (NC) and cancerous (HCC) human liver. Expression data from biopsy-derived NC tissue was processed using CYCLOPS. (A) Reconstructed expression profiles of selected clock genes are plotted as a function of CYCLOPS phase. Expression data from samples with HCC were projected onto the eigenvectors established in the NC samples before CYCLOPS ordering. (B) Histogram of circadian amplitude differences between NC and HCC samples. A long tail, highlighted in yellow, shows transcripts with reduced amplitude in HCC. (C) A scatter plot compares the statistical significance of testing for a change in mean expression (Mann–Whitney test) with the statistical significance of testing for a circadian expression change. (D) Expression of selected genes as a function of CYCLOPS phase in both NC (black) and HCC (red) samples.
Fig. S6.
Fig. S6.
Expression of selected core-clock genes in noncancerous (NC) and cancerous human liver as determined by CYCLOPS. As described in the main text, expression data from tissue obtained at biopsy was processed using CYCLOPS to reconstruct the circadian transcriptome in NC human liver samples and matched histologic samples with hepatocellular carcinoma (HCC). Reconstructed temporal expression profiles of selected “core” clock genes are plotted as a function of CYCLOPS phase. Expression of various clock genes is plotted as a function of CYCLOPS phase in both NC (black) and HCC (red) samples.
Fig. 4.
Fig. 4.
Prospective chronotherapy for streptozocin (STZ). STZ is a cytotoxic agent used to treat pancreatic neuroendocrine tumors. STZ is actively transported into cells by the protein product of SLC2A2 and is associated with renal and hepatic toxicity. (A) The expression of Slc2a2 in mouse kidney and liver (1) is plotted as a function of circadian time. (B) Expression of SLC2A2 in human liver samples is plotted as a function of CYCLOPS phase. (C) Eleven-week-old male mice were dosed with STZ (green and purple) or saline (blue and red) at 7:00 AM (blue and green) or 7:00 PM (red and purple). Dosing time did not significantly impact the induction of hyperglycemia and expected treatment efficacy. (D) Body weight was used as a measure of gross toxicity. There was less weight loss among mice administered STZ at 7:00 PM.
Fig. S7.
Fig. S7.
Expression of selected clock-controlled drug targets in noncancerous liver as determined by CYCLOPS. Expression data from tissue obtained at biopsy was processed using CYCLOPS to reconstruct the circadian transcriptome in noncancerous (NC) human liver samples. Expression of selected drug targets is plotted as a function of CYCLOPS phase.

Comment in

  • Compass in the data ocean: Toward chronotherapy.
    Yamada RG, Ueda HR. Yamada RG, et al. Proc Natl Acad Sci U S A. 2017 May 16;114(20):5069-5071. doi: 10.1073/pnas.1705326114. Epub 2017 May 9. Proc Natl Acad Sci U S A. 2017. PMID: 28487482 Free PMC article. No abstract available.
  • An "eye" for rhythm.
    Haspel J. Haspel J. Sci Transl Med. 2017 May 17;9(390):eaan4288. doi: 10.1126/scitranslmed.aan4288. Sci Transl Med. 2017. PMID: 28515338

References

    1. Zhang R, Lahens NF, Ballance HI, Hughes ME, Hogenesch JB. A circadian gene expression atlas in mammals: Implications for biology and medicine. Proc Natl Acad Sci USA. 2014;111:16219–16224. - PMC - PubMed
    1. Hetzel MR, Clark TJ. Comparison of normal and asthmatic circadian rhythms in peak expiratory flow rate. Thorax. 1980;35:732–738. - PMC - PubMed
    1. Straub RH, Cutolo M. Circadian rhythms in rheumatoid arthritis: Implications for pathophysiology and therapeutic management. Arthritis Rheum. 2007;56:399–408. - PubMed
    1. Ferrell JM, Chiang JYL. Circadian rhythms in liver metabolism and disease. Acta Pharm Sin B. 2015;5:113–122. - PMC - PubMed
    1. Ueda HR, et al. Molecular-timetable methods for detection of body time and rhythm disorders from single-time-point genome-wide expression profiles. Proc Natl Acad Sci USA. 2004;101:11227–11232. - PMC - PubMed

Publication types

LinkOut - more resources