. 2017 May 9;114(19):E3806-E3815.
doi: 10.1073/pnas.1619416114. Epub 2017 Apr 24.

Biliary epithelial injury-induced regenerative response by IL-33 promotes cholangiocarcinogenesis from peribiliary glands

Affiliations

Biliary epithelial injury-induced regenerative response by IL-33 promotes cholangiocarcinogenesis from peribiliary glands

Hayato Nakagawa et al. Proc Natl Acad Sci U S A. .

Abstract

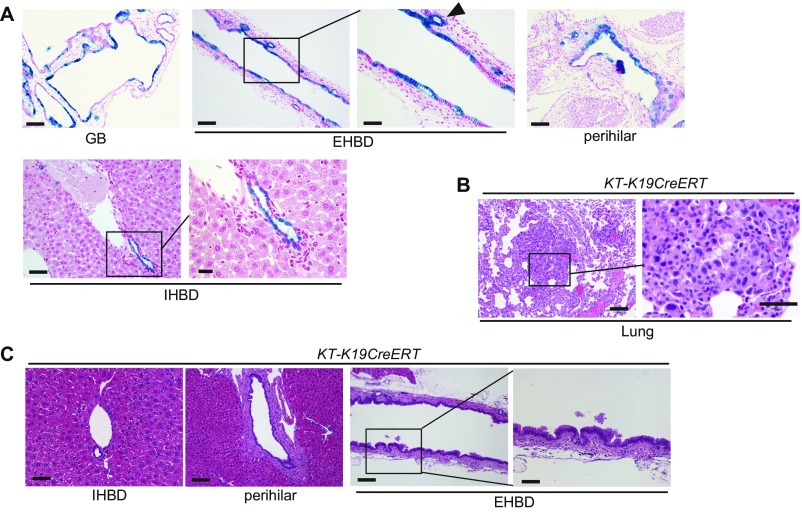
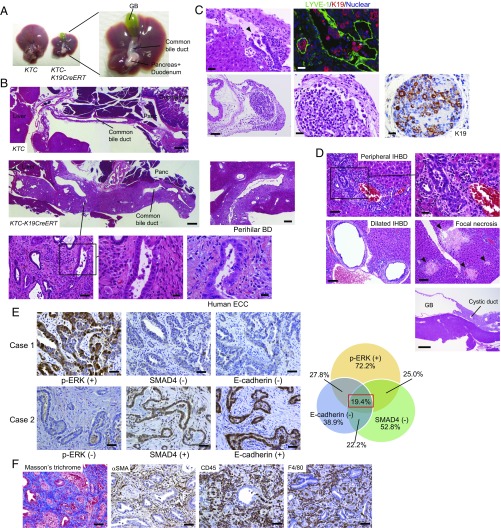
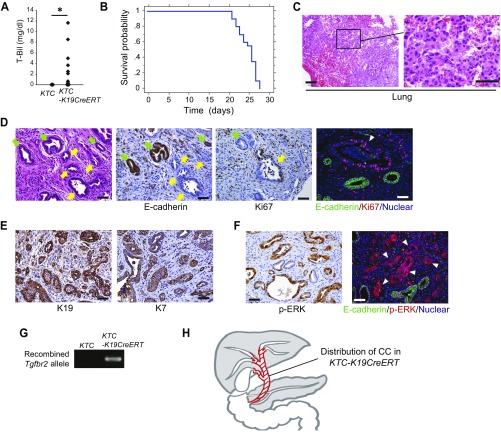
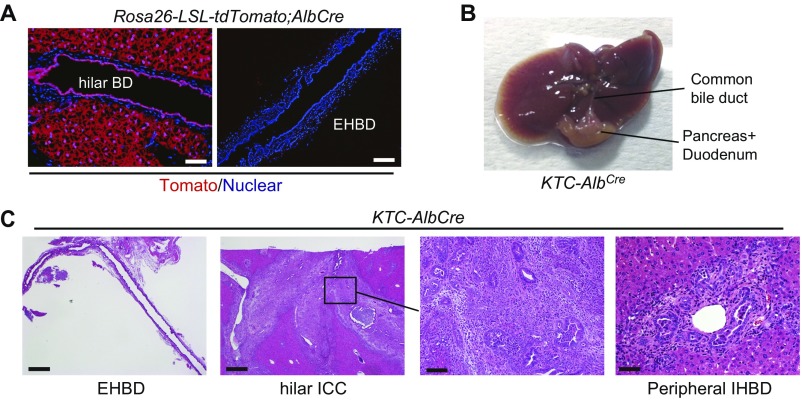
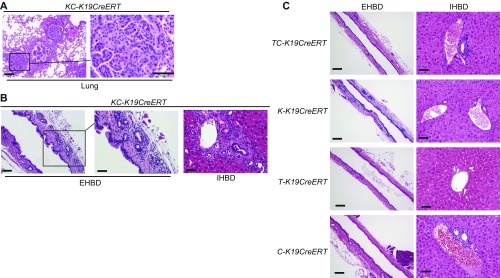
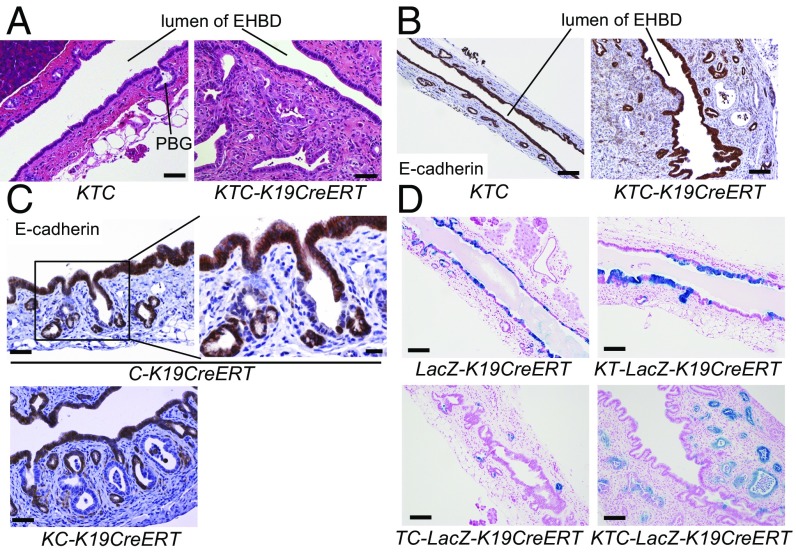
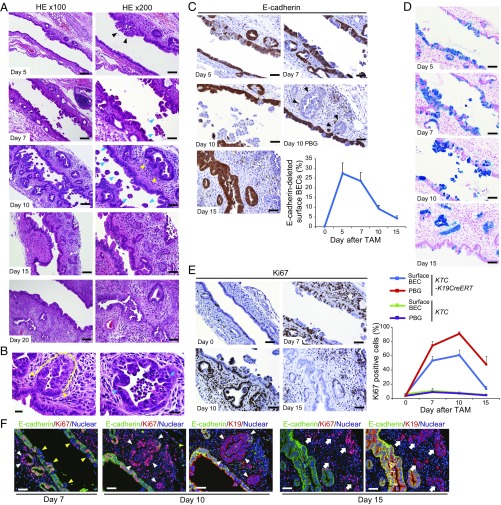
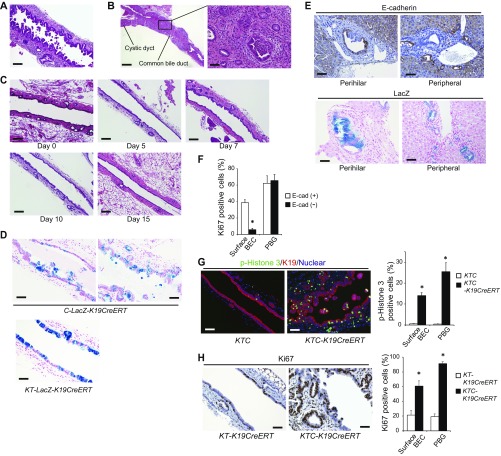
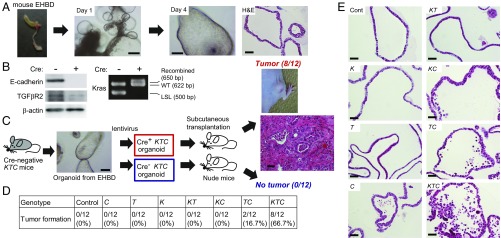
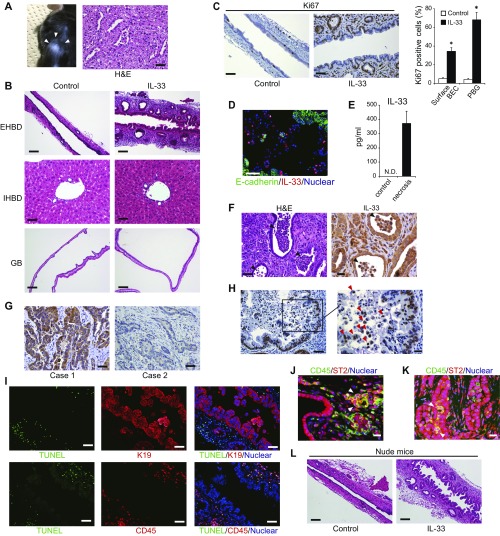
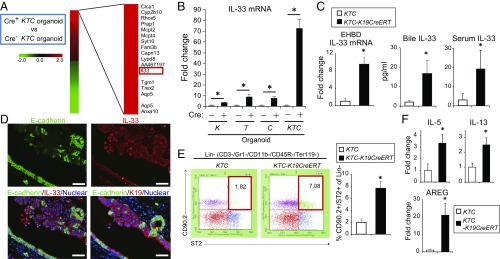
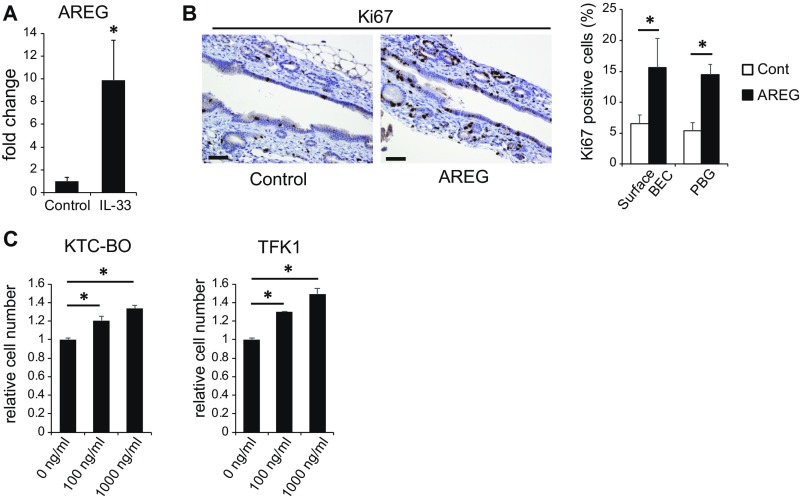
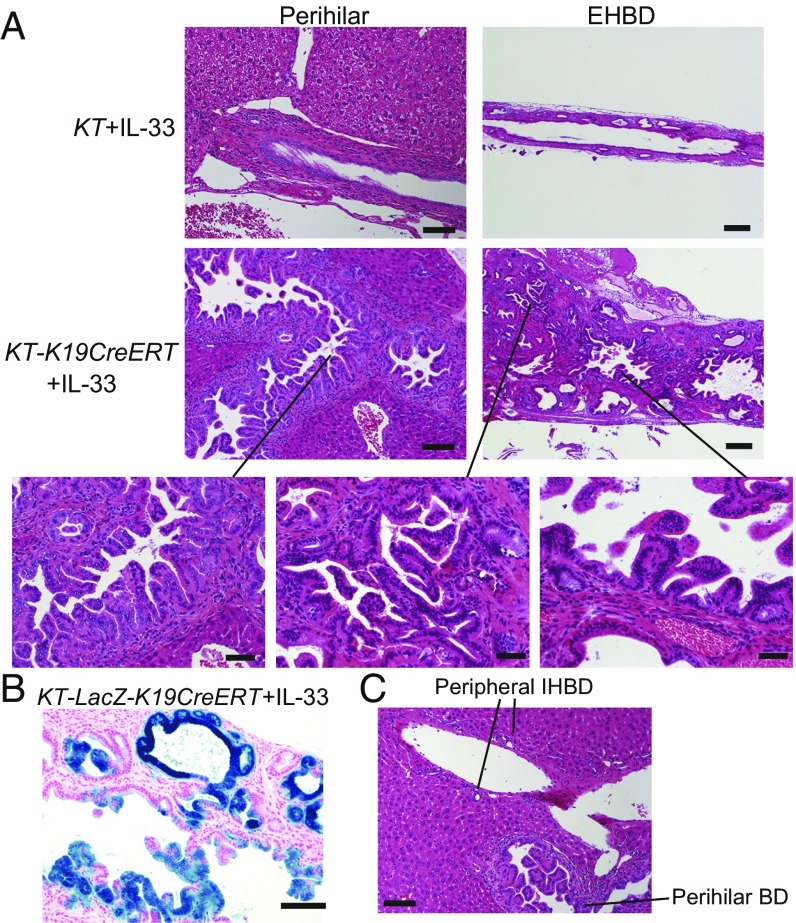
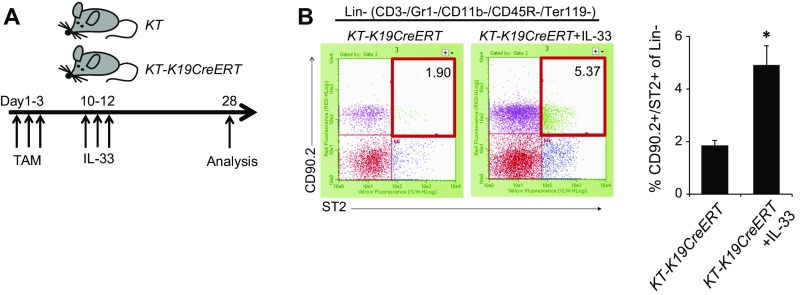
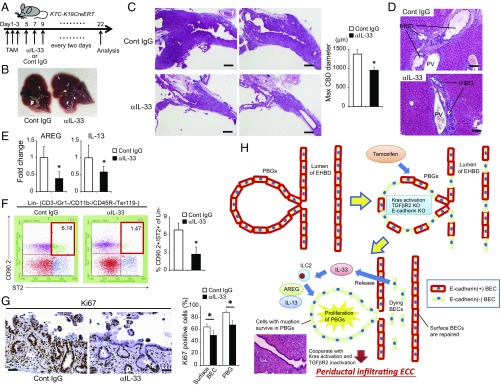
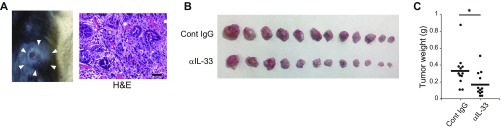
The carcinogenic mechanism of extrahepatic cholangiocarcinoma (ECC) is unclear, due at least in part to the lack of an appropriate mouse model. Because human studies have reported frequent genetic alterations in the Ras- and TGFβ/SMAD-signaling pathways in ECC, mice with tamoxifen-inducible, duct-cell-specific Kras activation and a TGFβ receptor type 2 (TGFβR2) deletion were first generated by crossing LSL-KrasG12D , Tgfbr2flox/flox , and K19CreERT mice (KT-K19CreERT ). However, KT-K19CreERT mice showed only mild hyperplasia of biliary epithelial cells (BECs) in the extrahepatic bile duct (EHBD) and died within 7 wk, probably a result of lung adenocarcinomas. Next, to analyze the additional effect of E-cadherin loss, KT-K19CreERT mice were crossed with CDH1flox/flox mice (KTC-K19CreERT ). Surprisingly, KTC-K19CreERT mice exhibited a markedly thickened EHBD wall accompanied by a swollen gallbladder within 4 wk after tamoxifen administration. Histologically, invasive periductal infiltrating-type ECC with lymphatic metastasis was observed. Time-course analysis of EHBD revealed that recombined BECs lining the bile duct lumen detached due to E-cadherin loss, whereas recombined cells could survive in the peribiliary glands (PBGs), which are considered a BEC stem-cell niche. Detached dying BECs released high levels of IL-33, as determined by microarray analysis using biliary organoids, and stimulated inflammation and a regenerative response by PBGs, leading eventually to ECC development. Cell lineage tracing suggested PBGs as the cellular origin of ECC. IL-33 cooperated with Kras and TGFβR2 mutations in the development of ECC, and anti-IL-33 treatment suppressed ECC development significantly. Thus, this mouse model provided insight into the carcinogenic mechanisms, cellular origin, and potential therapeutic targets of ECC.

Keywords: IL-33; ILC2; amphiregulin; extrahepatic cholangiocarcinoma; organoid.


Conflict of interest statement

The authors declare no conflict of interest.

Figures

Fig. S1.
Fig. S1.
Mice with duct-cell–specific Kras activation and TGFβR2 inactivation do not develop CC. (A) LacZ-stained images of the liver and biliary tree of LacZ-K19CreERT mice on day 7 after TAM administration. (Scale bar: GB, 100 μm; EHBD Left panel, 100 μm; EHBD Right panel, 50 μm; perihilar, 100 μm; IHBD Left panel, 50 μm; IHBD Right panel, 20 μm.) The arrowhead indicates a PBG. (B) H&E-stained images of the lung from KT-K19CreERT mice 6.5 wk after TAM administration. (Scale bar: Left panel, 100 μm; Right panel, 50 μm.) (C) H&E-stained images of the IHBD, perihilar BD, and EHBD of KT-K19CreERT mice at 6.5 wk after TAM administration. (Scale bar: IHBD and high-magnification view of the EHBD, 50 μm; perihilar and low-magnification view of the EHBD, 100 μm.)
Fig. 1.
Fig. 1.
Loss of E-cadherin in combination with mutation of Kras and TGFβR2 results in the development of ECC. (A) Representative images of the liver and bile duct of KTC and KTC-K19CreERT mice at 3.5 wk after TAM administration. (B) H&E-stained images of sagittal sections of the EHBD of KTC and KTC-K19CreERT mice. (Scale bar: low magnification, 500 μm; middle magnification, 100 μm; high magnification, 20 μm.) H&E-stained images of sagittal sections of the perihilar BD of KTC-K19CreERT mice. (Scale bar: 200 μm.) H&E-stained image of human ECC is also shown. (Scale bar: 20 μm.) (C) Upper panels show invasion by poorly differentiated cancer cells of the lymphatic vessels (Left: H&E-staining; Right: double IF staining of LYVE-1 and K19). (Scale bar: 20 μm.) Lower panels show H&E and IHC images of K19 in regional lymph node metastasis. (Scale bar: Left panel, 100 μm; two Right panels, 20 μm.) Arrowhead indicates lymphatic invasion by cancer cells. (D) H&E-stained images of the peripheral IHBD (scale bar: Left panel, 50 μm; Right panel, 20 μm), dilated IHBD, focal necrosis of the liver parenchyma (Scale bar: 100 μm), and the GB and cystic duct (Scale bar: 500 μm) of KTC-K19CreERT mice. (E) IHC analyses of expression of phospho-ERK, SMAD4, and E-cadherin using 36 surgically resected human ECC samples. Representative images of two patients are shown. (Scale bar: 50 μm.) Case 1 exhibits an expression pattern similar to the mouse model. Venn diagram shows the overlap among indicated categories. (F) ECC microenvironment in KTC-K19CreERT mice. (Left) Masson’s trichrome staining. The other panels show IHC analyses of the indicated proteins. (Scale bar: 50 μm.)
Fig. S2.
Fig. S2.
Characterization of ECC developed in KTC-K19CreERT mice. (A) Serum levels of total bilirubin in KTC mice at 3.5 wk after TAM administration and in KTC-K19CreERT mice euthanized because of severe sickness (KTC, n = 10; KTC-K19CreERT, n = 20). *P < 0.05. (B) Survival curve of KTC-K19CreERT mice after TAM administration (n = 20). (C) H&E-stained images of the lung from KTC-K19CreERT mice 3.5 wk after TAM administration. (Scale bar: Left panel, 100 μm; Right panel, 50 μm.) (D) The left three panels show H&E staining and IHC staining of E-cadherin and Ki67 expression in serial sections of ECC tissue from KTC-K19CreERT mice. (Scale bar: 50 μm.) Yellow arrows indicate cancer glands, and green arrows indicate normal PBGs. The Right panel shows double IF staining of E-cadherin and Ki67. (Scale bar: 50 μm.) Arrowhead indicates an E-cadherin–negative/Ki67-positive cancer gland. (E) IHC of K19 and K7 in ECC tissue from KTC-K19CreERT mice. (Scale bar: 50 μm.) (F) IHC of phospho-ERK and double IF staining of E-cadherin and phospho-ERK in ECC tissue from KTC-K19CreERT mice. (Scale bar: 50 μm.) (G) PCR detection of floxed Tgfbr2 allele recombination in the ECC tissue of KTC-K19CreERT mice, but not EHBD in Cre-negative control mice. (H) The figure shows the distribution of CC in KTC-K19CreERT mice (red area).
Fig. S3.
Fig. S3.
KTC-AlbCre mice develop hilar CC but not ECC. (A) Cre expression in AlbCre mice was confirmed by crossing AlbCre mice with LSL-Rosa26-tdTomato reporter mice. (Scale bar: Left panels, 50 μm; Right panels, 100 μm.) (B) Representative macroscopic images of the liver and bile duct of 8-wk-old KTC-AlbCre mice. (C) H&E-stained images of the EHBD, hilar BD, and peripheral IHBD of KTC-AlbCre mice. (Scale bar: Left panels, 500 μm; higher magnification of hilar ICC, 100 μm; peripheral IHBD, 50 μm.)
Fig. S4.
Fig. S4.
Histology of the biliary tree of KC-K19CreERT mice. H&E-stained images of the lung (A) and of the EHBD and IHBD (B) of KC-K19CreERT mice at 15 wk after TAM administration. (Scale bar in A: Left panel, 100 μm; Right panel, 50 μm; in B: Left panel, 100 μm; Middle and Right panels, 50 μm.) (C) H&E-stained images of the EHBD and IHBD of TC-K19CreERT mice (5 mo after TAM administration), K-K19CreERT mice, T-K19CreERT mice, and C-K19CreERT mice (6 mo after TAM administration). (Scale bar: EHBD, 100 μm; IHBD, 50 μm.)
Fig. 2.
Fig. 2.
E-cadherin–deleted biliary cells are lost from the luminal surface of the EHBD but remain in PBGs. H&E staining (A) and IHC of E-cadherin (B) in the EHBD in KTC and KTC-K19CreERT mice at 3.5 wk after TAM administration. (Scale bar: A, 50 μm; B, 100 μm.) (C) IHC analysis of E-cadherin in the EHBD of C-K19CreERT and KC-K19CreERT mice at 3.5 wk after TAM administration. (Scale bar: Left panels, 50 μm; Right panel, 20 μm.) (D) LacZ-stained image of the EHBD from the indicated mice at 3.5 wk after TAM administration. (Scale bar: 100 μm.)
Fig. 3.
Fig. 3.
Histological progression of ECC. (A) H&E-stained images of the EHBD (middle to upper area of CBD) of KTC-K19CreERT mice after TAM administration at the indicated time points. (Scale bar: Left panels, 100 μm; Right panels, 50 μm.) Black arrowheads, disrupted epithelial alignment; blue arrowheads, BECs detaching from the bile duct epithelium; yellow arrowheads, enlarged and dysplastic PBGs. (B) High-magnification images of PBGs in KTC-K19CreERT mice on day 10. (Scale bar: 20 μm.) Yellow dashed line represents dysplastic cells in the PBGs, and yellow arrowheads indicate the border between the dysplastic PBG cells and normal surface BECs. Blue arrowheads indicate mitotic cells. (C) Time course of E-cadherin expression in the EHBD of KTC-K19CreERT mice after TAM administration. (Scale bar: 50 μm.) Black arrowheads indicate E-cadherin–negative PBGs. Line graph shows percentage of E-cadherin–deleted BECs on the luminal surface of the EHBD of KTC-K19CreERT mice after TAM administration (means ± SD, n = 3 per time point). (D) LacZ-stained images of the EHBD of KTC-LacZ-K19CreERT mice at various time points after TAM administration. (Scale bar: 50 μm.) (E) Ki67 expression in the EHBD of KTC-K19CreERT mice at various time points after TAM administration. (Scale bar: 50 μm.) Line graph shows percentage of Ki67-positive cells in the EHBD of KTC and KTC-K19CreERT mice after TAM administration (means ± SD, n = 3 per time point). Surface BECs and PBGs were analyzed separately. (F) Double IF-stained images of E-cadherin and Ki67 in the EHBD of KTC-K19CreERT mice after TAM administration. (Scale bar: 50 μm.) To locate the E-cadherin–deleted duct cells, double IF-stained images of E-cadherin and K19 in serial sections from mice killed on days 10 and 15 are shown. Yellow arrowheads, E-cadherin–deleted nonproliferating surface BECs; white arrowheads, E-cadherin–deleted proliferating cells in PBGs; white arrows, E-cadherin–deleted proliferating cancerous glands.
Fig. S5.
Fig. S5.
Histology of the EHBD after TAM administration. (A) H&E-stained image of the lower area of the CBD of KTC-K19CreERT mice on day 10 after TAM administration. (Scale bar: 100 μm.) (B) Representative H&E-stained images of the EHBD of KTC-K19CreERT mice on day 15 after TAM administration. (Scale bar: Left panel, 500 μm; Right panel, 50 μm). Wall thickening due to cancerous glands was evident predominantly around the insertion site of the cystic duct. (C) H&E-stained images of the EHBD of KTC mice after TAM administration at the indicated time points. (Scale bar: 100 μm.) (D) LacZ-stained images of the EHBD of C-LacZ-K19CreERT and KT-LacZ-K19CreERT mice on day 10 after TAM administration. (Scale bar: 50 μm.) (E) Upper panels show IHC staining of E-cadherin in the hilar BD and peripheral IHBD of KTC-K19CreERT mice, and Lower panels show LacZ staining in the hilar BD and peripheral IHBD of KTC-LacZ-K19CreERT mice at 3.5 wk after TAM administration. (Scale bar: 50 μm.) (F) Quantitative analysis of Ki67-positive cells among E-cadherin–positive and –negative cells in the EHBD of KTC-K19CreERT mice on day 7. Bar graph shows the frequencies of Ki67-positive cells (means ± SD; n = 3 per group). *P < 0.05. (G) Double IF staining of phospho-histone 3 and K19 in the EHBD of KTC and KTC-K19CreERT mice on day 10 after TAM administration. (Scale bar: 50 μm.) Bar graph shows the frequencies of phospho-Histone 3-positive cells among the surface BECs and in PBGs (n = 3 per group). Data are means ± SD. *P < 0.05. (H) IHC staining of Ki67 in the EHBD from KT-K19CreERT and KTC-K19CreERT mice on day 10 after TAM administration. (Scale bar: 50 μm.) Bar graph shows the frequencies of Ki67-positive cells among the surface BECs and in PBGs (n = 3 per group).
Fig. 4.
Fig. 4.
Establishment of biliary organoid-derived cancer. (A) Micrograph and H&E-stained image of biliary organoids cultured from the EHBD of mice. (Scale bar: micrographs, 250 μm; H&E staining, 50 μm.) (B) Confirmation of recombination by Cre-expressing lentivirus in organoids from KTC mice. The indicated proteins were assessed by Western blot. Cre-mediated recombination of the LSL-Kras allele was confirmed by PCR. (C) Biliary organoids from the EHBD of KTC mice were infected with Cre-expressing or control lentivirus and then transplanted subcutaneously into nude mice. An H&E-stained image of an organoid-derived tumor is shown. (Scale bar: 50 μm.) (D) EHBD organoids from the indicated mice were infected with lentivirus and then transplanted subcutaneously into nude mice. Tumor formation was assessed 2 mo after transplantation. (E) H&E-stained images of EHBD organoids from the indicated mice after gene recombination. (Scale bar: 50 μm.)
Fig. S6.
Fig. S6.
Effects of IL-33 on BEC proliferation. (A) Photograph and H&E-stained image of the KTC organoid-derived s.c. tumor that developed in C57BL/6 mice. (B) H&E-stained images of the EHBD, IHBD, and GB of WT mice on day 5 after IL-33 administration. (Scale bar: EHBD and GB, 100 μm; IHBD, 50 μm.) (C) IHC of Ki67 in the EHBD of WT mice on day 5 after IL-33 administration. (Scale bar: 50 μm.) (D) Double IF staining of E-cadherin and IL-33 in the EHBD from KTC-K19CreERT mice on day 10 after TAM administration. (Scale bar: 50 μm.) (E) IL-33 protein concentrations in culture supernatants of KTC-BO cells were measured by ELISA. Supernatants were collected from control cells or cells undergoing necrosis caused by repeated freeze–thaw cycles. (F) H&E-stained image and IHC of IL-33 of ECC exhibiting luminal necrosis in KTC-K19CreERT mice. (Scale bar: Left, 50 μm; Right, 20 μm.) Arrowheads indicate luminal necrosis. (G) IHC staining of IL-33 of human ECC samples analyzed in Fig. 1E. (Scale bar: 50 μm.) Case 1 and Case 2 correspond, respectively, to Case 1 and Case 2 in Fig. 1E. (H) IHC staining of IL-33 of human ECC exhibiting luminal necrosis. (Scale bar: Left, 50 μm; Right, 20 μm.) Red arrowheads indicate luminal necrotic cells expressing IL-33. (I) Double IF staining of TUNEL and K19 (Upper panels) or CD45 (Lower panels) in the EHBD from KTC-K19CreERT mice on day 10 after TAM administration. (Scale bar: 50 μm.) (J and K) Double IF staining of CD45 and ST2 in the EHBD of KTC-K19CreERT mice on day 15 after TAM administration (J) and a xenograft derived from a Cre+ KTC organoid (K). (Scale bar: 20 μm.) Arrowheads indicate CD45+, ST2+ cells. (L) H&E-stained images of the EHBD of nude mice on day 5 after i.p. administration of IL-33 (1 μg) or vehicle control for 3 d. (Scale bar: 100 μm.)
Fig. 5.
Fig. 5.
IL-33 links biliary epithelial injury, regeneration, and cholangiocarcinogenesis. (A) cDNA microarray analysis of Cre+ KTC and Cre KTC organoids. A total of 1,096 genes were at least twofold up- or down-regulated in Cre+ KTC organoids. The top 20 up-regulated genes are shown. (B) EHBD organoids from the indicated mice were infected with control or Cre-expressing lentivirus, and relative IL-33 mRNA levels were determined by real-time PCR. Bar graph shows the relative IL-33 mRNA levels after infection with Cre-expressing lentivirus compared with the control lentivirus (means ± SD, n = 3 per group). *P < 0.05. (C) Relative IL-33 mRNA levels in EHBDs obtained from KTC and KTC-K19CreERT mice at 3.5 wk after TAM administration were determined by real-time PCR (n = 3 per group), and IL-33 protein levels in the bile and serum of KTC and KTC-K19CreERT mice at 3.5 wk after TAM administration were measured by ELISA (bile, n = 5 per group; serum, n = 8 per group). Data are means ± SD. *P < 0.05. (D) Double IF staining of E-cadherin and IL-33 in the EHBD of KTC-K19CreERT mice on day 5. (Scale bar: 50 μm.) To locate E-cadherin–deleted duct cells, double IF staining of E-cadherin and K19 in serial sections is also shown. (E) Numbers of hepatic ILC2s in KTC and KTC-K19CreERT mice on day 20 after TAM administration were analyzed by flow cytometry. Representative dot plots and numbers from three independent experiments (bar graph) are shown (means ± SD; n = 3 per group). *P < 0.05. (F) Relative IL-5, IL-13, and AREG mRNA levels were determined by real-time PCR in EHBDs from KTC and KTC-K19CreERT mice at 3.5 wk after TAM administration (means ± SD; n = 3 per group). *P < 0.05.
Fig. S7.
Fig. S7.
AREG contributes to proliferation of BECs. (A) Relative AREG mRNA levels in the EHBDs of vehicle control or IL-33–administered WT mice were determined by real-time PCR (n = 3 per group). EHBDs were harvested on day 5. Data are means ± SD. *P < 0.05. (B) IHC staining of Ki67 in EHBDs from vehicle control or AREG-administered WT mice. EHBDs were harvested on day 5. (Scale bar: 50 μm.) Bar graph shows the frequencies of Ki67-positive cells among surface BECs and in the PBGs (n = 3 per group). Data are means ± SD. *P < 0.05. (C) KTC-BO cells and TFK1 cells were treated with the indicated concentrations of AREG for 4 d. Cells were enumerated using the Cell Counting Kit-8. Data are means ± SD (n = 3 per group). *P < 0.05.
Fig. 6.
Fig. 6.
IL-33 cooperates with Kras and TGFβR2 mutations in the development of biliary tumors. (A) H&E-stained images of EHBDs and perihilar BDs from IL-33–administered KT and KT-K19CreERT mice. (Scale bar: Left panels, 100 μm; Right panels, 200 μm; Lower panels, 50 μm.) (B) LacZ-stained image of the EHBD of KT-LacZ-K19CreERT mice administered IL-33 using the protocol described in Fig. S8A. (Scale bar: 100 μm.) (C) H&E staining of the liver, including the perihilar and peripheral BD, of KT-K19CreERT+IL-33 mice. (Scale bar: 100 μm.)
Fig. S8.
Fig. S8.
Increased hepatic ILC2 numbers by IL-33 administration in KT-K19CreERT mice. (A) The protocol for exogenous IL-33 administration to KT and KT-K19CreERT mice. (B) Numbers of hepatic ILC2s in vehicle control- or IL-33–administered KT-K19CreERT mice were analyzed by flow cytometry 1 wk after initial IL-33 administration. Representative dot plots and numbers from three independent experiments (bar graph) are shown (means ± SD; n = 3 per group). *P < 0.05.
Fig. 7.
Fig. 7.
Blocking IL-33 suppresses ECC development. (A) Protocol of anti–IL-33 treatment of KTC-K19CreERT mice. (B and C) Representative macroscopic (B) and H&E-stained (C) images of EHBDs from KTC-K19CreERT mice treated with anti–IL-33 antibody or control IgG. (Scale bar: 500 μm.) Bar graph shows maximum diameter of the CBD (means ± SEM; n = 10 per group). *P < 0.05. (D) H&E-stained images of the IHBDs of anti–IL-33- or control IgG-administered KTC-K19CreERT mice. (Scale bar: 100 μm.) (E) Relative AREG and IL-13 mRNA levels in EHBDs from anti–IL-33 or control IgG-administered KTC-K19CreERT mice were determined by real-time PCR (means ± SD; n = 6 per group). *P < 0.05. (F) Numbers of hepatic ILC2s in anti–IL-33- or control IgG-administered KTC-K19CreERT mice on day 20 after TAM administration were analyzed by flow cytometry. Representative dot plots and numbers from three independent experiments (bar graph) are shown (means ± SD; n = 3 per group). *P < 0.05. (G) Representative Ki67-stained image of anti–IL-33 or control IgG-administered KTC-K19CreERT mice on day 10 after TAM administration. (Scale bar: 50 μm.) Bar graph shows the frequencies of Ki67-positive cells among the surface BECs and in PBGs (means ± SD; n = 5 per group). *P < 0.05. (H) Proposed mechanism of ECC development in KTC-K19CreERT mice.
Fig. S9.
Fig. S9.
Anti–IL-33 treatment suppressed the growth of tumor xenografts. (A) Photograph and H&E-stained image of the KTC-BO cell-derived s.c. tumor that developed in C57BL/6 mice. (B and C) C57BL/6 mice were transplanted subcutaneously with KTC-BO cells and then treated with anti–IL-33 antibody or control IgG every other day from day 8 to day 20. Tumor weights were analyzed on day 21. Photograph of the tumors (B) and tumor weights (C) are shown (n = 12 per group). *P < 0.05.
Fig. S10.
Fig. S10.
Loss of E-cadherin–induced YAP activation increases ECC proliferation and invasion. (A and B) IHC staining of β-catenin (A) and YAP (B) in ECC tissues from KTC and KTC-K19CreERT mice. Double IF staining of E-cadherin and β-catenin in ECC tissue from KTC-K19CreERT mice is also shown in A. (Scale bar: 50 μm.) Arrowheads in A indicate E-cadherin–negative cancer glands. (C) Expression levels of the indicated proteins in whole-cell and nuclear extracts of TFK1 cells were assessed by WB at 72 h after transfection of control or CDH1 siRNA. (D) WB analysis of YAP expression in TFK1 cells 72 h after transfection of control or YAP siRNA. (E) Growth curve of TFK1 cells after transfection of control siRNA, CDH1 siRNA, YAP siRNA, or CDH1 and YAP siRNAs. Data are means ± SD (n = 3). *P < 0.05. (F) TFK1 cells were photographed 72 h after transfection of control siRNA, CDH1 siRNA, or CDH1 and YAP siRNAs. (Scale bar: 100 μm.) (G) Invasion capacity of TFK1 cells transfected with control siRNA, CDH1 siRNA, or CDH1 and YAP siRNAs. Data are means ± SD (n = 3). *P < 0.05. (H) WB analysis of YAP expression in KTC-BO cells 72 h after transfection of control or YAP siRNA. (I) Growth curve of KTC-BO cells after transfection of control or YAP siRNA. Data are means ± SD (n = 3). *P < 0.05. (J) Relative Birc5 and Foxm1 mRNA levels were determined by real-time PCR in KTC-BO cells 72 h after transfection of control or YAP siRNA. Data are means ± SD (n = 3). *P < 0.05. (K) Representative H&E-stained images of EHBDs from KTC-K19CreERT mice treated with verteporfin or vehicle control. (Scale bar: 500 μm.) Bar graph shows maximum diameter of the common bile duct in verteporfin- or vehicle-administered KTC-K19CreERT mice (n = 10 per group). Data are means ± SEM. *P < 0.05.

References

    1. Rizvi S, Gores GJ. Pathogenesis, diagnosis, and management of cholangiocarcinoma. Gastroenterology. 2013;145:1215–1229. - PMC - PubMed
    1. Malhi H, Gores GJ. Cholangiocarcinoma: Modern advances in understanding a deadly old disease. J Hepatol. 2006;45:856–867. - PMC - PubMed
    1. Chan-On W, et al. Exome sequencing identifies distinct mutational patterns in liver fluke-related and non-infection-related bile duct cancers. Nat Genet. 2013;45:1474–1478. - PubMed
    1. Nakamura H, et al. Genomic spectra of biliary tract cancer. Nat Genet. 2015;47:1003–1010. - PubMed
    1. Roskams T, Desmet V. Embryology of extra- and intrahepatic bile ducts, the ductal plate. Anat Rec (Hoboken) 2008;291:628–635. - PubMed

Publication types

MeSH terms

Substances