. 2017 Jun 13;199(13):e00849-16.
doi: 10.1128/JB.00849-16. Print 2017 Jul 1.

Impact of Membrane Phospholipid Alterations in Escherichia coli on Cellular Function and Bacterial Stress Adaptation

Affiliations

Impact of Membrane Phospholipid Alterations in Escherichia coli on Cellular Function and Bacterial Stress Adaptation

Veronica W Rowlett et al. J Bacteriol. .

Abstract

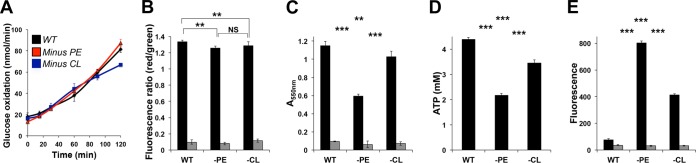
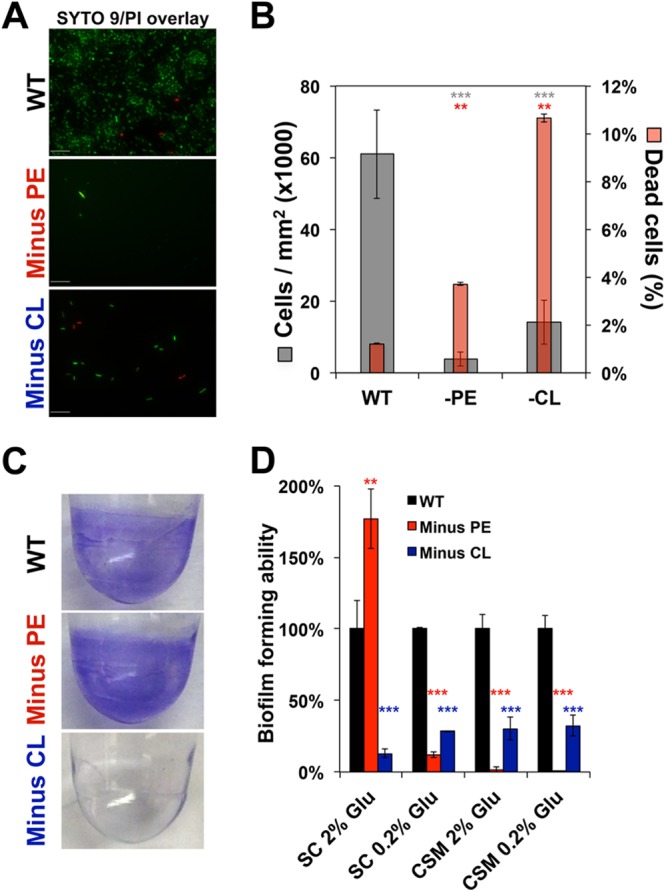
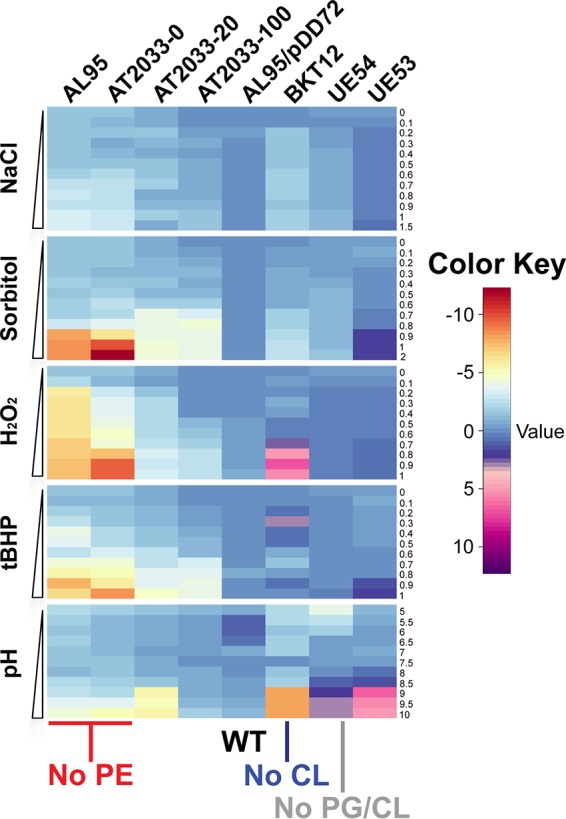
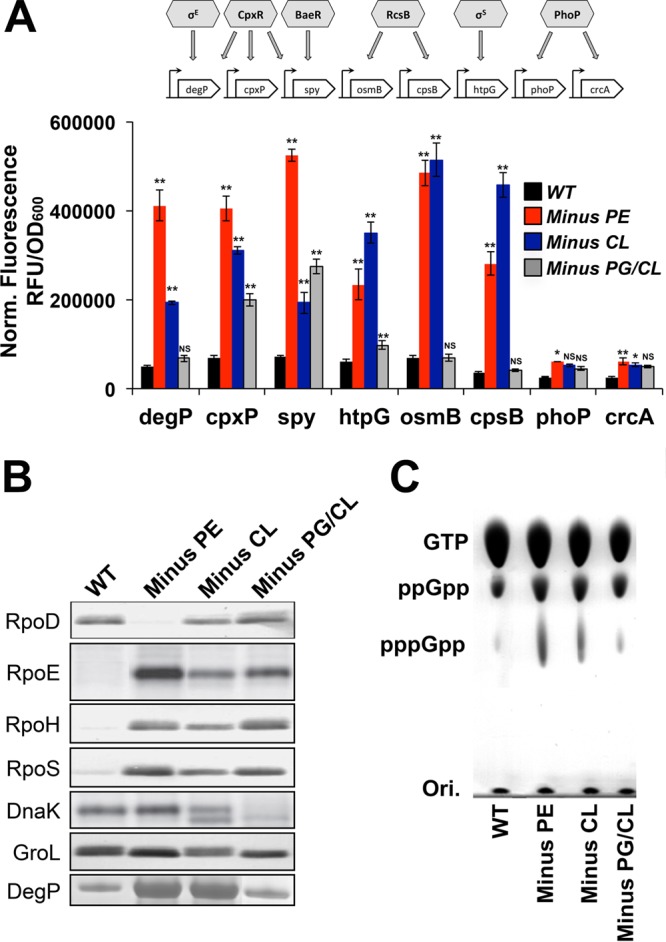
Bacteria have evolved multiple strategies to sense and rapidly adapt to challenging and ever-changing environmental conditions. The ability to alter membrane lipid composition, a key component of the cellular envelope, is crucial for bacterial survival and adaptation in response to environmental stress. However, the precise roles played by membrane phospholipids in bacterial physiology and stress adaptation are not fully elucidated. The goal of this study was to define the role of membrane phospholipids in adaptation to stress and maintenance of bacterial cell fitness. By using genetically modified strains in which the membrane phospholipid composition can be systematically manipulated, we show that alterations in major Escherichia coli phospholipids transform these cells globally. We found that alterations in phospholipids impair the cellular envelope structure and function, the ability to form biofilms, and bacterial fitness and cause phospholipid-dependent susceptibility to environmental stresses. This study provides an unprecedented view of the structural, signaling, and metabolic pathways in which bacterial phospholipids participate, allowing the design of new approaches in the investigation of lipid-dependent processes involved in bacterial physiology and adaptation.IMPORTANCE In order to cope with and adapt to a wide range of environmental conditions, bacteria have to sense and quickly respond to fluctuating conditions. In this study, we investigated the effects of systematic and controlled alterations in bacterial phospholipids on cell shape, physiology, and stress adaptation. We provide new evidence that alterations of specific phospholipids in Escherichia coli have detrimental effects on cellular shape, envelope integrity, and cell physiology that impair biofilm formation, cellular envelope remodeling, and adaptability to environmental stresses. These findings hold promise for future antibacterial therapies that target bacterial lipid biosynthesis.

Keywords: membranes; metabolism; phospholipids; physiology; stress adaptation; stress response.


Figures

FIG 1
FIG 1
Membrane phospholipids of Escherichia coli. (A) Native lipid biosynthesis in E. coli. Genes encoding the following enzymes and associated with each biosynthetic step are listed next to the arrows. Lipid abbreviations are as follows: DAG, diacylglycerol; PS, phosphatidylserine; PA, phosphatidic acid; PE, phosphatidylethanolamine; PG, phosphatidylglycerol; CL, cardiolipin. Enzymes are indicated as follows: 1, CDP-DAG synthetase; 2, PS synthase; 3, PS decarboxylase; 4, PGP synthase; 5, PGP phosphatases; 6, CL synthases; 7, PG:membrane-derived oligosaccharide sn-glycerol-1-P transferase; 8, DAG kinase. Boxed phospholipids are the major phospholipids of E. coli; phospholipids in red are anionic lipids. (B) TLC analysis of total lipid extracts from WT and phospholipid-altered strains grown to mid-exponential phase in M9 minimal medium supplemented with 2% glucose and SC amino acids. (C) Histograms depict the lipid compositions determined by total phosphate assay after scraping off each lipid spot for the various strains. Error bars show the standard deviations (SD); n = 3.
FIG 2
FIG 2
Effects of phospholipid composition on cell morphology and growth. (A, B) DIC and fluorescence images of WT and phospholipid-altered cells grown to exponential phase in LB medium (A) or M9 minimal medium (B) and stained with FM 4-64. The zoom panels show a higher magnification of the boxed fields from the FM 4-64 panels. Bars, 5 μm. (C, D) Determination of cell lengths for cells grown to mid-exponential phase in LB (C) and M9 (D) media. Each datum point was determined by imaging 1,400 WT, 1,000 CL-lacking, and 800 PE-lacking cells by phase-contrast microscopy and using Oufti software (59) to determine cell length. (E, F) Representative growth curves of the WT and phospholipid-altered strains grown in LB (E) and M9 (F) media. Arrows indicate the time points/OD600 values used to perform the various assays and analyses. (C to F) Mean values ± standard errors of the means (SEM) are shown; n = 5 per group.
FIG 3
FIG 3
Visualization of cellular ultrastructure by electron microscopy. Transmission electron microscopy of thin sections of WT and phospholipid-altered (minus-PE and minus-CL) cells grown in LB medium to exponential phase and stationary phase. Cells were grown aerobically in LB medium until they reached mid-logarithmic phase (OD600 of ∼0.3) or stationary phase (OD600 of ∼2). All specimens were fixed, embedded, ultrathin sectioned, and poststained before imaging on a JEOL 1400 electron microscope. Bars, 1 μm (left) and 200 nm (center and right).
FIG 4
FIG 4
Alterations in E. coli major phospholipids cause defects in LPS structure, outer membrane protein assembly, and cellular envelope homeostasis. (A) Lipopolysaccharides from E. coli WT and phospholipid-altered cells separated by SDS-PAGE and visualized by silver staining. (B) OmpF folding assessment by differential electrophoretic mobility after heat denaturation in WT and phospholipid-altered cells. F, folded; U, unfolded. (C) Schematic representation of the metabolic pathways leading to incorporation of glucose- and acetate-derived carbon into phospholipids and outer membrane glycolipids, such as LPS. 1, glycolytic pathway; 2, acetyl-CoA carboxylase; 3, malonyl-CoA:ACP transacylase; 4, glycerol-3-P dehydrogenase; 5, glycerol-3-P and lysophosphatidic acid acyltransferases; 6, LPS biosynthetic pathway; 7, cell surface and wall polysaccharide biosynthetic pathway. DHAP, dihydroxyacetone phosphate; FAS, fatty acid synthesis. (D) Bacterial remodeling assessment using radioactive nutrient labeling. Incorporation of 14C-labeled glucose (left) and 14C-labeled acetate (right) into cellular envelope components is measured after extraction of total lipids (TL) or isolation of outer membrane glycolipids (OMGL) from cells cultured in the presence of radiolabeled nutrient. Incorporation of radioactivity into the fatty acyl (FA) moieties is evaluated after saponification. DPM, disintegrations per minute. Mean values ± SEM are shown; n = 3 per group.
FIG 5
FIG 5
Bacterial physiology profiling of phospholipid-altered E. coli strains. WT and phospholipid-altered strains were grown to mid-exponential phase in M9 minimal medium containing 2% glucose, SC amino acids, and all the necessary supplements. (A) Glucose oxidation rate (14CO2 release). (B) Cellular dehydrogenase activity (MTT assay). (C) Membrane potential (DiSC35 probe). (D) ATP levels (luciferase-based assay). (E) Cellular reactive oxygen species (ROS) measurements (CM-H2DCFDA probe). Mean values ± SEM are shown; n = 3 to 4 per group. **, P < 0.05; ***, P < 0.01; NS, not significant. ANOVA and Student's t test were used. (B, C, E) Gray bars indicate baseline readings obtained by measurements done in the presence of an inhibitor of NADH:ubiquinone oxidoreductase (piericidin A, 10 μM) or the protonophore carbonyl cyanide m-chlorophenylhydrazone (CCCP, 20 μM) or in the absence of dye, respectively.
FIG 6
FIG 6
Surface adhesion and biofilm-forming abilities of phospholipid-altered E. coli strains. (A, B) Phospholipid-dependent surface adhesion. Fluorescence microscopy examination of surface adhesion (A) of WT and phospholipid-altered E. coli cells with the Filmtracer Live/Dead biofilm viability stain (Thermo Fisher), which reveals viable (green) and nonviable (red) cells. E. coli cells were grown in 24-well plates with flat glass bottoms in M9 minimal medium supplemented with 2% glucose and all the amino acids (SC-based medium) for 24 h without shaking at 30°C. Representative fields for each strain condition are presented (n = 3). Scale bar, 10 μm. (B) Surface-attached cells (gray bars) and dead cells (red bars) were counted. Mean values ± SD obtained from three independent experiments are shown. (C, D) Phospholipid-dependent biofilm formation. (C) E. coli forms biofilms on polystyrene plates as evaluated by the crystal violet assay. (D) Quantification of biofilm formation of WT and phospholipid-altered strains in M9 minimal medium supplemented with glucose at the indicated concentrations and either all amino acids (SC) or only essential amino acids (CSM). Values are presented as percentages of biofilm formation normalized to the biofilm formation of the WT. (B, D) Mean values ± SD are shown; n = 3 to 4 per group. **, P < 0.05; ***, P < 0.01; NS, not significant; ANOVA and Student's t test.
FIG 7
FIG 7
Phospholipid-dependent bacterial stress screening. Heatmaps depicting logarithmic fold changes in growth rates of WT and phospholipid-altered E. coli strains grown in LB medium containing 50 mM MgCl2 and in the presence of incremental concentrations of stressors resulting in salt stress (NaCl), osmotic stress (sorbitol), oxidative stresses (hydrogen peroxide [H2O2] and tert-butyl hydroperoxide [tBHP]), and pH stress. All data shown are mean values from four experimental replicates.
FIG 8
FIG 8
Phospholipid-dependent stress responses in E. coli. (A) Expression levels of selected bacterial stress response reporters. Histograms represent the normalized fluorescence of GFP expressed from PdegP, PcpxP, Pspy, PhtpG, PosmB, PcpsB, PphoP, and PcrcA promoters during mid-logarithmic growth. WT and phospholipid-altered strains containing each reporter were cultivated in M9 minimal medium supplemented with 2% glucose, SC amino acids, and all the necessary supplements and then assayed for OD600 and GFP fluorescence levels. Stress regulators and their target regulon members used as reporters are presented above the histograms. RFU, relative fluorescence units. Mean values ± SEM are shown; n = 3 to 4 per group. **, P < 0.05; ***, P < 0.01; NS, not significant. ANOVA and Student's t test were used. (B) Immunoblots using RpoD-, RpoE-, RpoH-, RpoS-, DnaK-, GroL-, and DegP-specific antibodies on whole-cell lysates from WT (1st lane) and phospholipid-altered E. coli strains (lacking PE, 2nd lane; lacking CL, 3rd lane; lacking PG/CL, 4th lane) grown in the absence of any stressor. (C) Representative autoradiogram of PEI thin-layer chromatography of the accumulation of (p)ppGpp in WT and phospholipid-altered cells. WT and phospholipid-altered strains were cultivated in M9 minimal medium supplemented with 2% glucose, SC amino acids, and all the necessary supplements and in the presence of 32PO4.

References

    1. Ruiz N, Silhavy TJ. 2005. Sensing external stress: watchdogs of the Escherichia coli cell envelope. Curr Opin Microbiol 8:122–126. doi:10.1016/j.mib.2005.02.013. - DOI - PubMed
    1. Raivio TL. 2005. Envelope stress responses and Gram-negative bacterial pathogenesis. Mol Microbiol 56:1119–1128. doi:10.1111/j.1365-2958.2005.04625.x. - DOI - PubMed
    1. Rowley G, Spector M, Kormanec J, Roberts M. 2006. Pushing the envelope: extracytoplasmic stress responses in bacterial pathogens. Nat Rev Microbiol 4:383–394. doi:10.1038/nrmicro1394. - DOI - PubMed
    1. Silhavy TJ, Kahne D, Walker S. 2010. The bacterial cell envelope. Cold Spring Harb Perspect Biol 2:a000414. doi:10.1101/cshperspect.a000414. - DOI - PMC - PubMed
    1. Needham BD, Trent MS. 2013. Fortifying the barrier: the impact of lipid A remodelling on bacterial pathogenesis. Nat Rev Microbiol 11:467–481. doi:10.1038/nrmicro3047. - DOI - PMC - PubMed

MeSH terms