. 2018 May;23(5):1385-1392.
doi: 10.1038/mp.2017.62. Epub 2017 Apr 25.

Brain age predicts mortality

Affiliations

Brain age predicts mortality

J H Cole et al. Mol Psychiatry. 2018 May.

Abstract

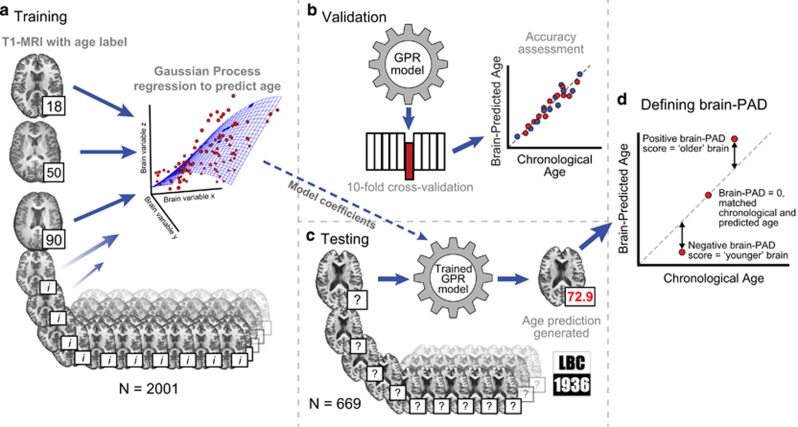
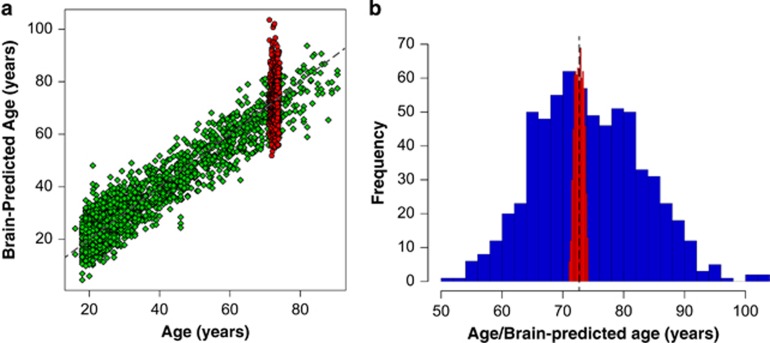
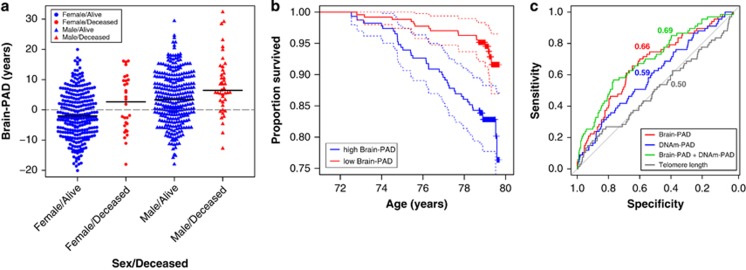
Age-associated disease and disability are placing a growing burden on society. However, ageing does not affect people uniformly. Hence, markers of the underlying biological ageing process are needed to help identify people at increased risk of age-associated physical and cognitive impairments and ultimately, death. Here, we present such a biomarker, 'brain-predicted age', derived using structural neuroimaging. Brain-predicted age was calculated using machine-learning analysis, trained on neuroimaging data from a large healthy reference sample (N=2001), then tested in the Lothian Birth Cohort 1936 (N=669), to determine relationships with age-associated functional measures and mortality. Having a brain-predicted age indicative of an older-appearing brain was associated with: weaker grip strength, poorer lung function, slower walking speed, lower fluid intelligence, higher allostatic load and increased mortality risk. Furthermore, while combining brain-predicted age with grey matter and cerebrospinal fluid volumes (themselves strong predictors) not did improve mortality risk prediction, the combination of brain-predicted age and DNA-methylation-predicted age did. This indicates that neuroimaging and epigenetics measures of ageing can provide complementary data regarding health outcomes. Our study introduces a clinically-relevant neuroimaging ageing biomarker and demonstrates that combining distinct measurements of biological ageing further helps to determine risk of age-related deterioration and death.


Conflict of interest statement

The authors declare no conflict of interest.

Figures

Figure 1
Figure 1
Overview of study methods. Illustration of the methods used to generate brain-predict ages. 3D T1-weighted MRI scans were segmented into grey and WM before being normalised in common space using non-linear spatial registration. Normalised grey and WM images were concatenated and converted into vectors for each subject. These vectors were then projected into an NxN similarity matrix based on vector dot-products. (a) Once in similarity matrix form the training subjects’ data were used as predictors in a Gaussian Processes regression (GPR) with age as the outcome variable. (b) Model accuracy was assessed in a ten-fold cross-validation procedure, comparing brain-predicted age with original chronological age labels. (c) Model coefficients learned during training were then applied to the data from LBC1936 participants to make age predictions. (d) A metric to summarise the variation in predicted age was defined; the brain-predicted age difference (brain-PAD; predicted age—chronological age). LBC1936, Lothian Birth Cohort 1936; MRI, magnetic resonance imaging; WM, white matter.
Figure 2
Figure 2
Brain-predicted age using structural neuroimaging in LBC1936. (a) Scatterplot showing the relationship between chronological age and brain-predicted age in the independent healthy cohort used as the training data (green diamonds) and the LBC1936 participants used as the test set (red circles). (b) Histogram showing the distributions of brain-predicted age (in blue) compared to the distribution in chronological age (in red). The substantially wider variability in brain-predicted age is evident. LBC1936, Lothian Birth Cohort 1936.
Figure 3
Figure 3
Association of mortality with brain-predicted age difference and DNA-methylation-predicted age difference. (a) Grouped scatterplot showing the relationship between brain-predicted age difference (brain-PAD) score (i.e., brain-predicted age—chronological age) and mortality (alive=blue, dead=red), sub-divided by sex (female=circle, male=triangle). Mortality status was determined ~6 years after MRI assessment. Horizontal black lines represent the median for each sub-group. (b) Kaplan–Meier plot of right-censored survival data since MRI assessment. The two lines represent a tertile split based on brain-PAD score, with highest 33.3% being classed as high brain-PAD (red line) indicating increased brain ageing and the lowest 33.3% (low brain-PAD, blue line) indicating reduced brain ageing. Crosses indicate censoring points (i.e. age at last survival ascertainment). Dotted lines represent the 95% confidence intervals. (c) Figure depicts the receiver operator characteristic (ROC) curves for four contrasting, nested, survival models. All models used mortality status as the response variables. The predictor variables were Brain-PAD (red line, model 1), DNAm-PAD (blue line, model 5), Brain-PAD+DNAm-PAD (green line, model 4), Telomere length+Brain-PAD+DNAm-PAD (grey line, model 3). The areas under the curve (AUC) are coloured-coded and appear next to each ROC curve. MRI, magnetic resonance imaging.

Similar articles

Cited by

References

    1. Vos T, Flaxman AD, Naghavi M, Lozano R, Michaud C, Ezzati M et al. Years lived with disability (YLDs) for 1160 sequelae of 289 diseases and injuries 1990–2010: a systematic analysis for the Global Burden of Disease Study 2010. Lancet 2012; 380: 2163–2196. - PMC - PubMed
    1. Bocklandt S, Lin W, Sehl ME, Sánchez FJ, Sinsheimer JS, Horvath S et al. Epigenetic predictor of age. PLoS ONE 2011; 6: e14821. - PMC - PubMed
    1. Horvath S. DNA methylation age of human tissues and cell types. Genome Biol 2013; 14: R115. - PMC - PubMed
    1. Kruk PA, Rampino NJ, Bohr VA. DNA damage and repair in telomeres: relation to aging. Proc Natl Acad Sci USA 1995; 92: 258–262. - PMC - PubMed
    1. Vanhooren V, Dewaele S, Libert C, Engelborghs S, De Deyn PP, Toussaint O et al. Serum N-glycan profile shift during human ageing. Exp Gerontol 2010; 45: 738–743. - PubMed

Publication types