. 2017 Apr 7:8:456.
doi: 10.3389/fpsyg.2017.00456. eCollection 2017.

Repeated Measures Correlation

Affiliations

Repeated Measures Correlation

Jonathan Z Bakdash et al. Front Psychol. .

Erratum in

  • Corrigendum: Repeated Measures Correlation.
    Bakdash JZ, Marusich LR. Bakdash JZ, et al. Front Psychol. 2019 May 28;10:1201. doi: 10.3389/fpsyg.2019.01201. eCollection 2019. Front Psychol. 2019. PMID: 31191398 Free PMC article.

Abstract

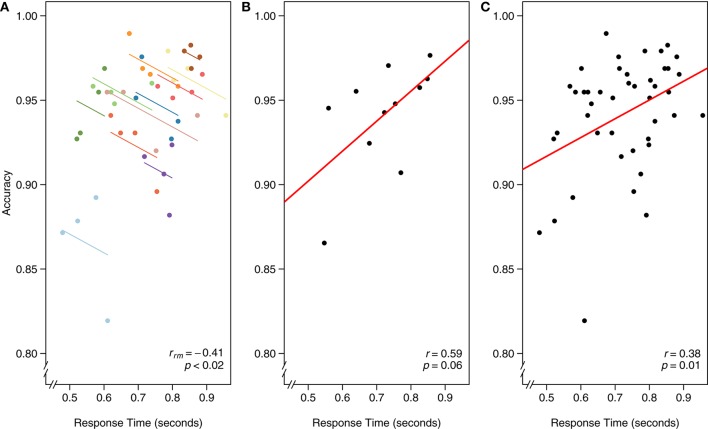
Repeated measures correlation (rmcorr) is a statistical technique for determining the common within-individual association for paired measures assessed on two or more occasions for multiple individuals. Simple regression/correlation is often applied to non-independent observations or aggregated data; this may produce biased, specious results due to violation of independence and/or differing patterns between-participants versus within-participants. Unlike simple regression/correlation, rmcorr does not violate the assumption of independence of observations. Also, rmcorr tends to have much greater statistical power because neither averaging nor aggregation is necessary for an intra-individual research question. Rmcorr estimates the common regression slope, the association shared among individuals. To make rmcorr accessible, we provide background information for its assumptions and equations, visualization, power, and tradeoffs with rmcorr compared to multilevel modeling. We introduce the R package (rmcorr) and demonstrate its use for inferential statistics and visualization with two example datasets. The examples are used to illustrate research questions at different levels of analysis, intra-individual, and inter-individual. Rmcorr is well-suited for research questions regarding the common linear association in paired repeated measures data. All results are fully reproducible.

Keywords: correlation; individual differences; intra-individual; multilevel modeling; repeated measures; statistical power.


Figures

Figure 1
Figure 1
(A) Rmcorr plot: rmcorr plot for a set of hypothetical data and (B) simple regression plot: the corresponding regression plot for the same data averaged by participant.
Figure 2
Figure 2
These notional plots illustrate the range of potential similarities and differences in the intra-individual association assessed by rmcorr and the inter-individual association assessed by ordinary least squares (OLS) regression. Rmcorr-values depend only on the intra-individual association between variables and will be the same across different patterns of inter-individual variability. (A) rrm = −1: depicts notional data with a perfect negative intra-individual association between variables, (B) rrm = 0: depicts data with no intra-individual association, and (C) rrm = 1: depicts data with a perfect positive intra-individual association. In each column, the relationship between subjects (inter-individual variability) is different, which does not change the rmcorr-values within a column. However, this does change the association that would be predicted by OLS regression (black lines) if the data were treated as IID or averaged by participant.
Figure 3
Figure 3
Rmcorr-values (and corresponding p-values) do not change with linear transformations of the data, illustrated here with three examples: (A) original, (B) x/2 + 1, and (C) y − 1.
Figure 4
Figure 4
Power curves for (A) small, rrm, and r = 0.10, (B) medium, rrm, and r = 0.3, and (C) large effect sizes, rrm, and r = 0.50. X-axis is sample size. Note the sample size range differs among the panels. Y-axis is power. k denotes the number of repeated paired measures. Eighty percent power is indicated by the dotted black line. For rmcorr, the power of k = 2 is asymptotically equivalent to k = 1. A comparison to the power for a Pearson correlation with one data point per participant (k = 1) is also shown.
Figure 5
Figure 5
Comparison of rmcorr and simple regression/correlation results for age and brain structure volume data. Each dot represents one of two separate observations of age and CBH for a participant. (A) Separate simple regressions/correlations by time: each observation is treated as independent, represented by shading all the data points black. The red line is the fit of the simple regression/correlation. (B) Rmcorr: observations from the same participant are given the same color, with corresponding lines to show the rmcorr fit for each participant. (C) Simple regression/correlation: averaged by participant. Note that the effect size is greater (stronger negative relationship) using rmcorr (B) than with either use of simple regression models (A) and (C). This figure was created using data from Raz et al. (2005).
Figure 6
Figure 6
The x-axis is reaction time (seconds) and the y-axis is accuracy in visual search. (A) Rmcorr: each dot represents the average reaction time and accuracy for a block, color identifies participant, and colored lines show rmcorr fits for each participant. (B) Simple regression/correlation (averaged data): each dot represents a block, (improperly) treated as an independent observation. The red line is the fit to the simple regression/correlation. (C) Simple regression/correlation (aggregated data): improperly treating each dot as independent. This figure was created using data from Gilden et al. (2010).

References

    1. Aarts E., Verhage M., Veenvliet J. V., Dolan C. V., van der Sluis S. (2014). A solution to dependency: using multilevel analysis to accommodate nested data. Nat. Neurosci. 17, 491–496. 10.1038/nn.3648 - DOI - PubMed
    1. Babyak M. A. (2004). What you see may not be what you get: a brief, nontechnical introduction to overfitting in regression-type models. Psychosom. Med. 66, 411–421. - PubMed
    1. Bates D., Kliegl R., Vasishth S., Baayen H. (2015). Parsimonious Mixed Models. ArXiv150604967 Stat. Available online at: http://arxiv.org/abs/1506.04967 (Accessed February 7, 2016).
    1. Bland J. M., Altman D. G. (1995a). Calculating correlation coefficients with repeated observations: part 1 Correlation within subjects. BMJ 310:446. 10.1136/bmj.310.6977.446 - DOI - PMC - PubMed
    1. Bland J. M., Altman D. G. (1995b). Calculating correlation coefficients with repeated observations: part 2Correlation between subjects. BMJ 310:633 10.1136/bmj.310.6980.633 - DOI - PMC - PubMed