. 2017 Apr;4(2):024001.
doi: 10.1117/1.JMI.4.2.024001. Epub 2017 Apr 17.

Automatic image quality assessment and measurement of fetal head in two-dimensional ultrasound image

Affiliations

Automatic image quality assessment and measurement of fetal head in two-dimensional ultrasound image

Lei Zhang et al. J Med Imaging (Bellingham). 2017 Apr.

Abstract

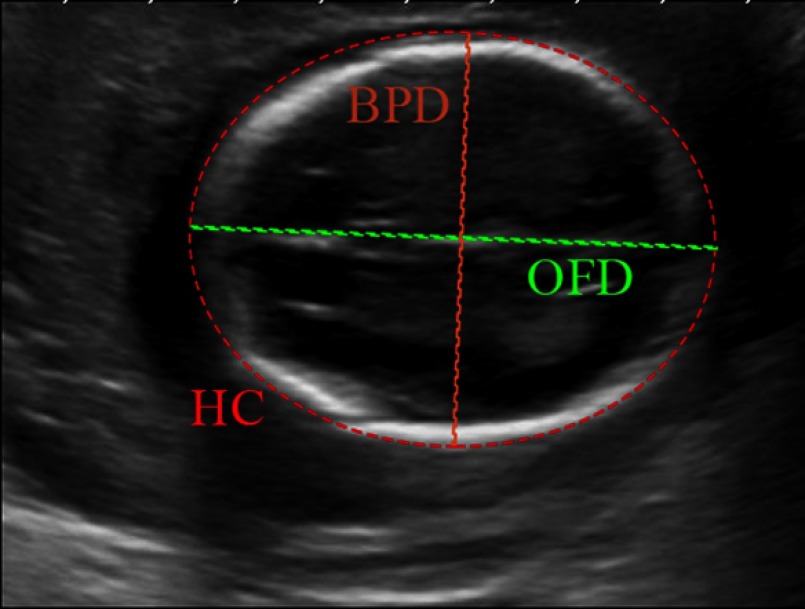
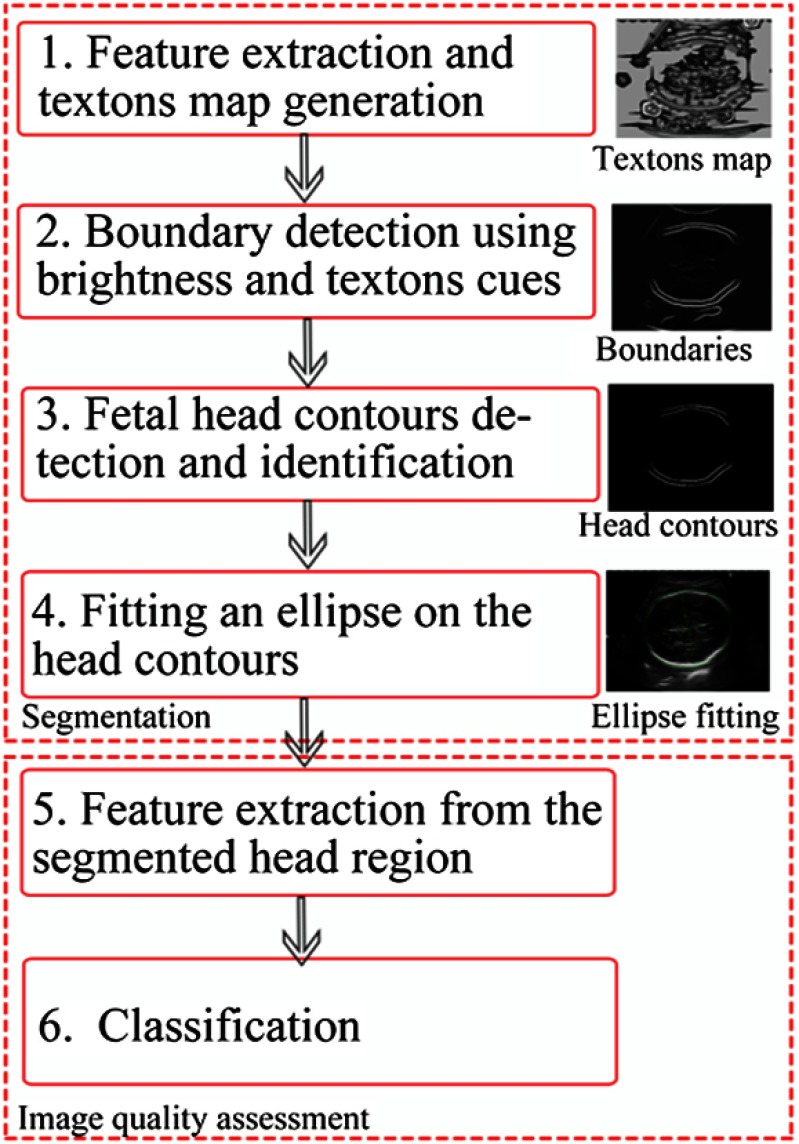
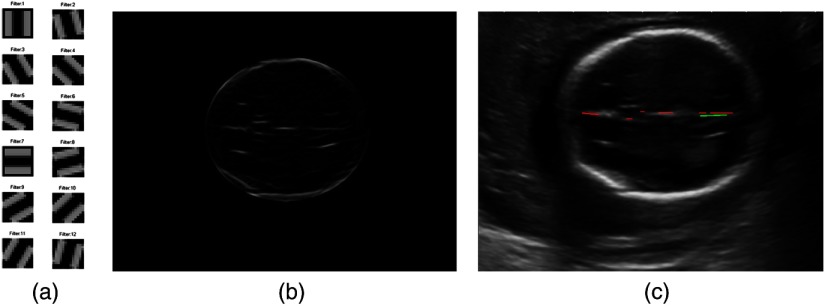
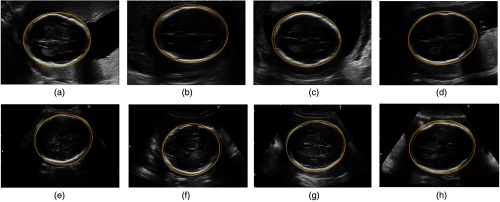
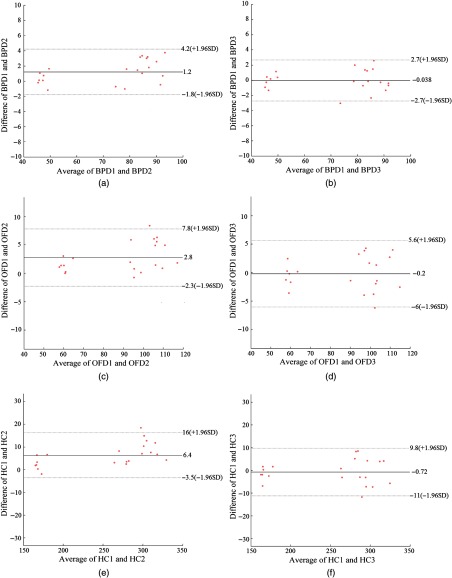
Owing to the inconsistent image quality existing in routine obstetric ultrasound (US) scans that leads to a large intraobserver and interobserver variability, the aim of this study is to develop a quality-assured, fully automated US fetal head measurement system. A texton-based fetal head segmentation is used as a prerequisite step to obtain the head region. Textons are calculated using a filter bank designed specific for US fetal head structure. Both shape- and anatomic-based features calculated from the segmented head region are then fed into a random forest classifier to determine the quality of the image (e.g., whether the image is acquired from a correct imaging plane), from which fetal head measurements [biparietal diameter (BPD), occipital-frontal diameter (OFD), and head circumference (HC)] are derived. The experimental results show a good performance of our method for US quality assessment and fetal head measurements. The overall precision for automatic image quality assessment is 95.24% with 87.5% sensitivity and 100% specificity, while segmentation performance shows 99.27% ([Formula: see text]) of accuracy, 97.07% ([Formula: see text]) of sensitivity, 2.23 mm ([Formula: see text]) of the maximum symmetric contour distance, and 0.84 mm ([Formula: see text]) of the average symmetric contour distance. The statistical analysis results using paired [Formula: see text]-test and Bland-Altman plots analysis indicate that the 95% limits of agreement for inter observer variability between the automated measurements and the senior expert measurements are 2.7 mm of BPD, 5.8 mm of OFD, and 10.4 mm of HC, whereas the mean differences are [Formula: see text], [Formula: see text], and [Formula: see text], respectively. These narrow 95% limits of agreements indicate a good level of consistency between the automated and the senior expert's measurements.

Keywords: fetal head biometric measurements; image quality assessment; random forest classifier; texton feature; ultrasound fetal segmentation.


Figures

Fig. 1
Fig. 1
The biometric measurements of the fetal head. The BPD measurement is taken on the outer border of the parietal bones (outer to outer) at the widest part of skull. The OFD is measured between the outer border of the occipital and frontal edges of the skull at the point of the midline (outer to outer) across the longest part of skull. The HC is the HC calculated from the formula HC=π(BPD+OFD)/2.
Fig. 2
Fig. 2
Flow diagram of the proposed algorithm for fetal head segmentation and image quality assessment.
Fig. 3
Fig. 3
Examples of maximal responses to the designed filter bank. (a) Fetal head response to the second derivative of Gaussian at scale σ=5, (b) response to the matched filter at scale σ=5, and (c) response to the standard Gaussian filter at scale σ=1.
Fig. 4
Fig. 4
Examples of mPb, sPb, and gPb extracted from a fetal head US image and the final identified fetal head contours. (a) Local boundaries mPb, (b) spectral boundaries sPb, (c) globalized probability of boundary gPb, and (d) final identified fetal head boundaries.
Fig. 5
Fig. 5
The matched filter used to extract midline feature (a) is the filter bank, (b) is an example of the maximal response to the filter bank, and (c) is the detected lines using Hough transform analysis, where the green line is the longest line segment and the other detected line segments are shown in red lines.
Fig. 6
Fig. 6
Examples of our automatic segmentations comparing to two experts segmentations on the good quality and poor quality cases. The contours of structures produced by the automatic method are shown in green (dot lines), contours delineated by experts 1 and 2 are shown in red and yellow (solid line), respectively. (a)–(d) are fetal head segmentations in the good-quality images and (e)–(h) are the segmentations in the poor-quality images.
Fig. 7
Fig. 7
Interobserver variability in fetal biometric measurements (BPD, OFD, and HC). (a)–(c) are the interobserver variability between two experts; and (d)–(f) are the differences between automatic and manual measurements, where BPD 1 denotes the expert 1, BPD 2 is expert 2, and BPD 3 denotes automatic measurements, same for OFD and HC.

References

    1. Rueda S., et al. , “Evaluation and comparison of current fetal ultrasound image segmentation methods for biometric measurements: a grand challenge,” IEEE Trans. Med. Imaging 33(4), 797–813 (2014).ITMID410.1109/TMI.2013.2276943 - DOI - PubMed
    1. Loughna P., et al. , “Fetal size and dating: charts recommended for clinical obstetric practice,” Ultrasound 17(3), 160–166 (2009).10.1179/174313409X448543 - DOI
    1. Pemberton L. K., Burd I., Wang E., “An appraisal of ultrasound fetal biometry in the first trimester,” Rep. Med. Imaging 2010(3), 11–15 (2010).10.2147/RMI.S9119 - DOI
    1. Chervenak F. A., et al. , “How accurate is fetal biometry in the assessment of fetal age?” Am. J. Obstet. Gynecol. 178(4), 678–687 (1998).10.1016/S0002-9378(98)70477-6 - DOI - PubMed
    1. Dudley N. J., “A systematic review of the ultrasound estimation of fetal weight,” Ultrasound Obstet. Gynecol. 25(1), 80–89 (2005).10.1002/(ISSN)1469-0705 - DOI - PubMed