

The demography of words: The global decline in non-numeric fertility preferences, 1993-2011
- PMID: 28440109
- PMCID: PMC5525551
- DOI: 10.1080/00324728.2017.1304565
The demography of words: The global decline in non-numeric fertility preferences, 1993-2011
Abstract
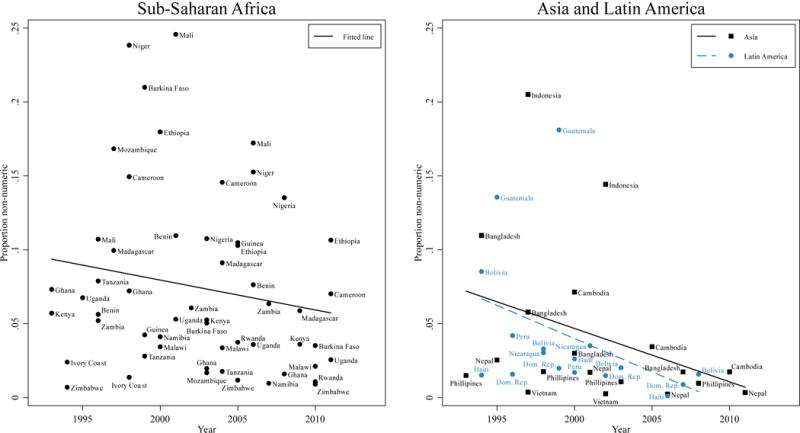
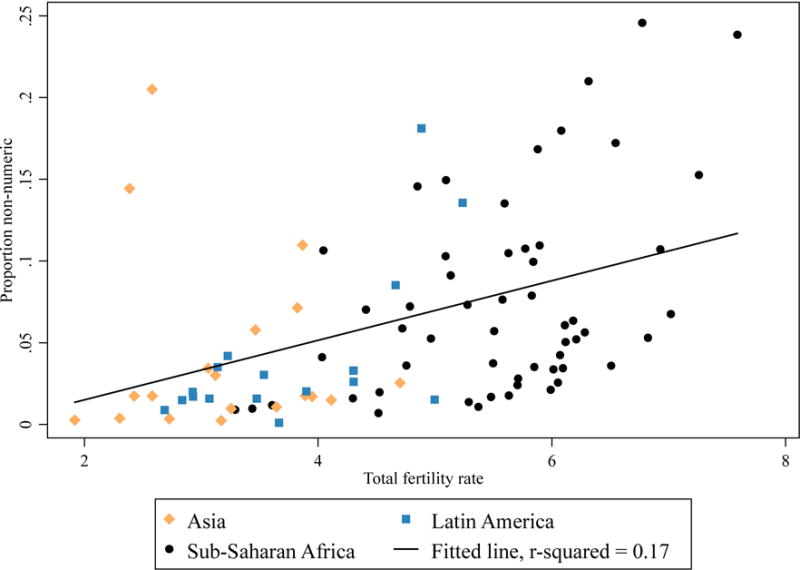
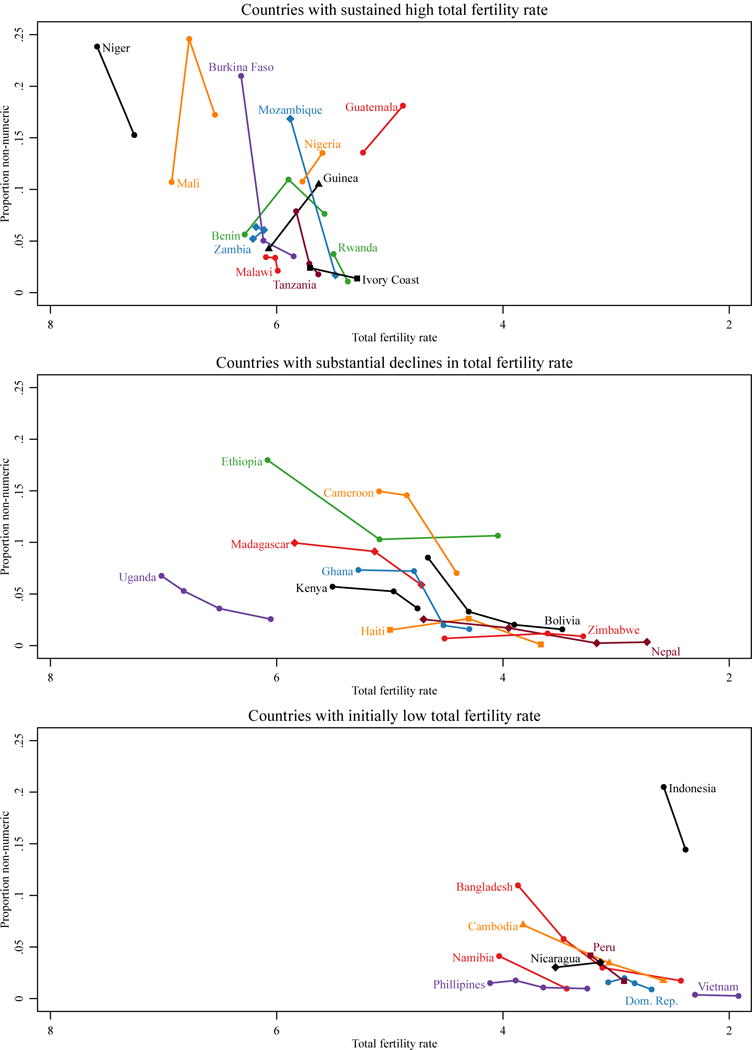
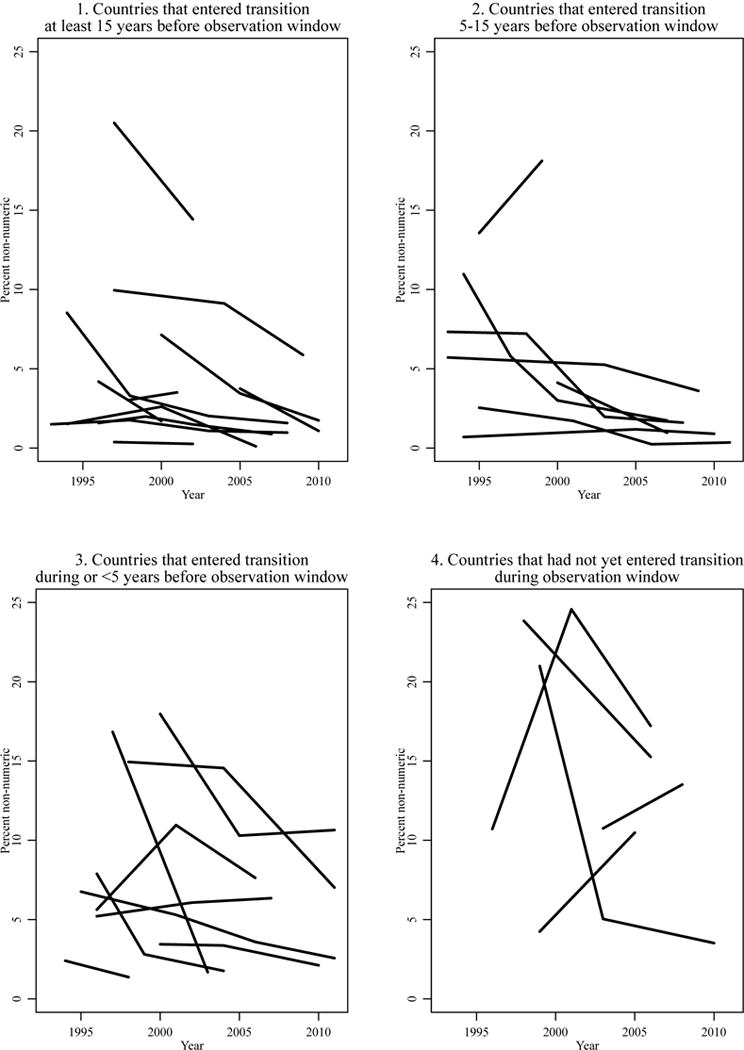
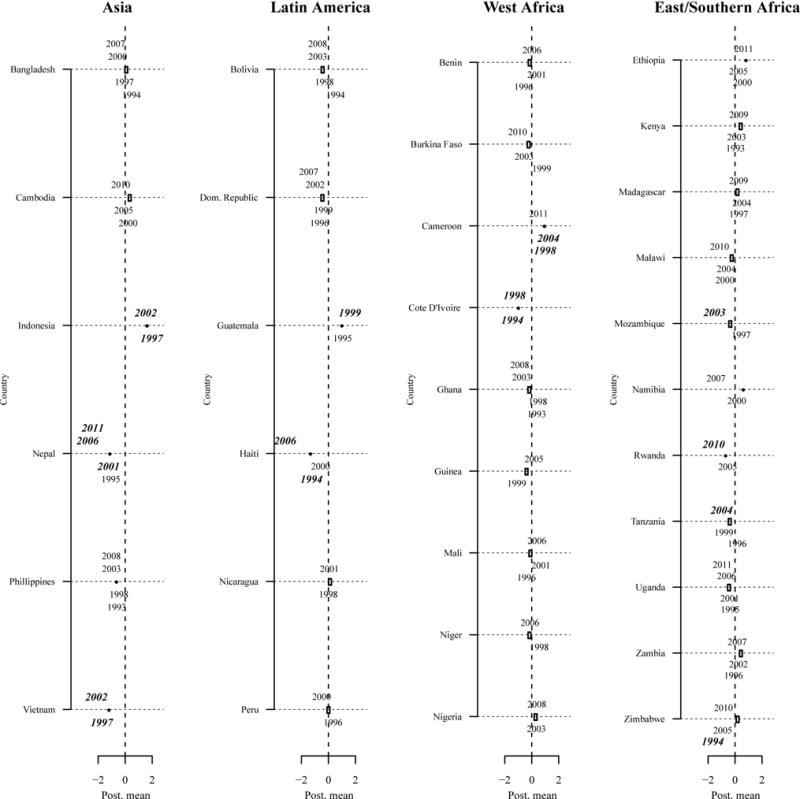
This paper examines the decline in non-numeric responses to questions about fertility preferences among women in the developing world. These types of response-such as 'don't know' or 'it's up to God'-have often been interpreted through the lens of fertility transition theory as an indication that reproduction has not yet entered women's 'calculus of conscious choice'. However, this has yet to be investigated cross-nationally and over time. Using 19 years of data from 32 countries, we find that non-numeric fertility preferences decline most substantially in the early stages of a country's fertility transition. Using country-specific and multilevel models, we explore the individual- and contextual-level characteristics associated with women's likelihood of providing a non-numeric response to questions about their fertility preferences. Non-numeric fertility preferences are influenced by a host of social factors, with educational attainment and knowledge of contraception being the most robust and consistent predictors.
Keywords: fertility preferences; fertility transitions; non-numeric responses.
Figures
Similar articles
-
FERTILITY TRANSITION IN SRI LANKA: IS IT A TEMPORARY PHENOMENON?J Biosoc Sci. 2017 Nov;49(S1):S116-S130. doi: 10.1017/S0021932017000384. J Biosoc Sci. 2017. PMID: 29160193
-
Analyzing the correlation between educational attainment and fertility.Chin J Popul Sci. 1995;7(2):135-48. Chin J Popul Sci. 1995. PMID: 12290015
-
Fertility preferences and subsequent childbearing in Africa and Asia: A synthesis of evidence from longitudinal studies in 28 populations.Popul Stud (Camb). 2020 Mar;74(1):1-21. doi: 10.1080/00324728.2019.1672880. Epub 2019 Nov 7. Popul Stud (Camb). 2020. PMID: 31694465
-
[World fertility and the women's situation].Renkou Yanjiu. 1983 Jul 29;(4):24-7. Renkou Yanjiu. 1983. PMID: 12313014 Chinese.
-
[Fertility trends and socioeconomic development in the Philippines].Demogr Inf. 1991:48-52, 154. Demogr Inf. 1991. PMID: 12343124 German.
Cited by
-
Pregnancy intention data completeness, quality and utility in population-based surveys: EN-INDEPTH study.Popul Health Metr. 2021 Feb 8;19(Suppl 1):6. doi: 10.1186/s12963-020-00227-y. Popul Health Metr. 2021. PMID: 33557851 Free PMC article.
-
The maximum contraceptive prevalence 'demand curve': guiding discussions on programmatic investments.Gates Open Res. 2017 Dec 22;1:15. doi: 10.12688/gatesopenres.12780.1. Gates Open Res. 2017. PMID: 29355228 Free PMC article.
-
Unrealized fertility among women in low and middle-income countries.PLoS One. 2022 Nov 4;17(11):e0276595. doi: 10.1371/journal.pone.0276595. eCollection 2022. PLoS One. 2022. PMID: 36331909 Free PMC article.
-
Educational differentials in the realisation of fertility intentions: Is sub-Saharan Africa different?PLoS One. 2019 Jul 18;14(7):e0219736. doi: 10.1371/journal.pone.0219736. eCollection 2019. PLoS One. 2019. PMID: 31318943 Free PMC article.
-
The Flexibility of Fertility Preferences in a Context of Uncertainty.Popul Dev Rev. 2018 Mar;44(1):87-116. doi: 10.1111/padr.12114. Epub 2017 Dec 20. Popul Dev Rev. 2018. PMID: 29695890 Free PMC article. No abstract available.
References
-
- Bankole A, Westoff C. The consistency and validity of reproductive attitudes: Evidence from Morocco. Journal of Biosocial Science. 1998;30(4):439–455. - PubMed
-
- Bärnighausen T, Bor J, Wandira-Kazibwe S, Canning D. Correcting HIV prevalence estimates for survey nonparticipation using Heckman-type selection models. Epidemiology. 2011;22(1):27–35. - PubMed
Publication types
MeSH terms
Grants and funding
LinkOut - more resources
Full Text Sources
Other Literature Sources