. 2017 Apr 25:7:46732.
doi: 10.1038/srep46732.

Quantitative diagnosis of breast tumors by morphometric classification of microenvironmental myoepithelial cells using a machine learning approach

Affiliations

Quantitative diagnosis of breast tumors by morphometric classification of microenvironmental myoepithelial cells using a machine learning approach

Yoichiro Yamamoto et al. Sci Rep. .

Abstract

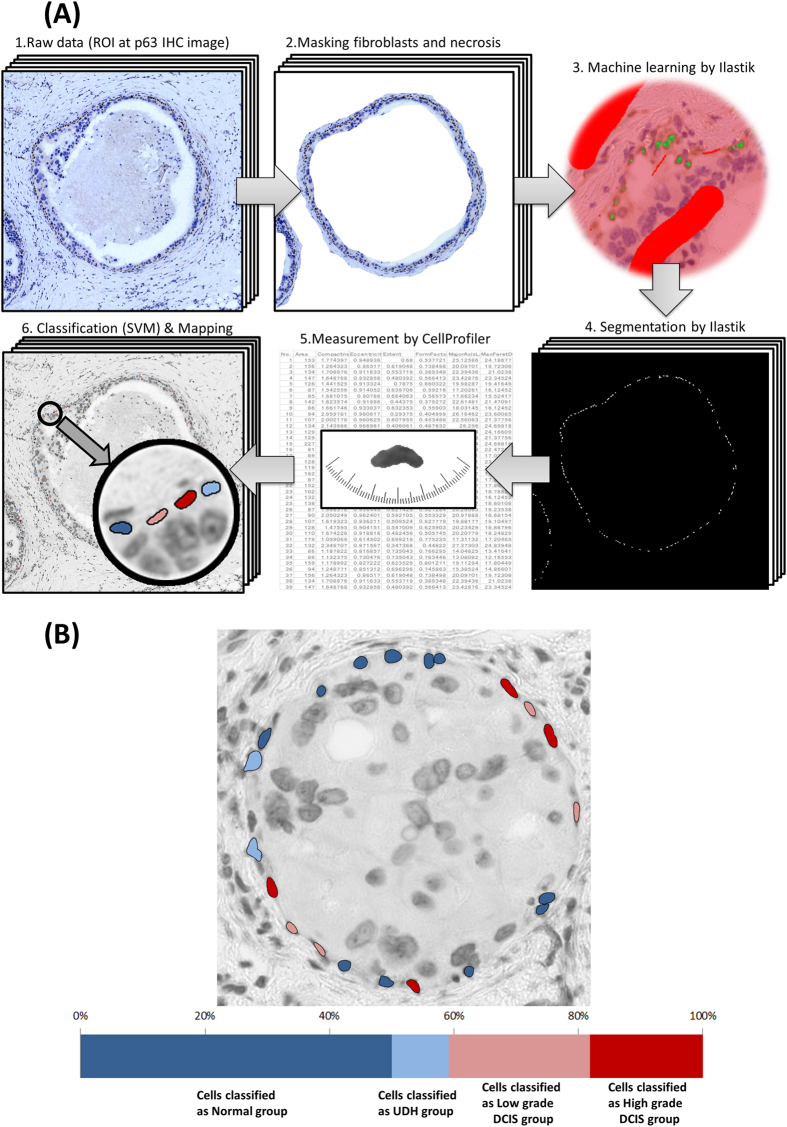
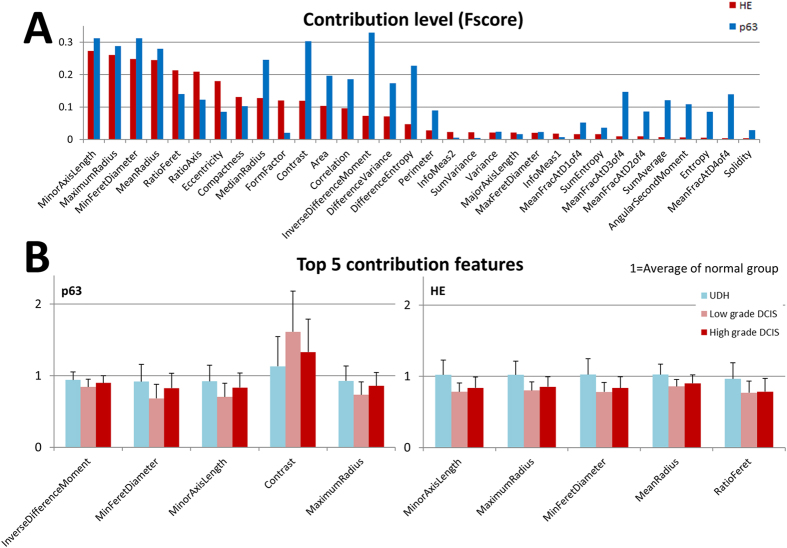
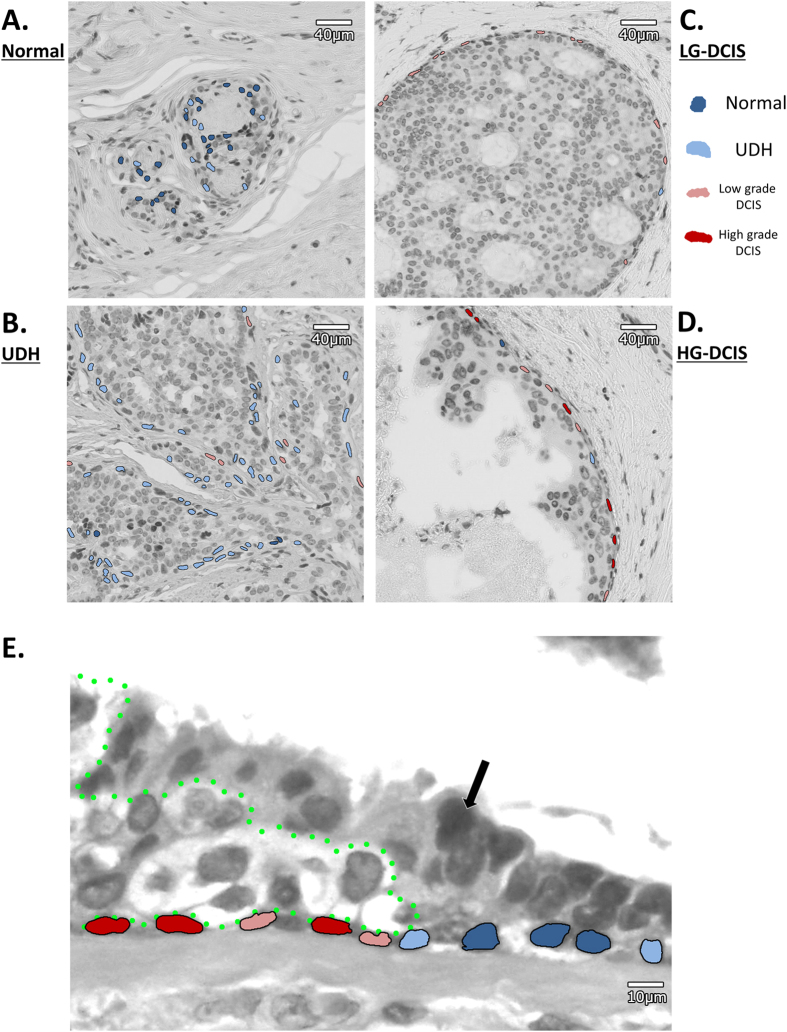
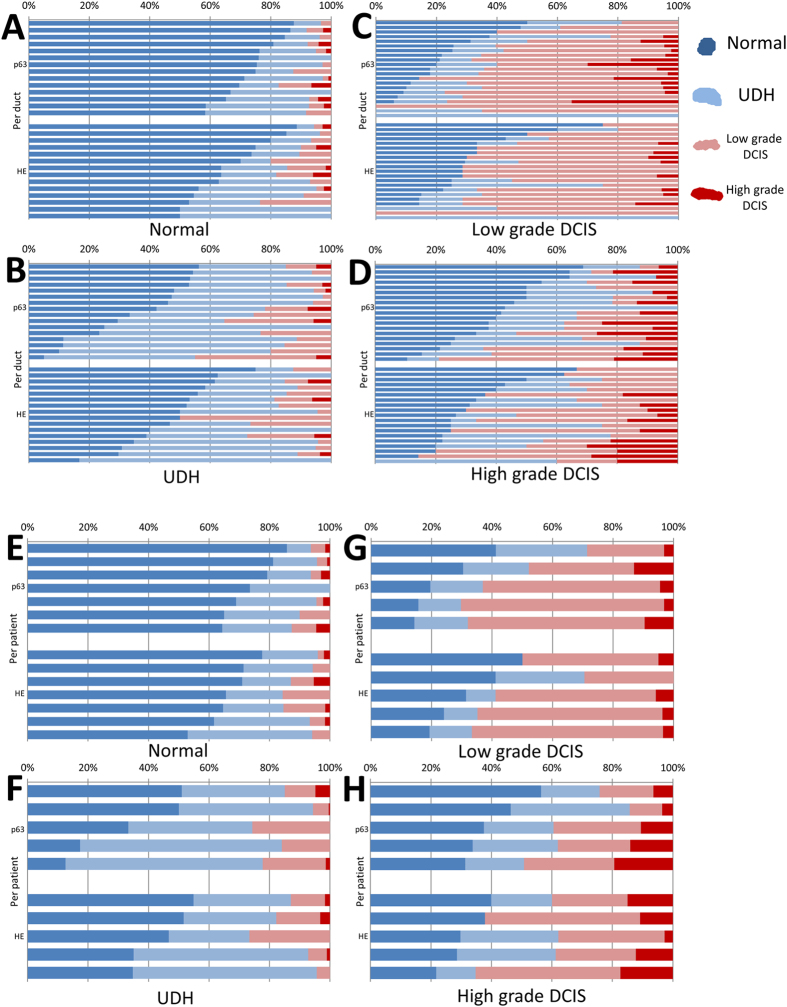
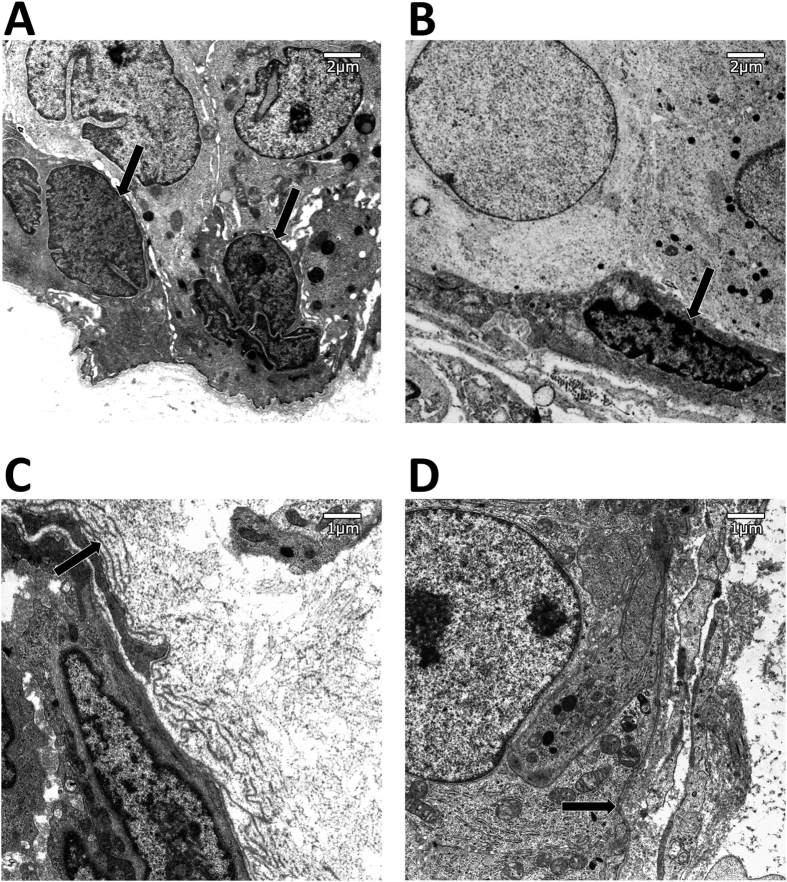
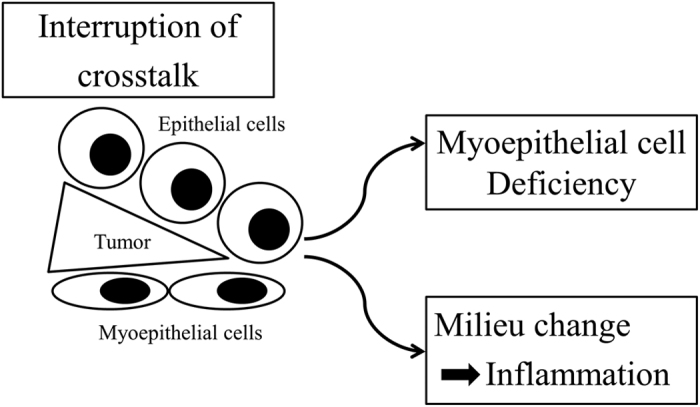
Machine learning systems have recently received increased attention for their broad applications in several fields. In this study, we show for the first time that histological types of breast tumors can be classified using subtle morphological differences of microenvironmental myoepithelial cell nuclei without any direct information about neoplastic tumor cells. We quantitatively measured 11661 nuclei on the four histological types: normal cases, usual ductal hyperplasia and low/high grade ductal carcinoma in situ (DCIS). Using a machine learning system, we succeeded in classifying the four histological types with 90.9% accuracy. Electron microscopy observations suggested that the activity of typical myoepithelial cells in DCIS was lowered. Through these observations as well as meta-analytic database analyses, we developed a paracrine cross-talk-based biological mechanism of DCIS progressing to invasive cancer. Our observations support novel approaches in clinical computational diagnostics as well as in therapy development against progression.


Conflict of interest statement

The authors declare no competing financial interests.

Figures

Figure 1
Figure 1
(A) Flowchart of image analysis on p63 immunohistochemistry images. 1 All slides were scanned by a whole slide image (WSI) scanner and a total of 70 ROIs were selected manually from p63 immunohistochemistry images. 2. To select only myoepithelial cell nuclei, we masked fibroblasts in interstitial tissue and inside the ducts as well as necrosis. 3. We applied Ilastik (segmentation software) to these ROIs. This is the training phase of machine learning for segmentation. 4. Segmentation by the trained Ilastik is applied to other images. 5. Each cell was measured using CellProfiler. 6. High dimensional morphological features of each cell were applied to machine learning, support vector machine (SVM). Based on the result of SVM classification, myoepithelial cell nuclei are drawn in different colors. (B) Example of heterogeneity of myoepithelial cells within a duct. Myoepithelial cells are marked by each histologic type based on classification of SVM: dark blue (myoepithelial cells classified as normal group), light blue (cells classified as UDH group), light red (cells classified as LG-DCIS group), dark red (cells classified as HG-DCIS group). A bar graph shows the proportion of each classified cell type in the duct.
Figure 2
Figure 2
(A) Contribution level of each morphological feature. The F-score denotes the discrimination power of each individual feature. Red bar: F-score on the HE stained image, blue bar: F-score on the p63 immunohistochemistry images. (B) Top 5 contribution features. Ratio of top 5 contribution feature’s average value with standard deviation (1 = Average of normal group). Light blue (cells classified as UDH group), light red (cells classified as LG-DCIS group), dark red (cells classified as HG-DCIS group).
Figure 3
Figure 3. Representative examples of heterogeneity mapping of myoepithelial cells.
(A) Normal area, (B) UDH area, (C) LG-DCIS area, (D) HG-DCIS area. (E) Edge area of DCIS. Neoplastic cells push through between normal luminal cells and myoepithelial cells. Black arrow: Normal epithelial cell. Cells surrounded by green dot line: neoplastic cells. Dark blue cells: myoepithelial cells classified as normal group, light blue cells: myoepithelial cells classified as UDH group, light red cells: myoepithelial cells classified as LG-DCIS group, dark red cells: myoepithelial cells classified as HG-DCIS group.
Figure 4
Figure 4. Heterogeneity analysis.
Proportion of myoepithelial cells marked as each histologic type based on SVM classification. (A) Normal group on duct level, (B) UDH group on duct level, (C) LG-DCIS group on duct level, (D) HG-DCIS on duct level, (E) Normal group on patient level, (F) UDH group on patient level, (G) LG-DCIS group on patient level, (H) HG-DCIS on patient level. Dark blue (myoepithelial cells classified as normal group), light blue (cells classified as UDH group), light red (cells classified as LG-DCIS group), dark red (cells classified as HG-DCIS group).
Figure 5
Figure 5. Electron micrograph of myoepithelial cell nucleus.
Myoepithelial cells in DCIS lesions have a flatter nucleus than in UDH. Arrow: Myoepithelial cell nucleus. (A) Myoepithelial cell nucleus in a benign case. (B) Myoepithelial cell nucleus in a DCIS case. Electron micrograph of basal lamina. In benign ducts, the basal lamina has multiple layers, while in DCIS it has a single layer. Arrow: Basal lamina. (C) Basal lamina in a benign lesion. (D) Basal lamina in a DCIS lesion.
Figure 6
Figure 6. DCIS progression model.
The spatial disruption of crosstalk between myoepithelial and epithelial cells through a wedge like protruding tongue of tumor cells, leads, in the case of SHH, towards myoepithelial cell deficiency and tumor cell dissemination, and, in the case of SLIT2, to a worsening of the local milieu, both having consequences for patient survival.

References

    1. Howlader N.,N. A., Krapcho M., Garshell J., Miller D., Altekruse S. F., Kosary C. L., Yu M., Ruhl J., Tatalovich Z., Mariotto A., Lewis D. R., Chen H. S., Feuer E. J., Cronin K. A. (eds). SEER Cancer Statistics Review. 1975–2011, (National Cancer Institute, Bethesda, MD, 2014).
    1. Ferlay J. et al. Cancer incidence and mortality patterns in Europe: estimates for 40 countries in 2012. European journal of cancer 49, 1374–1403 (2013). - PubMed
    1. Sanders M. E., Schuyler P. A., Dupont W. D. & Page D. L. The natural history of low-grade ductal carcinoma in situ of the breast in women treated by biopsy only revealed over 30 years of long-term follow-up. Cancer 103, 2481–2484 (2005). - PubMed
    1. Polyak K. & Hu M. Do myoepithelial cells hold the key for breast tumor progression? Journal of mammary gland biology and neoplasia 10, 231–247 (2005). - PubMed
    1. Allen M. D., Marshall J. F. & Jones J. L. alphavbeta6 Expression in Myoepithelial Cells: A Novel Marker for Predicting DCIS Progression with Therapeutic Potential. Cancer research 74, 5942–5947 (2014). - PubMed

Publication types