. 2017 Apr 25:8:15130.
doi: 10.1038/ncomms15130.

Gold nanoclusters-assisted delivery of NGF siRNA for effective treatment of pancreatic cancer

Affiliations

Gold nanoclusters-assisted delivery of NGF siRNA for effective treatment of pancreatic cancer

Yifeng Lei et al. Nat Commun. .

Abstract

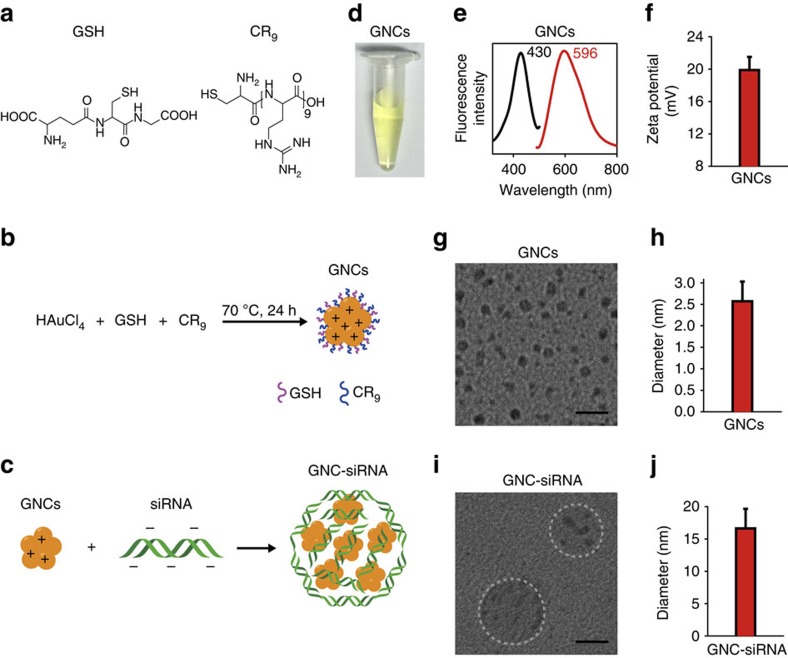
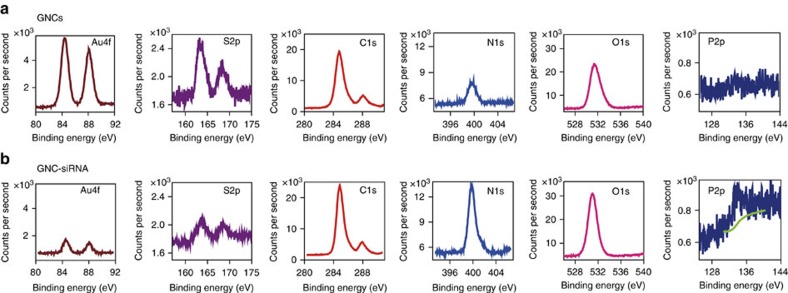
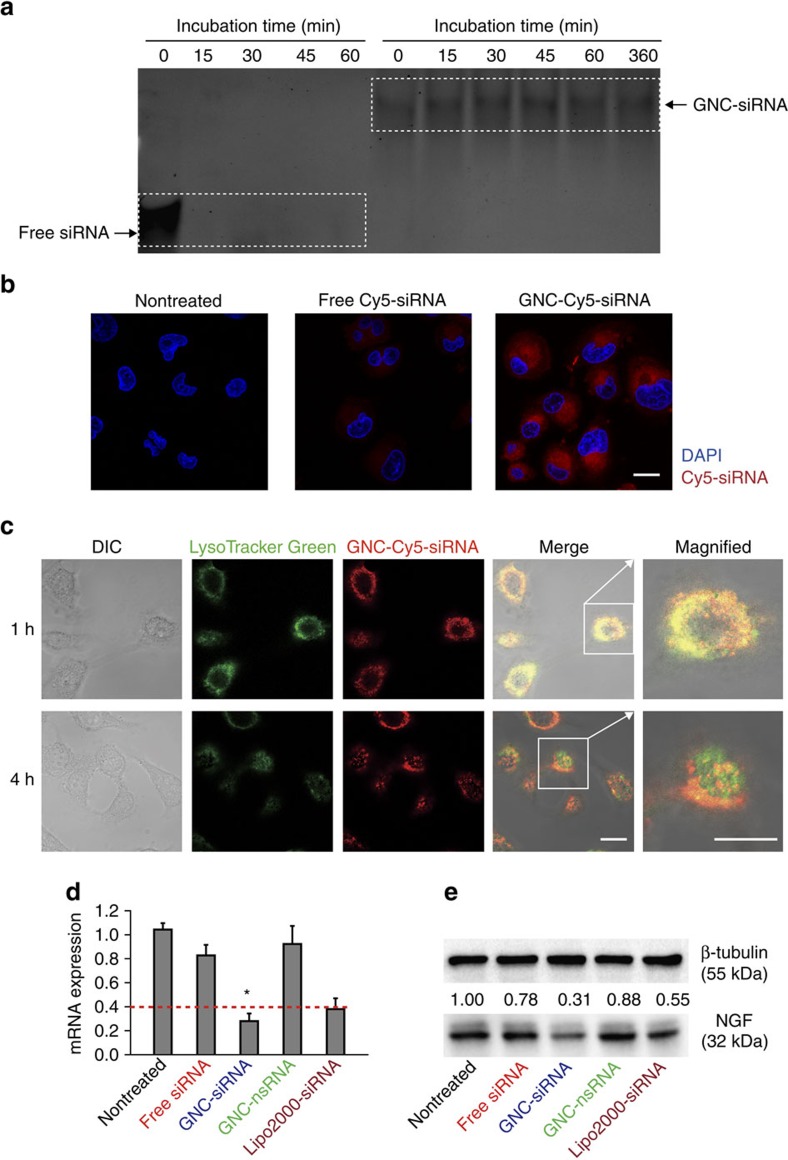
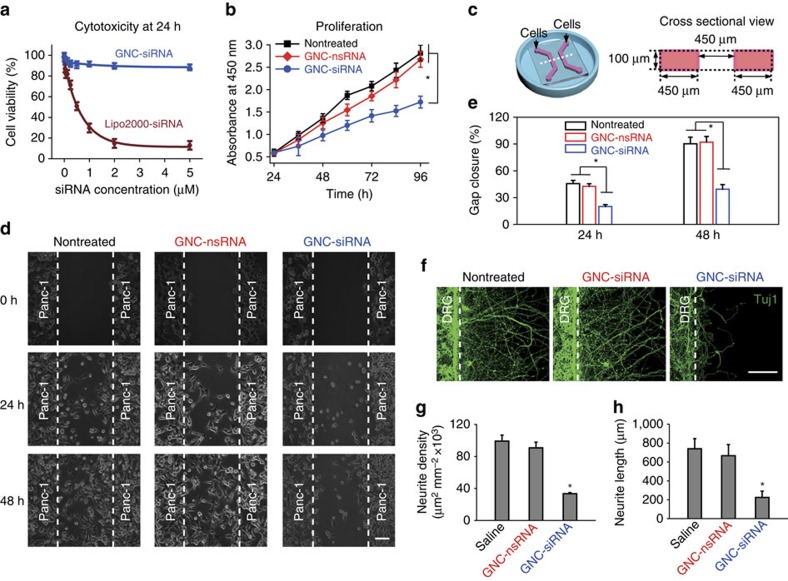
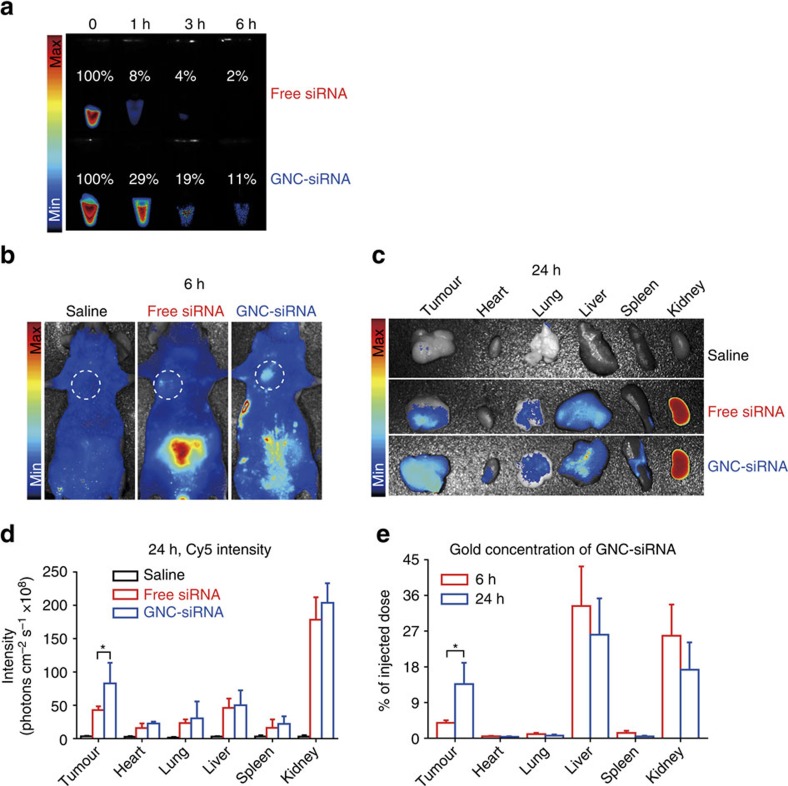
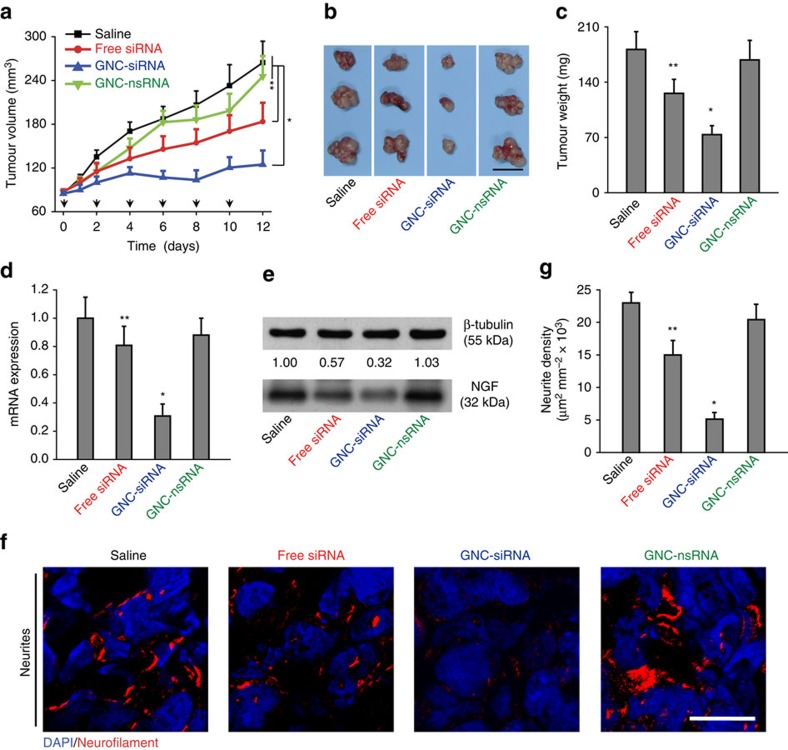
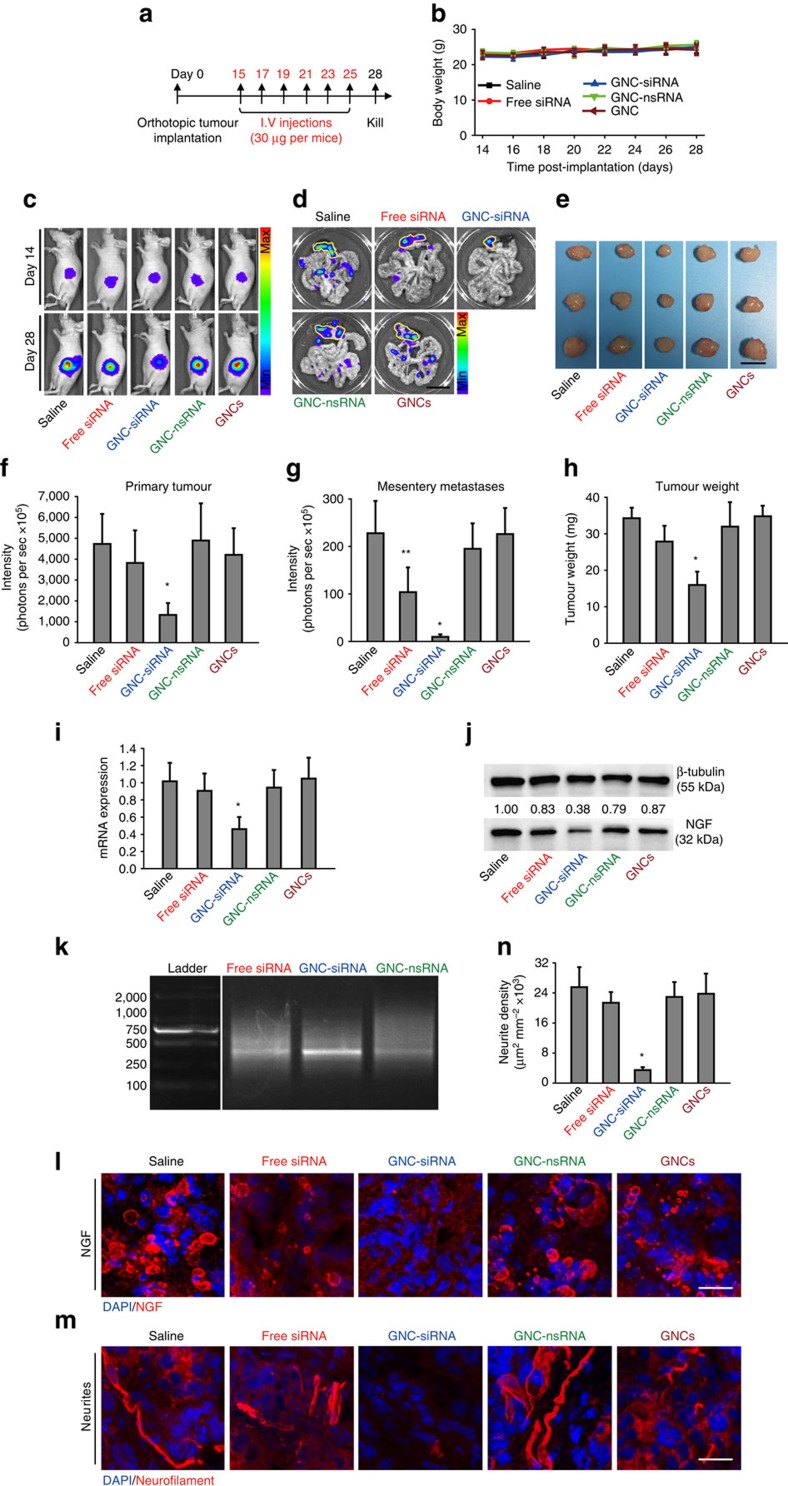
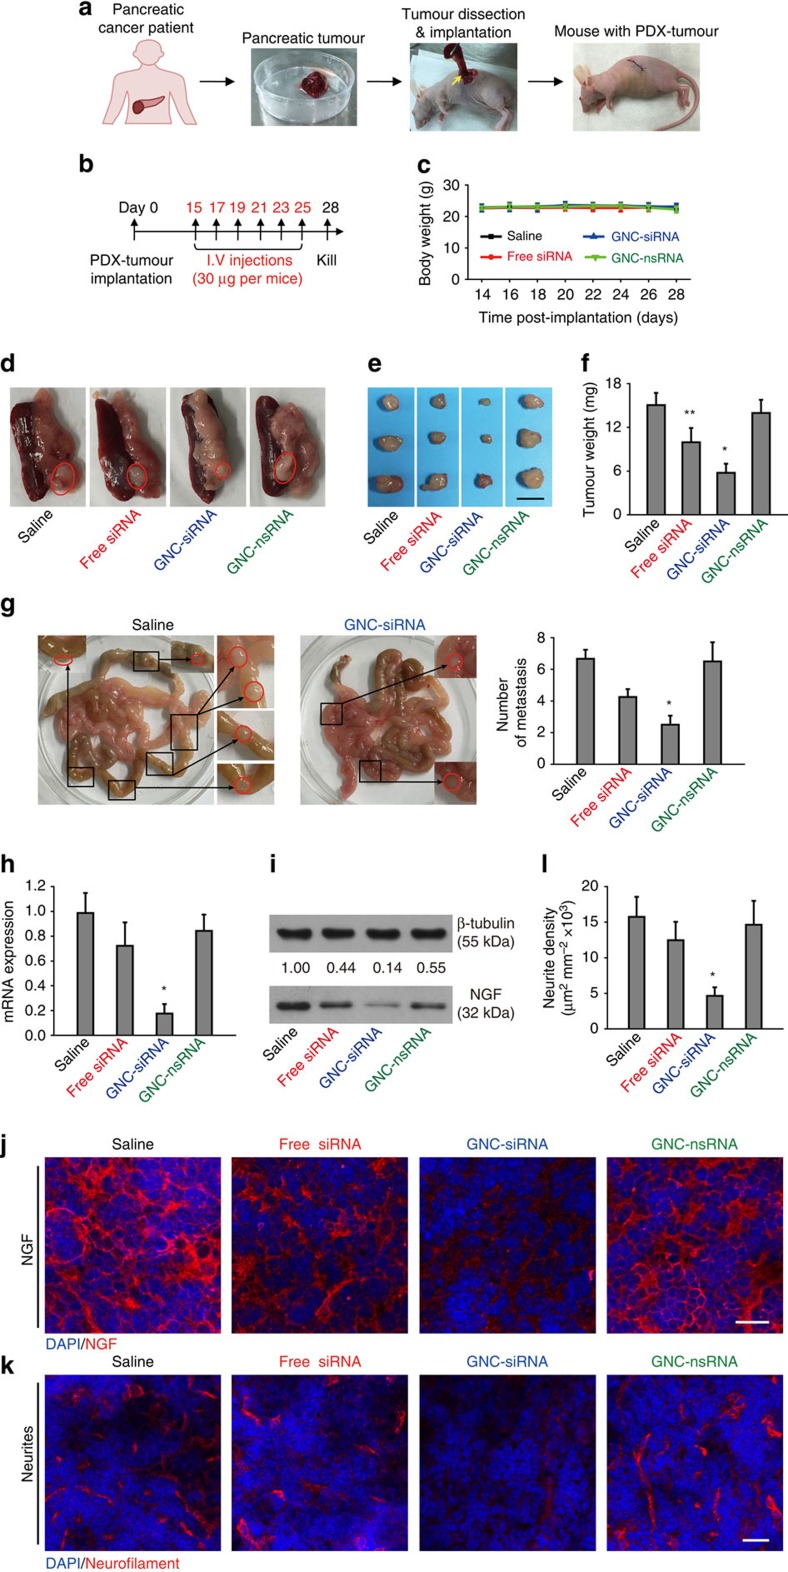
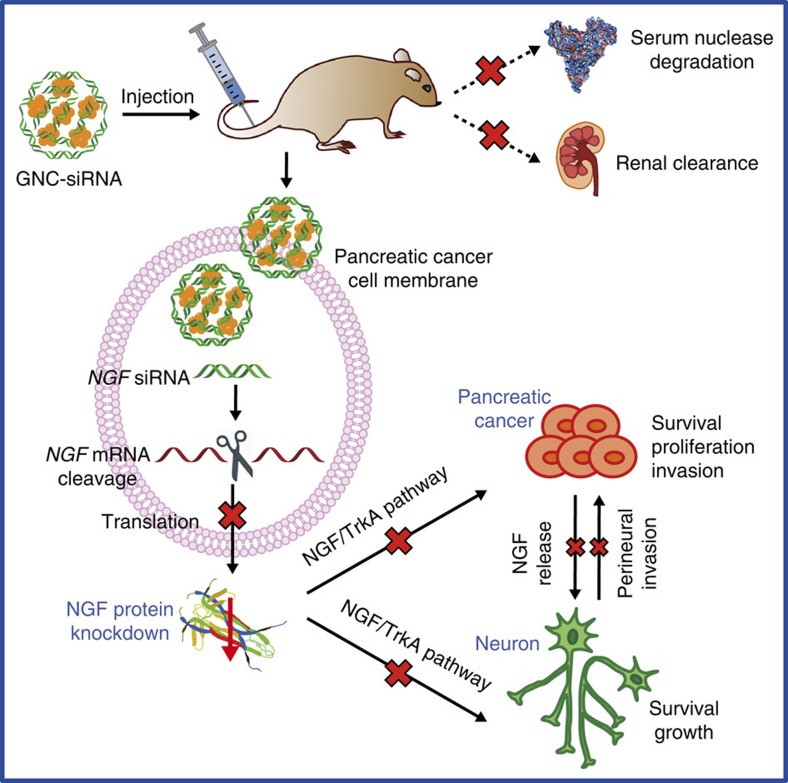
Pancreatic cancer is one of the deadliest human cancers, whose progression is highly dependent on the nervous microenvironment. The suppression of gene expression of nerve growth factor (NGF) may have great potential in pancreatic cancer treatment. Here we show that gold nanocluster-assisted delivery of siRNA of NGF (GNC-siRNA) allows efficient NGF gene silencing and pancreatic cancer treatment. The GNC-siRNA complex increases the stability of siRNA in serum, prolongs the circulation lifetime of siRNA in blood and enhances the cellular uptake and tumour accumulation of siRNA. The GNC-siRNA complex potently downregulates the NGF expression in Panc-1 cells and in pancreatic tumours, and effectively inhibits the tumour progression in three pancreatic tumour models (subcutaneous model, orthotopic model and patient-derived xenograft model) without adverse effects. Our study constitutes a straightforward but effective approach to inhibit pancreatic cancer via NGF knockdown, suggesting a promising therapeutic direction for pancreatic cancer.


Conflict of interest statement

The authors declare no competing financial interests.

Figures

Figure 1
Figure 1. Preparation and characteristics of GNC–siRNA complex.
(a) Molecular structure of GSH and CR9. (b) Scheme of the preparation of positively charged GNCs. (c) Scheme of the preparation of GNC–siRNA complex. The negatively charged siRNA was condensed onto cationic GNCs by electrostatic interaction. (d) The appearance of GNC solution. (e) Excitation and emission spectrum of GNCs. (f) Surface charge of GNCs. Mean±s.d. (n=16). (g) CryoTEM images of GNCs. (h) Diameter of the prepared GNCs. Mean±s.d. (n=120). (i) CryoTEM images of the GNC–siRNA complex. (j) Diameter of the GNC–siRNA complex. Mean±s.d. (n=30). Scale bars, 10 nm.
Figure 2
Figure 2. XPS analysis of GNCs and GNC–siRNA complex.
XPS spectra for the chemical element of gold (Au), sulfur (S), carbon (C), nitrogen (N), oxygen (O) and phosphor (P), respectively, on the surface of GNCs (a) and on the surface of GNC–siRNA complex (b).
Figure 3
Figure 3. Characterization of GNC–siRNA in vitro.
(a) Protection of siRNA against serum nucleases. Free siRNA and GNC–siRNA (100 nM siRNA) were incubated within 10% serum for multiple time points, and analysed by polyacrylamide gel electrophoresis. (b) Cellular uptake of free siRNA and GNC–siRNA into Panc-1 cells. siRNA was labelled with Cy5 dye (Cy5-siRNA), the Panc-1 cells were incubated with various Cy5-siRNA formulations for 1 h and observed by confocal microscope with a 633 nm laser excitation. Nuclei were counterstained with 4,6-diamidino-2-phenylindole (DAPI; blue). Scale bars, 20 μm. (c) Lysosomal escape of GNC–siRNA in Panc-1 cells. The lysosomes of cells were stained with LysoTracker Green for 1 h, and the Panc-1 cells were treated with GNC–Cy5-siRNA for 1 h. The cells were observed by confocal microscope over different time points. Scale bars, 20 μm. (d) Expression level of NGF mRNA in Panc-1 cells analysed by RT–PCR, the dotted line referred to the expression level of NGF mRNA in Panc-1 cells transfected with commercially available Lipofectamine 2000 transfection agent (Lipo2000-siRNA), which served as a positive control. Mean±s.d. (n=3). *P<0.01 compared with the nontreated control; Student's t-test. (e) Expression level of NGF protein in Panc-1 cells evaluated by western blotting. GNC binding with nsRNA was labelled as GNC–nsRNA and served as control siRNA.
Figure 4
Figure 4. The effect of GNC–siRNA complex on cells in vitro.
(a) Viability of Panc-1 cells after 24 h incubation of GNC–siRNA versus the identical siRNA concentration coupled with Lipofectamine 2000 transfection agent (Lipo2000-siRNA). Mean±s.d. (n=3). (b) Cells were pre-incubated with GNC–siRNA or GNC–nsRNA (100 nM siRNA equivalent) for 24 h. Then the proliferation of Panc-1 cells within 3 days was evaluated by CCK-8 assay. Mean±s.d. (n=3). (c) Scheme of the microfluidic chip for cell co-culture, the right panel is the cross-sectional view of the chip. (d) On-chip migration assay of Panc-1 cells, which were pretreated with GNC–siRNA or GNC–nsRNA for 48 h (100 nM siRNA equivalents). The Panc-1 cells were seeded and adhered in the channels for 6 h, then the polydimethylsiloxane (PDMS) cover were peeled off (t=0 h) and the migration of Panc-1 cells was monitored by microscope. Scale bars, 100 μm. (e) Extent of gap closure (%) at 24 and 48 h, respectively. The quantification was conducted from at least 10 fields for each condition (mean±s.d.). (f) On-chip co-culture of DRG neurons and Panc-1 cells to assess the neurite sprouting. The Panc-1 cells were pretreated with GNC–siRNA or GNC–nsRNA for 48 h (100 nM siRNA). The DRG neurons and Panc-1 cells were seeded into the left and right channels of the chips, and adhered for 6 h before the removal of the cover. The neurite sprouting of DRG neurons from the neuron channel was evaluated. Neurites were stained with Tuj1 antibody and observed by confocal microscope. Scale bars, 100 μm. (g) Density of DRG neurite sprouting in the microfluidic chips. Mean±s.d. (n=5). (h) Average length of DRG neurite sprouting in the microfluidic chips. Mean±s.d. (n=12). Significant difference was from the nontreated control. *P<0.01 compared with the nontreated control; Student's t-test.
Figure 5
Figure 5. The circulation time and tumour targeting of GNC–siRNA complex in vivo.
(a) The circulation time of free siRNA and GNC–siRNA complex in blood. Cy5 dye-labelled siRNA (Cy5-siRNA) was used for visualization. Blood was drawn from mice after tail vein injection with various Cy5-siRNA formulations (30 μg Cy5-siRNA per mouse equivalent) at different time and imaged under a fluorescence imaging system. The fluorescence intensity of 0 h in each group was normalized as 100%. (b) In vivo tumour targeting. Balb/c nude mice with subcutaneous Panc-1 tumours were injected with different Cy5-siRNA formulations (30 μg Cy5-siRNA per mouse equivalent) via tail vein. After 6 h, fluorescence images of the mice were acquired with in vivo fluorescence imaging system, the white circles indicated the regions of subcutaneous tumours. (c) Tumour targeting by ex vivo imaging. After 24 h of Cy5-siRNA injection, major organs and tumours were isolated from mice for ex vivo fluorescence imaging. (d) The fluorescence intensity of Cy5-siRNA in major organs and tumours at 24 h after intravenous injection. *P<0.01 compared with free siRNA. (e) The concentration of gold in the major organs and tumours (expressed as % of given dose) at 6 and 24 h post injection of GNC–siRNA complex by ICP-MS. Fluorescence images and ICP-MS analysis confirmed the accumulation of GNC–siRNA complex into the tumour sites. Mean±s.d. (n=4). *P<0.01; Student's t-test.
Figure 6
Figure 6. The antitumour and gene knockdown effects of GNC–siRNA complex in subcutaneous pancreatic tumours.
Panc-1 cells were injected into the flank of Balb/c nude mice to form subcutaneous tumours. When the tumours reached about 5 mm in diameter, the animals received peritumoral injections of various formulations every 2 days for six injections. (a) Tumour growth curve during the treatments. The black arrows indicated the days of injection. (b) Ex vivo tumour image and (c) tumour weight at the end of experiment. Scale bar, 1 cm. (d) Expression level of NGF mRNA and (e) NGF protein level in subcutaneous tumours. (f) IF staining of neurites in tumour tissues with various siRNA treatments. Neurites were stained with neurofilament antibody (red), the cell nuclei were stained with 4,6-diamidino-2-phenylindole (DAPI; blue). Scale bars, 20 μm. (g) Quantification of neurite density in the subcutaneous tumours by counting the neurite area positive to neurofilament antibody per unit area. Mean±s.d. (n=6 per group). Significant difference was from the saline control, *P<0.01, **0.01<P<0.05; Student's t-test.
Figure 7
Figure 7. The antitumour and gene knockdown effects of GNC–siRNA complex in orthotopic tumours.
(a) Scheme of siRNA treatment. Panc-1-luc cells were injected into the pancreas head of Balb/c nude mice to form orthotopic tumours. After 2 weeks, mice were divided into different groups. Mice received various formulations via tail veil injections for six times, and killed on day 28. (b) The changes of the mouse body weight during treatments. (c) In vivo whole-body bioluminescence images of mice on day 14 and day 28, which indicated the tumour size before and after siRNA treatment. Bioluminescence signal was a result from the interaction of luciferase from Panc-1-luc cells with D-luciferin injected into the mice before imaging. (d) Ex vivo bioluminescence images of orthotopic pancreatic tumours and tumour metastases into mesenteries on day 28. Yellow lines enclosed the locations of primary tumours in the pancreas. Scale bar, 1 cm. (e) Tumour images on day 28. Scale bar, 5 mm. (f) Quantification of in vivo bioluminescence to evaluate the primary tumours in mice on day 28. (g) Quantification of tumour metastases by the sum of ex vivo bioluminescence detected in the mesenteries on day 28. (h) Weight of the isolated tumours. (i) NGF mRNA and (j) NGF protein expression levels in orthotopic tumours. (k) Confirmation of RNAi-mediated mechanism of action with GNC–siRNA by 5′-RACE assay. A 2% agarose gel electrophotosis showed ∼370 bp RNA-induced silencing complex-mediated cleavage product for NGF siRNA in pancreatic tumours. Only tumours treated with GNC–siRNA complex showed the cleavage product at 370 bp. The left column was the DNA ladder with described molecular weights. (l) IF images of NGF protein (red) in the orthotopic tumours. (m) IF images of neurites (red) in the orthotopic tumours. The cell nuclei were stained with 4,6-diamidino-2-phenylindole (DAPI; blue). Scale bars, 20 μm. (n) Quantification of the neurite density in the orthotopic tumours. Mean±s.d. (n=6–9 per group). Significant difference was from the saline control, *P<0.01, **0.01<P<0.05; Student's t-test.
Figure 8
Figure 8. The antitumour and gene knockdown effects of GNC–siRNA complex in orthotopic pancreatic PDX tumours.
(a) Scheme of the establishment of PDX tumour model. Patient-derived pancreatic tumours were trimmed, cut into fragments with similar sizes and transplanted into the pancreas head of the Balb/c nude mice. (b) Scheme of siRNA treatments. Two weeks after PDX tumour transplantation, mice were randomly divided into different groups and injected with various siRNA formulations through tail veil for six injections. The mice were killed on day 28. (c) The effect of different siRNA treatments on the changes of mouse body weight. (d) Representative images of the orthotopic PDX tumours in pancreas with associated spleen on day 28, tumours were indicated in red circles. (e) Tumour images and (f) tumour weight measured on day 28. Scale bar, 5 mm. (g) Representative images and quantification of tumour metastases into mesenteries. Tumour metastases were magnified and indicated by red circles. (h) NGF mRNA and (i) NGF protein level in the PDX tumours. (j) Representative images of the IF staining of NGF protein (red) in the PDX tumours. (k) Images of IF staining of neurites in PDX tumours. Neurites were stained with neurofilament antibody (red). The cell nuclei were stained with 4,6-diamidino-2-phenylindole (DAPI; blue). Scale bars, 20 μm. (l) Quantification of neurite density in the PDX tumours. Mean±s.d. (n=5–6 per group). Significant difference was from the saline control, *P<0.01, **0.01<P<0.05; Student's t-test.
Figure 9
Figure 9. Delivery mechanism of GNC–siRNA complex for NGF silencing and pancreatic cancer therapy.
The GNC–siRNA complex protects the NGF siRNA from serum nuclease degradation and renal clearance, enhances the accumulation of NGF siRNA to tumour cells, which allows efficient NGF silencing in pancreatic tumours. The downregulated NGF expression inhibits the pancreatic cancer progression and neurogenesis in pancreatic tumour microenvironment.

References

    1. Stathis A. & Moore M. J. Advanced pancreatic carcinoma: current treatment and future challenges. Nat. Rev. Clin. Oncol. 7, 163–172 (2010). - PubMed
    1. Magnon C. et al.. Autonomic nerve development contributes to prostate cancer progression. Science 341, 1236361 (2013). - PubMed
    1. Zhao C. M. et al.. Denervation suppresses gastric tumorigenesis. Sci. Transl. Med. 6, 250ra115 (2014). - PMC - PubMed
    1. Scanlon C. S. et al.. Galanin modulates the neural niche to favour perineural invasion in head and neck cancer. Nat. Commun. 6, 6885 (2015). - PMC - PubMed
    1. Venkatesh H. S. et al.. Neuronal activity promotes glioma growth through neuroligin-3 secretion. Cell 161, 803–816 (2015). - PMC - PubMed

Publication types

MeSH terms