Clinical Trial
. 2017 Apr 25:7:46560.
doi: 10.1038/srep46560.

The peripheral blood proteome signature of idiopathic pulmonary fibrosis is distinct from normal and is associated with novel immunological processes

Affiliations
Clinical Trial

The peripheral blood proteome signature of idiopathic pulmonary fibrosis is distinct from normal and is associated with novel immunological processes

David N O'Dwyer et al. Sci Rep. .

Erratum in

Abstract

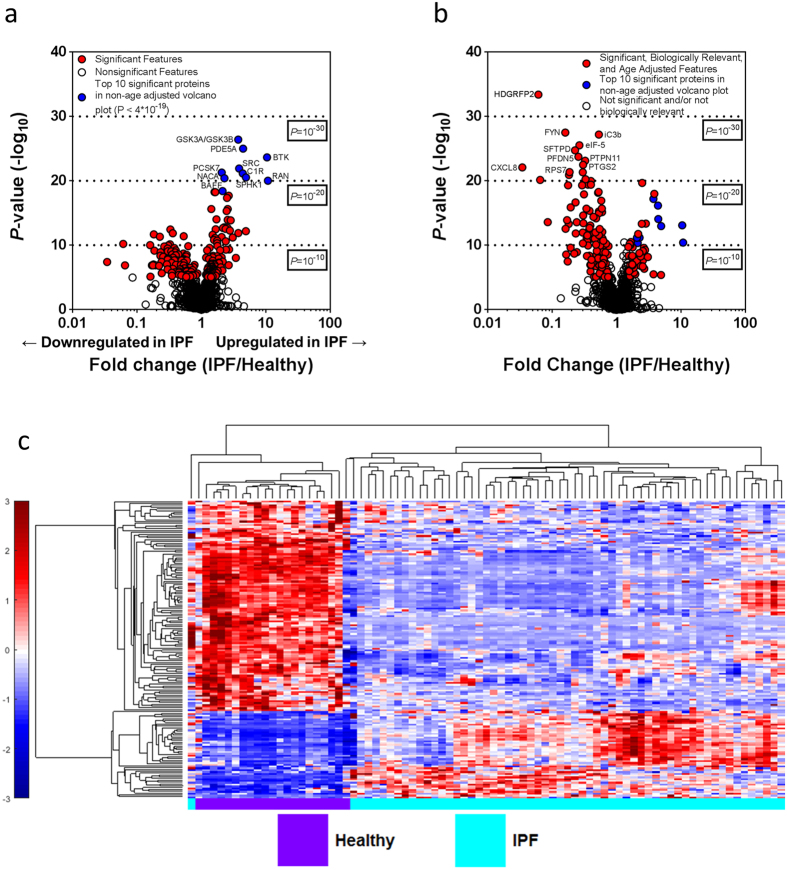
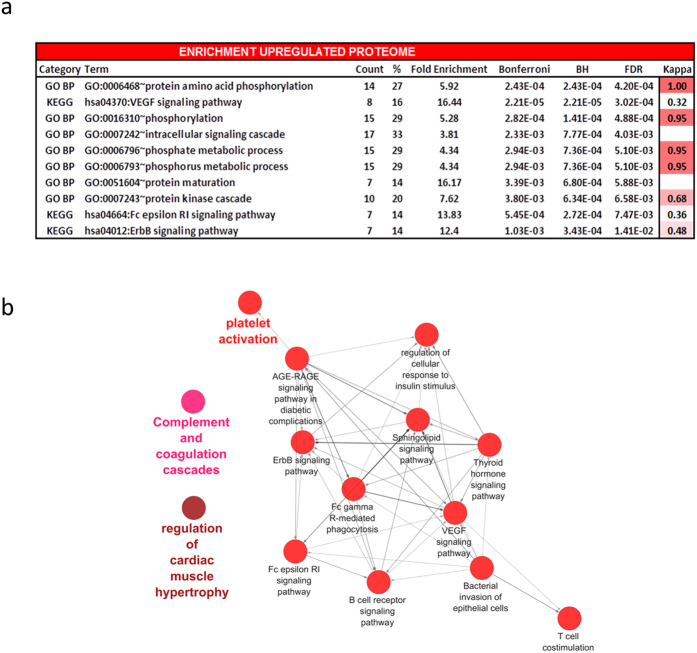
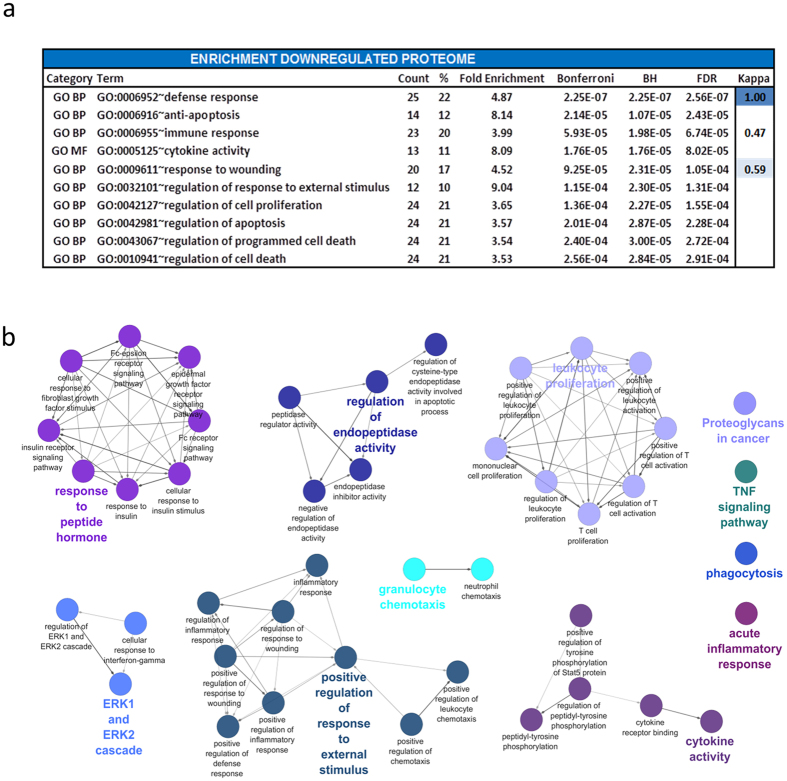
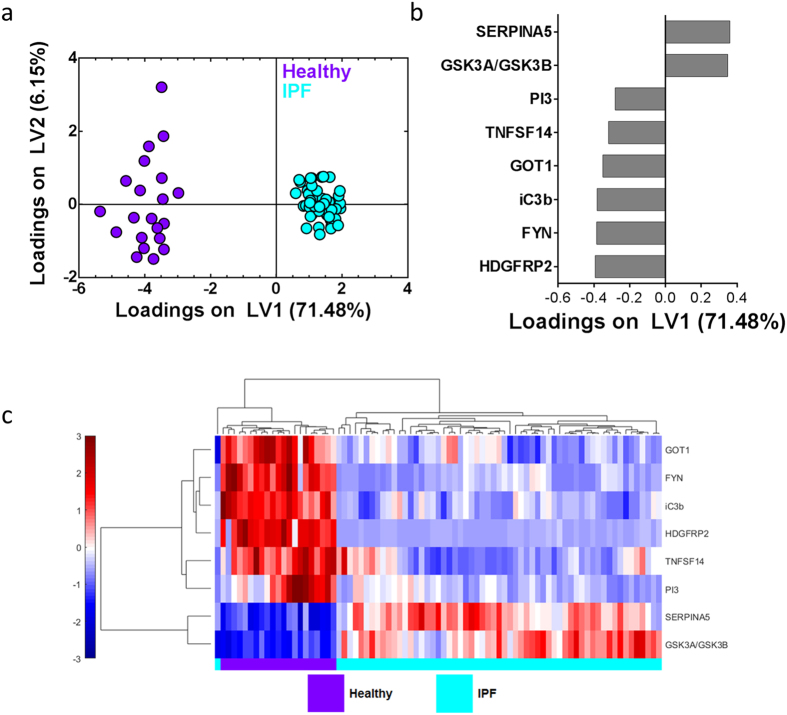
Idiopathic pulmonary fibrosis (IPF) is a progressive and fatal interstitial pneumonia. The disease pathophysiology is poorly understood and the etiology remains unclear. Recent advances have generated new therapies and improved knowledge of the natural history of IPF. These gains have been brokered by advances in technology and improved insight into the role of various genes in mediating disease, but gene expression and protein levels do not always correlate. Thus, in this paper we apply a novel large scale high throughput aptamer approach to identify more than 1100 proteins in the peripheral blood of well-characterized IPF patients and normal volunteers. We use systems biology approaches to identify a unique IPF proteome signature and give insight into biological processes driving IPF. We found IPF plasma to be altered and enriched for proteins involved in defense response, wound healing and protein phosphorylation when compared to normal human plasma. Analysis also revealed a minimal protein signature that differentiated IPF patients from normal controls, which may allow for accurate diagnosis of IPF based on easily-accessible peripheral blood. This report introduces large scale unbiased protein discovery analysis to IPF and describes distinct biological processes that further inform disease biology.


Conflict of interest statement

The authors declare no competing financial interests.

Figures

Figure 1
Figure 1. The peripheral plasma in IPF is distinct from normal controls.
(a) Volcano plots highlighting fold change (x axis) and the significance level on the y axis of the blood proteins measured in the SOMAmer Aptamer assay in the COMET study. Points in red indicate proteins that are significantly different in the healthy versus IPF patients when correcting for multiple comparisons using the Bonferroni method with a corrected P-value of 0.01. Points in blue are the top ten most significant proteins when age is not considered. (b) Volcano plot with age adjustment. Points in red indicate proteins that are significantly different between healthy and IPF patients when adjusted for the age difference between the two groups and when correcting for multiple comparisons using the Bonferroni method with a corrected P-value of 0.01. The points in blue are the same as in panel “a”. (c) Hierarchical clustering of age-adjusted blood proteins that were determined to be significantly different and biologically relevant between healthy and IPF patients shows visually distinct blood proteomes between healthy and IPF patients. With the exception of two individuals, this protein signature in the blood was able to perfectly differentiate between healthy and IPF patients. The abundance of each protein is shown in color, with red meaning overabundant proteins, white unchanged, and blue being underabundant proteins, all compared to the mean (color bar scale is to the left of figure). Hierarchical clustering of proteins was generated by unsupervised average linkage using Pearson’s correlation as the distance metric.
Figure 2
Figure 2. Enrichment and network analysis of the upregulated IPF plasma proteome.
(a) DAVID enrichment analysis was employed to select the most significantly enriched terms within the sample of upregulated proteins (n = 48). Bonferroni corrected P value, Benjamini-Hochberg (BH) P value and False Discovery Rates (FDR) are reported. Kappa statistics reporting similarity to most significant term (low > 0.25, moderate 0.25–0.5, high 0.5–0.75, very high 0.75–1). (b) ClueGO visualization and analysis of biological role (GO, Kegg pathways) was undertaken. GO terms are mapped in clusters by Kappa statistics. [Hexagon = Kegg pathway, Ellipse = Gene ontology term, arrow depicts direction of association].The major overview term (smallest P value within cluster) is depicted in color. Node size depicts Bonferroni corrected P value < 0.0005 for all terms reported. Further details can be found in online supplement.
Figure 3
Figure 3. Enrichment and network analysis of the downregulated IPF plasma proteome.
(a) DAVID enrichment analysis was employed to select the most significantly enriched terms within the sample of downregulated proteins (n = 116). Bonferroni corrected P value, BH P value and FDRs are reported. Kappa statistics reporting similarity to most significant term (low > 0.25, moderate 0.25–0.5, high 0.5–0.75, very high 0.75–1). (b) ClueGO visualization and analysis of biological role (GO, Kegg pathways) was undertaken. GO terms are mapped in clusters by Kappa statistics. [Hexagon = Kegg pathway, Ellipse = Gene ontology term, arrow depicts direction of association].The major overview term (smallest P value within cluster) is depicted in color. Node size depicts Bonferroni corrected P value < 0.0005 for all terms reported. Further details can be found in online supplement.
Figure 4
Figure 4. LASSO/PLSDA identified a minimum protein signature of 8 age-adjusted proteins that best differentiated healthy and IPF patients.
(a) LASSO identified an 8-protein signature that differentiated healthy (purple) and IPF (cyan) patients, with 100% calibration accuracy and 100% cross-validation accuracy, with 100% sensitivity and specificity for both healthy and IPF patients. Latent variable 1 (LV1) accounted for 71.48% of the variance in the data, and latent variable 2 (LV2) accounted for 6.15% of the variance in the data. (b) The loadings plot indicates protein contributions to the LASSO-identified signature, with positive loadings positively associated with IPF, and negative loadings comparatively reduced in IPF. (c) Hierarchical clustering further emphasizes the visual difference between healthy and IPF patients based on the LASSO-identified signature. Abundance of each protein is shown in color, with red indicating overabundance, white unchanged, and blue indicating underabundant proteins compared to the mean. Color bar scale is to the left of figure.

References

    1. Raghu G. et al.. An official ats/ers/jrs/alat statement: Idiopathic pulmonary fibrosis: Evidence-based guidelines for diagnosis and management. Am J Respir Crit Care Med 183, 788–824, doi: 10.1164/rccm.2009-040GL (2011). - DOI - PMC - PubMed
    1. King T. E. Jr. et al.. A phase 3 trial of pirfenidone in patients with idiopathic pulmonary fibrosis. N Engl J Med 370, 2083–2092, doi: 10.1056/NEJMoa1402582 (2014). - DOI - PubMed
    1. Richeldi L. et al.. Efficacy and safety of nintedanib in idiopathic pulmonary fibrosis. N Engl J Med 370, 2071–2082, doi: 10.1056/NEJMoa1402584 (2014). - DOI - PubMed
    1. Ley B., Brown K. K. & Collard H. R. Molecular biomarkers in idiopathic pulmonary fibrosis. Am J Physiol Lung Cell Mol Physiol 307, L681–691, doi: 10.1152/ajplung.00014.2014 (2014). - DOI - PMC - PubMed
    1. Martinez F. J. et al.. The clinical course of patients with idiopathic pulmonary fibrosis. Ann Intern Med 142, 963–967 (2005). - PubMed

Publication types