. 2017 Apr 25:7:46684.
doi: 10.1038/srep46684.

Live cell imaging of mitochondria following targeted irradiation in situ reveals rapid and highly localized loss of membrane potential

Affiliations

Live cell imaging of mitochondria following targeted irradiation in situ reveals rapid and highly localized loss of membrane potential

Dietrich W M Walsh et al. Sci Rep. .

Abstract

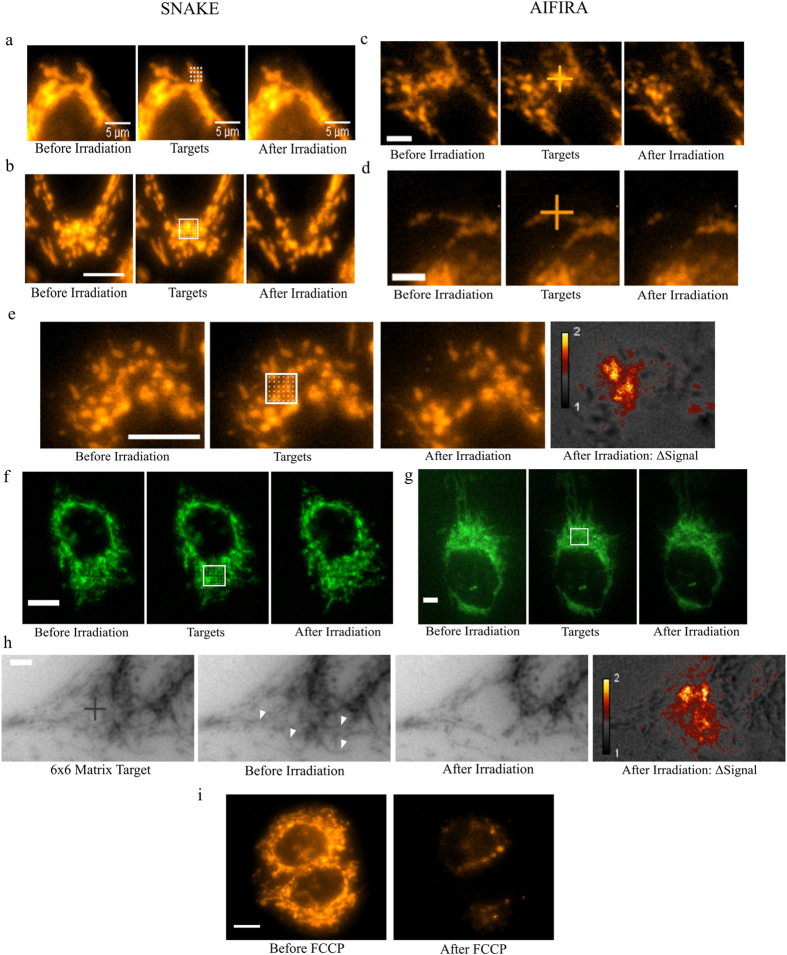
The reliance of all cell types on the mitochondrial function for survival makes mitochondria an interesting target when trying to understand their role in the cellular response to ionizing radiation. By harnessing highly focused carbon ions and protons using microbeams, we have performed in situ live cell imaging of the targeted irradiation of individual mitochondria stained with Tetramethyl rhodamine ethyl ester (TMRE), a cationic fluorophore which accumulates electrophoretically in polarized mitochondria. Targeted irradiation with both carbon ions and protons down to beam spots of <1 μm induced a near instant loss of mitochondrial TMRE fluorescence signal in the targeted area. The loss of TMRE after targeted irradiation represents a radiation induced change in mitochondrial membrane potential. This is the first time such mitochondrial responses have been documented in situ after targeted microbeam irradiation. The methods developed and the results obtained have the ability to shed new light on not just mitochondria's response to radiation but to further elucidate a putative mechanism of radiation induced depolarization and mitochondrial response.


Conflict of interest statement

The authors declare no competing financial interests.

Figures

Figure 1
Figure 1
Micrographs of irradiated MCF7 and A549 cells from experiments at SNAKE (a,b,e) and AIFIRA (c,d,g,h); unless specifically stated scale bars represent 10 μm. Successive images (left to right) show pre-irradiation, target placement on pre-irradiation image and post irradiation. (a,b) TMRE stained cells irradiated with 100 carbon ions per point show mitochondrial depolarization (localized loss of signal) of targeted and consequently irradiated mitochondria with 4 × 4 irradiation points for MCF7 (a), 6 × 6 points with A549 (b). (e) Targeted irradiation performed at SNAKE. Images show pre and post irradiation with 6 × 6 matrix and 100 carbon ions per point. The pseudocolour images (e,h) depict the changes in signal between pre and post irradiation. Before images were divided by after images to obtain a 32 bit float image, the changes were represented in a pseudocolour look up table (Smart, Fiji). A value of 1 (gray) equates to no difference between before and after and a value of up to 2 (yellow) equates to a drop in signal intensity. (f) MTG stained cells do not show localized loss of signal after irradiation with 100 carbon ions per point. (c,d) Experiments performed at AIFIRA show the same loss of TMRE after irradiation with an equivalent number of protons. (g) HTB U2OS mito-RoGFP2 tagged cells irradiated with 3 × 3 target matrix do not show any change of mitochondria staining after irradiation with 6800 protons per point (equivalent to 200 carbon ions). (h) Inverted greyscale representation used to depict the irradiation (6 × 6 point matrix) and depolarization of a whole interconnected network of mitochondria up to 18 μm away from the irradiation site. Pseudocolour image (ΔSignal) represents change in signal between before and after irradiation. (i) Control experiment depicting mitochondria stained with TMRE before treatment with 1 μM FCCP and 10 s after. Images depict the loss of specific, TMRE signal after uncoupling of mitochondrial membrane potential and are comparable to that induced by irradiation induced damage.
Figure 2
Figure 2. Quantification of TMRE signal before and after irradiation with carbon ions of 20 individually irradiated and unirradiated areas in 20 separate cells as well as 10 areas for FCCP control experiments.
The individual points represent measurements, the horizontal lines represent the means and the error bars represent 95% CI. FCCP control experiments and the irradiated values overlap, and fall within a region normal for depolarization. The irradiation was performed using 80 ions per point in a 6 × 6 matrix. The irradiation areas were analyzed before and after irradiation by quantifying the background subtracted gray values in the micrographs before and after irradiation. The unirradiated controls consisted of mitochondria in the same irradiated cell but more than 10 μm away from the irradiated area. A paired two tailed t-test indicates a highly significant result (P < 0.001) between non-irradiated and irradiated samples, and the effect size as calculated by Cohen’s d is 3.85, making the results highly significant.
Figure 3
Figure 3. Results for MCF7 cells stained with TMRE during irradiation experiments at SNAKE are shown.
(a) Automatic targeting macro “AutoTarget” as used for recognition and irradiation of mitochondria. The images show cells before irradiation (left), targets (black points, centre) and the overlay after target acquisition (right) for a representative living cell. Each target point represents a counted number of carbon ions. (b) Overview of live irradiation shows snapshots taken from the timelapse video (Video File 1 of the irradiation at SNAKE), whereby irradiation and imaging were performed simultaneously. The micrographs show loss of highly localized mitochondrial signal and a relocalization of TMRE to the cytoplasm (File 1). The white line represents the position of the scanning beam. (c) The mitochondrial membrane potential plotted for four selected mitochondria in the representative cell during irradiation with 80 carbon ions per point over time. Four mitochondria were chosen as shown in (e) and measured for 10 minutes from start of irradiation. The peaks represent hyperpolarization before depolarization as seen after irradiation. The markers on the graph (E and D) depict the times corresponding to the starting image before irradiation (e) and the image after irradiation is complete (d). The cytoplasmic background value was measured over the nucleus as labelled with “C” and the coronal measurement area and cell membrane outline are represented in (d). The coronal measurement (c, lower segment) measured the area around the cell and the increases in signal intensity during and after irradiation as compared to background signal in the same micrograph.
Figure 4
Figure 4. Images from a timelapse imaging sequence performed at SNAKE.
(a) TMRE (500 nM) stained MCF7 cells in 1 μM PI containing medium for the detection of membrane rupture. (b) Targets acquired with “AutoTarget”. (c) Cells were sequentially irradiated with 80, 40, 20 and 10 carbon ions per point as labelled. (d) Image after irradiation showing TMRE relocalization in the form of intracellular background signal increase is visible, however no PI specific nuclear staining is visible. At 10 min post irradiation (e) and 30 min (f) there was still no sign of PI specific staining.
Figure 5
Figure 5
(A) Histogram depicting the quantification of polarization state of irradiated mitochondria for experiments performed at SNAKE (carbon ions) and AIFIRA (protons). The percentage of cells featuring Total, Partial or no (None) depolarization are plotted above the number of carbon ions per point (100–10) and equivalent number of protons (3500-350), both decreasing to the right, required to deposit the same amount of energy in a 6 × 6 irradiation point matrix. The number of cells analyzed for each ion application in the order shown are: for carbon 4, 20, 20, 28, 28, 19, 17, and for protons, 19, 18, 12, 21, 21, 30. (B) Representative micrographs of total, partial and no depolarization are included for experiments at SNAKE and AIFIRA. Images in the first column depict the cell before irradiation, in the second column, the targets are shown, (6 × 6), and the third column shows the result after irradiation. For total depolarization, micrographs with 100 carbon ions and 3500 protons are depicted; for partial depolarization 40 carbon ions and 1500 protons; and for no depolarization 20 carbon and 700 protons are depicted.

References

    1. Clarke R. H. & Valentin J. The History of ICRP and the Evolution of its Policies. Annals of the ICRP 39, 75–110, doi: 10.1016/j.icrp.2009.07.009 (2009). - DOI
    1. Waldren C. A. Classical radiation biology dogma, bystander effects and paradigm shifts. Human & experimental toxicology, doi: 10.1191/0960327104ht425oa (2004). - DOI - PubMed
    1. Zirkle R. E. & Bloom W. Irradiation of parts of individual cells. Science 117, 487–493, doi: 10.1126/science.117.3045.487 (1953). - DOI - PubMed
    1. Watanabe W. et al.. Femtosecond laser disruption of mitochondria in living cells. Medical Laser Application 20, 185–191, doi: 10.1016/j.mla.2005.07.004 (2005). - DOI
    1. Jonghee Y., Seung-wook R., Seunghee L. & Chulhee C. Cytosolic Irradiation of Femtosecond Laser Induces Mitochondria-dependent Apoptosis-like Cell Death via Intrinsic Reactive Oxygen Cascades. Scientific Reports 5, doi: 10.1038/srep08231 (2015). - DOI - PMC - PubMed

Publication types

LinkOut - more resources