Complex multifractal nature in Mycobacterium tuberculosis genome
- PMID: 28440326
- PMCID: PMC5404331
- DOI: 10.1038/srep46395
Complex multifractal nature in Mycobacterium tuberculosis genome
Abstract
The mutifractal and long range correlation (C(r)) properties of strings, such as nucleotide sequence can be a useful parameter for identification of underlying patterns and variations. In this study C(r) and multifractal singularity function f(α) have been used to study variations in the genomes of a pathogenic bacteria Mycobacterium tuberculosis. Genomic sequences of M. tuberculosis isolates displayed significant variations in C(r) and f(α) reflecting inherent differences in sequences among isolates. M. tuberculosis isolates can be categorised into different subgroups based on sensitivity to drugs, these are DS (drug sensitive isolates), MDR (multi-drug resistant isolates) and XDR (extremely drug resistant isolates). C(r) follows significantly different scaling rules in different subgroups of isolates, but all the isolates follow one parameter scaling law. The richness in complexity of each subgroup can be quantified by the measures of multifractal parameters displaying a pattern in which XDR isolates have highest value and lowest for drug sensitive isolates. Therefore C(r) and multifractal functions can be useful parameters for analysis of genomic sequences.
Conflict of interest statement
The authors declare no competing financial interests.
Figures

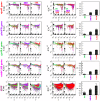
 ; MDR:
  ; XDR:
  and for phoPR gene complex: DS:
  ; MDR:
  ; XDR:
  ). (c) Plots of fluctuation function (
 ) with respect to s for the corresponding three types of M. tuberculosis isloates showing power law nature (panels of lowermost or third row).
 ; MDR:
  ; XDR:
  and for embCAB: DS:
  ; MDR:
  ; XDR:
  ). (c) Plots of fluctuation function (
 ) with respect to s for the corresponding three types of M. tuberculosis isloates showing power law nature (panels of lowermost or third row).


 ; MDR:
  ; XDR:
  ). (c) Plots of singularity function f(α) of the three types of isolates with respect to α (first three panels of third row). (d) Properties of multifractal spectral parameters: behaviors of α0, Δα and χ as a function of isolates (colors show types of isolates) in the bottom row.
 as a function of r, see Methods) is shown in first two panels of second row. (b) Same scaling procedure is done for SNP based sequences (panels of third and fourth row).

References
-
- Kadanoff L. P. Scaling laws for Ising models near Tc. Phys. 2, 263–272 (1966).
-
- West G. B. & Brown J. H. Life’s universal scaling laws. Phys. Today 57, 36–42 (2004).
-
- Abrahams E., Anderson P. W., Licciardello D. C. & Ramakrishnan T. V. Scaling Theory of Localization: Absence of Quantum Diffusion in Two Dimensions. Phys. Rev. Lett. 42, 673 (1979).
-
- Mackinnon A. & Kramer B. The scaling theory of electrons in disordered solids: additional numerical results. Z. Phys. B. 53, 1–13 (1983).
-
- Stoyan D. & Mandelbrot B. B. Fractals: Form, Chance, and Dimension. San Francisco. W. H. Freeman and Company. 1977. 352 S., 68 Abb., $14.95. ZAMM Journal of Applied Mathematics and Mechanics/Zeitschrift fr Angewandte Mathematik und Mechanik 59, 402–403 (1979).
Publication types
MeSH terms
LinkOut - more resources
Full Text Sources
Other Literature Sources

