. 2017 Jun;24(6):361-369.
doi: 10.1038/gt.2017.27. Epub 2017 Apr 25.

Improved gene delivery to adult mouse spinal cord through the use of engineered hybrid adeno-associated viral serotypes

Affiliations

Improved gene delivery to adult mouse spinal cord through the use of engineered hybrid adeno-associated viral serotypes

J J Siu et al. Gene Ther. 2017 Jun.

Abstract

Adeno-associated viral (AAV) vectors are often used in gene therapy for neurological disorders because of its safety profile and promising results in clinical trials. One challenge to AAV gene therapy is effective transduction of large numbers of the appropriate cell type, which can be overcome by modulating the viral capsid through DNA shuffling. Our previous study demonstrates that Rec2, among a family of novel engineered hybrid capsid serotypes (Rec1~4) transduces adipose tissue with far superior efficiency than naturally occurring AAV serotypes. Here we assessed the transduction of adult spinal cord at two different doses of AAV vectors expressing green fluorescent protein (2 × 10⁹ or 4 × 10⁸ viral particles) via intraparenchymal injection at the thoracic vertebral level T9. In comparison with an equal dose of the currently preferable AAV9 serotype, Rec3 serotype transduced a broader region of the spinal cord up to ~1.5 cm longitudinally and displayed higher transgene expression and increased maximal transduction rates of astrocytes at either dose and neurons at the lower dose. These novel engineered hybrid vectors could provide powerful tools at lower production costs to manipulate gene expression in the spinal cord for mechanistic studies or provide potent vehicles for gene therapy delivery, such as neurotrophins, to the spinal cord.


Conflict of interest statement

Conflict of interest

The authors declare no conflict of interest.

Figures

Figure 1
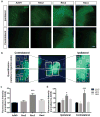
Figure 1. Methods and longitudinal transduction range of Rec serotypes compared to AAV9
(a) Experimental design. Groups of 9-week-old C57BL6 mice (n=5) were stereotaxically injected with an AAV serotype (AAV9, Rec2-4) containing CBA-GFP at vertebral level T9 into the gray-white matter junction. 3 weeks post-injection (wpi), animals were perfused for immunohistochemical analysis. (b) Quantification of longitudinal transduction in cm by the various AAV serotypes. (c) Representative images of GFP transgene expression along the spinal cord. +/− indicates distance in cm away from the injection site (vertebral level T9). n=5 mice per vector. Error bars = S.E.M. * p < 0.05. **** p < 0.0001. Scale bar = 200 μm.
Figure 2
Figure 2. Transgene expression of Rec serotypes vs. AAV9 as measured by GFP intensity
(a) Representative images of sections quantified. (b) Example of methodology applied to quantify GFP intensity in a random, unbiased manner. (c) Quantification of total GFP intensity across whole slice. (d) Quantification of GFP intensity ipsilateral and contralateral to side of injection. n=5 mice per vector. n=12 random quadrants per side. Error bars = S.E.M. * = p < 0.05. *** p < 0.001. Scale bar = 100 μm.
Figure 3
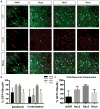
Figure 3. Comparison of neuronal transduction by Rec vectors vs. AAV9
(a) Transduction (GFP, green) of neurons assessed by NeuN (red) colocalization. DAPI (blue) = nuclear counterstain. Example colocalized cell indicated by arrowheads. (b) Quantification of GFP+/NeuN+ neurons ipsilateral and contralateral to injection side. (c) Quantification of total GFP+/NeuN+ neurons across entire slice. n=5 mice per vector. n=12 random quadrants per side. Error bars = S.E.M. * p < 0.05. Scale bar = 20 μm.
Figure 4
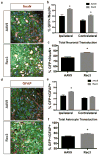
Figure 4. Comparison of astrocyte transduction by Rec vectors vs. AAV9
(a) Transduction (GFP, green) of astrocytes assessed by GFAP (red) colocalization. DAPI (blue) = nuclear counterstain. Example colocalized cell indicated by arrowheads. (b) Quantification of GFP+/GFAP+ neurons ipsilateral and contralateral to injection side. (c) Quantification of total GFP+/GFAP+ neurons across entire slice. n=5 mice per vector. n=12 random quadrants per side. Error bars = S.E.M. * p < 0.05. ** p < 0.005. Scale bar = 20 μm.
Figure 5
Figure 5. Anterograde & retrograde transport of GFP transgene protein in spinal cord
(a) Representative locations of rostral and caudal spinal cord images (b, c) relative to injection site at vertebral level T9. (b) Representative images of rostral spinal cord axons transduced with virus. (c) Representative images of caudal spinal cord axons transduced with vector. Scale bar = 100 μm.
Figure 6
Figure 6. GFP distribution in brain after direct spinal cord gene transfer of AAV9 and Rec vectors
Representative images of CNS transduction in cerebellum (a) and brainstem (b), assessed by GFP fluorescence in axonal fibers. Scale bar = 100 μm.
Figure 7
Figure 7. Longitudinal transduction range and transgene expression of Rec3 vs AAV9 serotypes at a 5-fold lower viral dose
(a) Representative images of GFP transgene expression along spinal cord. (b) Quantification of longitudinal transduction range in cm. (c) Quantification of GFP intensity ipsilateral and contralateral to side of injection. (d) Quantification of total GFP intensity across whole slice. n=5 mice per vector. n=12 random quadrants per side. Error bars = S.E.M. * = p < 0.05. Scale bar = 500 μm.
Figure 8
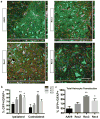
Figure 8. Comparison of neuronal and astrocyte transduction by Rec3 vs. AAV9 serotypes at a lower viral dose
(a) Transduction (GFP, green) of neurons assessed by NeuN (red) colocalization. DAPI (blue) = nuclear counterstain. Example colocalized cells indicated by arrowheads. (b) Quantification of GFP+/NeuN+ neurons ipsilateral and contralateral to injection side. (c) Quantification of total GFP+/NeuN+ neurons across entire slice. (d) Transduction of astrocyts assessed by GFAP (red) colocalization. Example colocalized cells indicated by arrowheads. (e) Quantification of GFP+/GFAP+ neurons ipsilateral and contralateral to injection side. (f) Quantification of total GFP+/GFAP+ neurons across entire slice. n=5 mice per vector. n=12 random quadrants per side. Error bars = S.E.M. * p < 0.05. Scale bar = 20 μm.

References

    1. Kotterman MA, Schaffer DV. Engineering adeno-associated viruses for clinical gene therapy. Nature reviews Genetics. 2014;15(7):445–51. - PMC - PubMed
    1. Mingozzi F, High KA. Therapeutic in vivo gene transfer for genetic disease using AAV: progress and challenges. Nature reviews Genetics. 2011;12(5):341–55. - PubMed
    1. Asokan A, Schaffer DV, Samulski RJ. The AAV vector toolkit: poised at the clinical crossroads. Mol Ther. 2012;20(4):699–708. - PMC - PubMed
    1. Charbel Issa P, De Silva SR, Lipinski DM, Singh MS, Mouravlev A, You Q, et al. Assessment of tropism and effectiveness of new primate-derived hybrid recombinant AAV serotypes in the mouse and primate retina. PloS one. 2013;8(4):e60361. - PMC - PubMed
    1. Mizukami H, Mimuro J, Ogura T, Okada T, Urabe M, Kume A, et al. Adipose tissue as a novel target for in vivo gene transfer by adeno-associated viral vectors. Human gene therapy. 2006;17(9):921–8. - PubMed

Publication types

Substances