. 2017 Oct 3;8(7):1355-1377.
doi: 10.1080/21505594.2017.1323157. Epub 2017 Apr 25.

Transcriptomic dissection of the horizontally acquired response regulator EsrB reveals its global regulatory roles in the physiological adaptation and activation of T3SS and the cognate effector repertoire in Edwardsiella piscicida during infection toward turbot

Affiliations

Transcriptomic dissection of the horizontally acquired response regulator EsrB reveals its global regulatory roles in the physiological adaptation and activation of T3SS and the cognate effector repertoire in Edwardsiella piscicida during infection toward turbot

Yang Liu et al. Virulence. .

Abstract

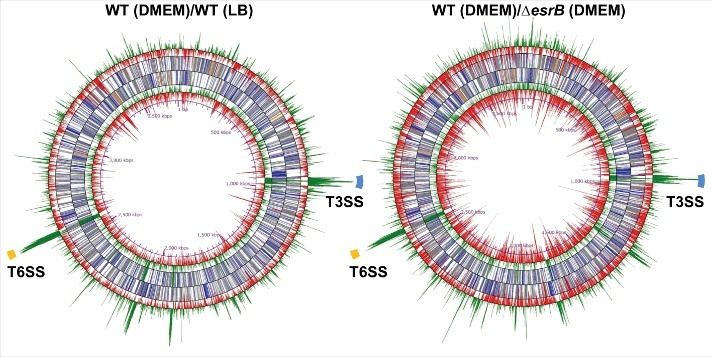
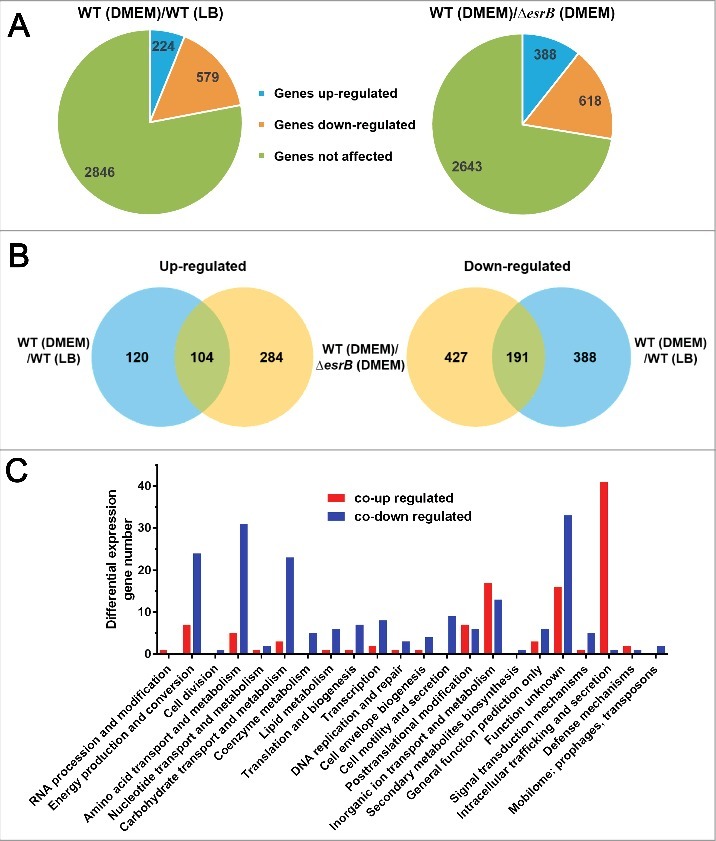
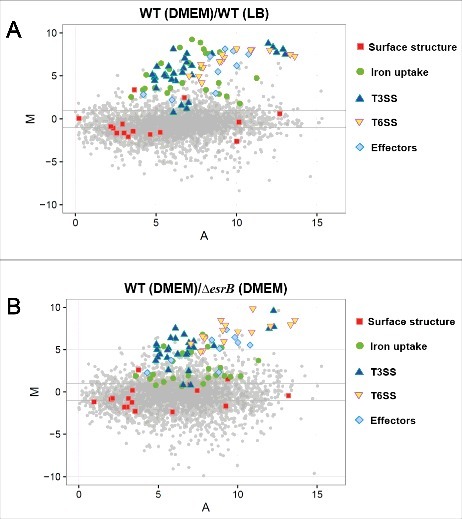
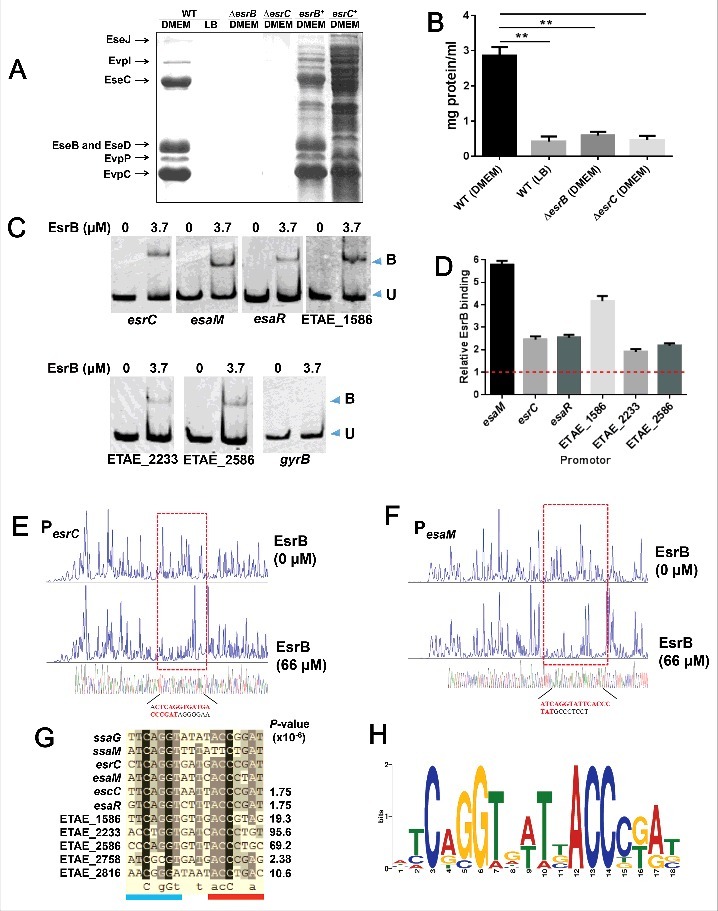
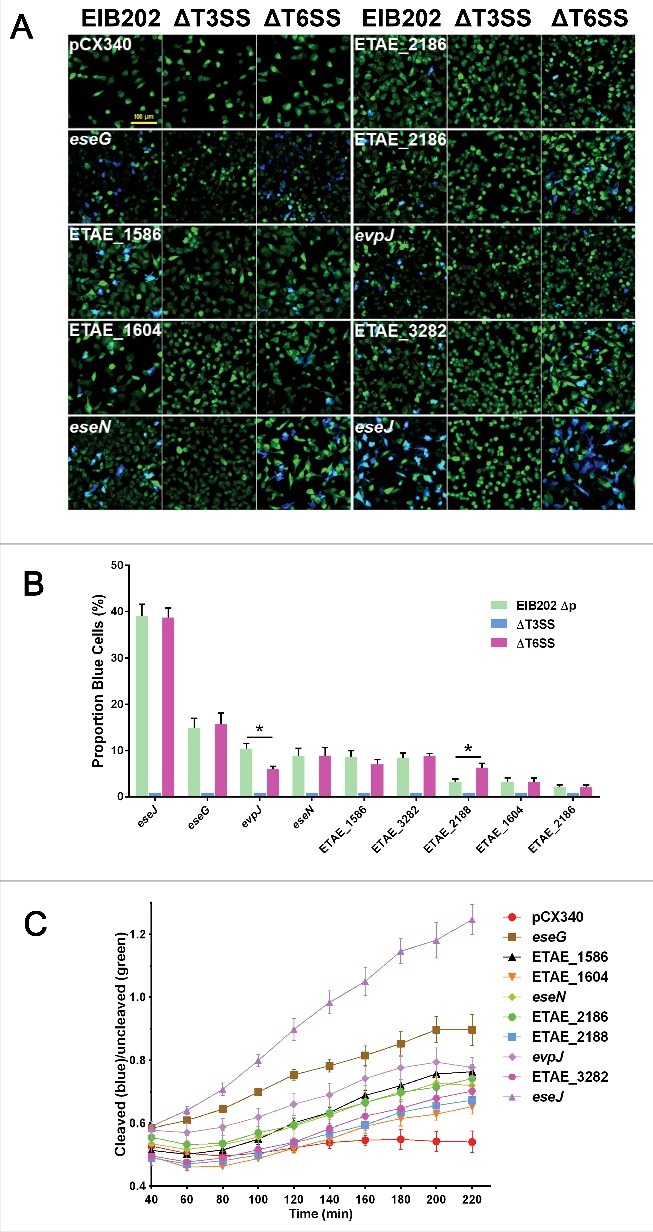
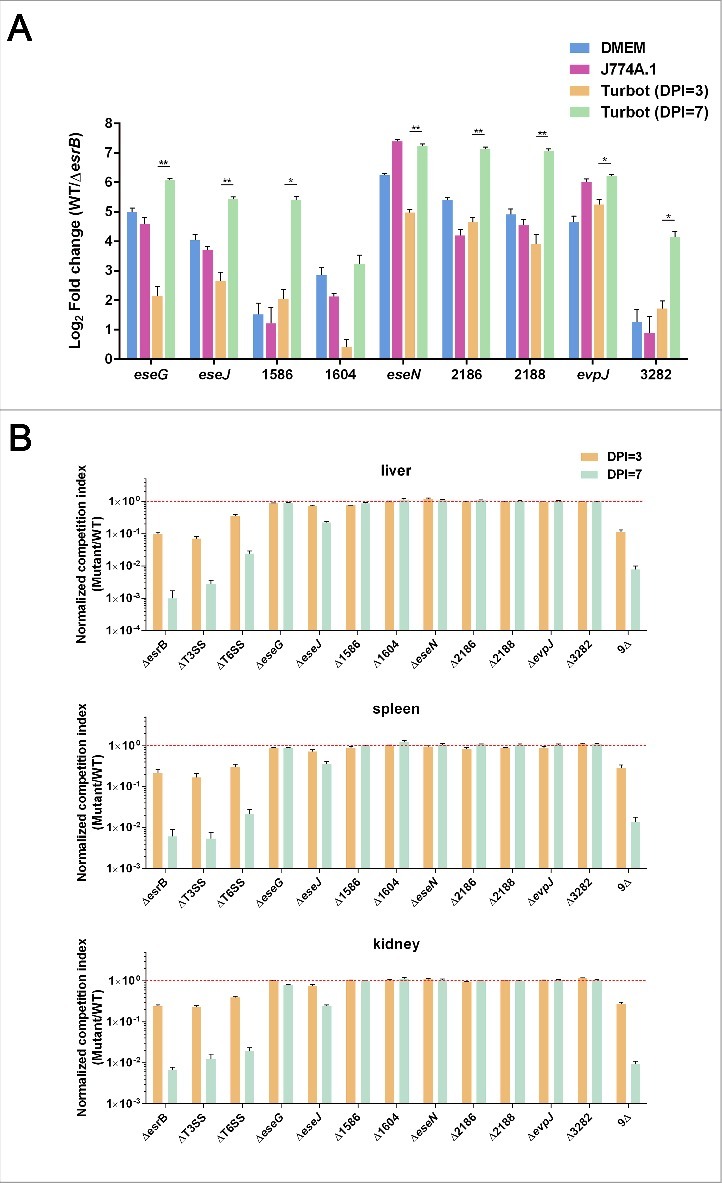
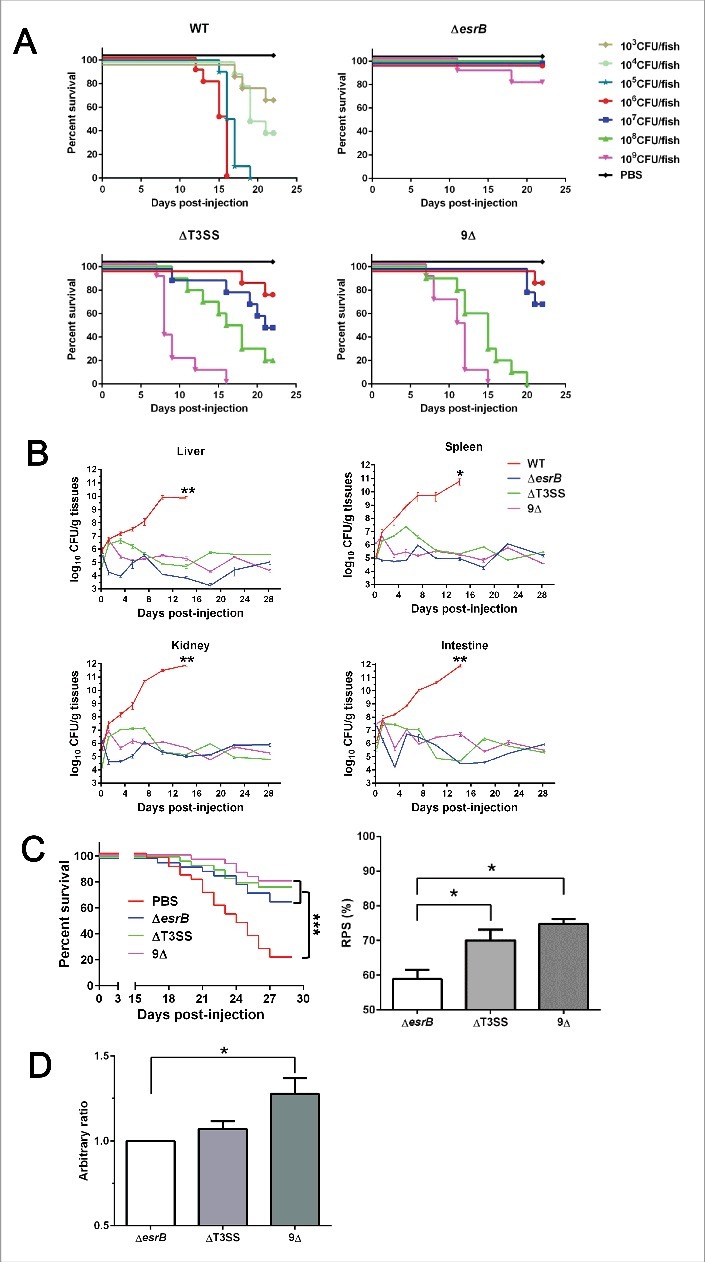
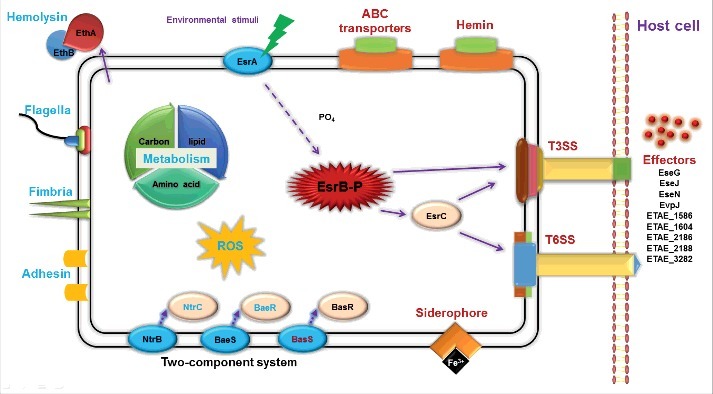
Edwardsiella piscicida is the leading pathogen threatening worldwide aquaculture industries. The 2-component system (TCS) EsrA-EsrB is essential for the pathogenesis of this bacterium. However, little is known about the regulon and regulatory mechanism of EsrA-EsrB or about the factors that mediate the interaction of TCS with bacterial hosts. Here, our RNA-seq analysis indicated that EsrB strongly induces type III and type VI secretion systems (T3/T6SS) expression and that it modulates the expression of both physiology- and virulence-associated genes in E. piscicida grown in DMEM. EsrB binds directly to a highly conserved 18-bp DNA motif to regulate the expression of T3SS and other genes. EsrB/DMEM-activated genes include 3 known and 6 novel T3SS-dependent effectors. All these effector genes are highly induced by EsrB during the late stage of in vivo infection in fish. Furthermore, although in vivo colonization by the bacterium relies on EsrB and T3/T6SS expression, it does not require the expression of individual effectors other than EseJ. The mutant lacking these 9 effectors showed significant defects in in vivo colonization and virulence toward turbot, and, more importantly, a high level of protection against challenges by wild-type E. piscicida, suggesting that it may represent a promising live attenuated vaccine. Taken together, our data demonstrate that EsrB plays a global regulatory role in controlling physiologic responses and the expression of T3SS and its cognate effector genes. Our findings will facilitate further work on the mechanism of molecular pathogenesis of this bacterium during infection.

Keywords: Edwardsiella piscicida; EsrB; RNA-seq; T3SS; T6SS; effectors.


Figures

Figure 1.
Figure 1.
RNA-seq analysis of differential gene expression of wild type (WT) and ΔesrB cultured in DMEM (n = 3) and LB (n = 3) based on normalized transcript levels. The middle circles correspond to forward and reverse NCBI gene annotation and include named genes (blue), hypothetical genes (gray), rRNA (orange) and tRNA (pink). The outermost and innermost circles show the forward and reverse log2 of differential abundance in WT in DMEM versus WT in LB (left) or WT vs. ΔesrB in DMEM (right), respectively. ORFs whose abundance is significantly higher or lower (fold > 4, Padj < 1 × 10⁻²) than the normalized average expression level are shown in green and red, respectively. The regions highlighted in blue and yellow correspond to T3SS and T6SS, respectively.
Figure 2.
Figure 2.
Comparative analyses of the E. piscicida transcriptional response to DMEM and EsrB abrogation. (A) Pie charts representing differentially transcribed genes in WT and ΔesrB cells grown in DMEM and LB. (B) Venn diagrams showing overlaps among genes with significantly increased (left) or decreased (right) transcript abundance (fold > 4, Padj < 1 × 10⁻²) in response to the different culture conditions. (C) COG categories of co-upregulated (red) or co-downregulated (blue) genes cultured under different conditions as indicated in (B).
Figure 3.
Figure 3.
MA plots showing changes in gene expression between WT in DMEM vs. LB (A) and WT vs. ΔesrB in DMEM (B). The log2 of the ratio of the abundances of each transcript between the 2 conditions (M) is plotted against the average log2 of the abundance of that transcript in both conditions (A). T3SS, T6SS, iron uptake, effectors, surface structure and effector genes are highlighted.
Figure 4.
Figure 4.
EsrB binds directly to a specific DNA motif to control the expression of T3SS and other genes. (A) ECP profiles of EIB202 WT and ΔesrB were detected by SDS-PAGE. Strains were cultured in LB and DMEM, respectively, at 30°C for 24 h without shaking. (B) Total protein secreted when the strains were grown in LB or DMEM conditions. The secreted proteins were quantitatively assayed against controls consisting of DMEM. **, P < 0.01 based on one-way ANOVA. (C) EMSA of the indicated promoter regions using purified EsrB. The amounts of EsrB protein used are indicated; 20 ng of each Cy5-labeled probe was added to the EMSA mixtures. The specificity of the shifts was verified by adding a 10-fold excess of nonspecific competitor DNA poly(dI·dC) to the EMSA mixtures. Bound (B) and unbound (U) DNA bands are indicated. (D) ChIP-qPCR analysis was used to determine the binding of EsrB to target promoter regions in E. piscicida. The results shown are normalized to the expression of the control gene gyrB and the results from the sample without EsrB, which was arbitrarily set as 1. The results were calculated using the ΔΔCT method. (E-F) Footprinting analysis of EsrB binding to a binding site in the esrC and esaM promoter. Electropherograms of a DNase I digest of the promoter probes (200 ng) after incubation with 0 or 66 µM EsrB are shown. The respective nucleotide sequences that were protected by EsrB are indicated below, and the specific binding motifs are highlighted. (G) Alignment of the EsrB-binding motifs from the promoter regions of EsrB-controlled genes as revealed by RNA-seq analysis. The established binding motifs from ssaG and ssaM in Salmonella enterica are also shown. P-values are shown for the genes identified with FIMO. (H) The EsrB binding motif derived from the binding sequences (G) generated by the MEME tool. The height of each letter represents the relative frequency of each base at the given position in the consensus sequence.
Figure 5.
Figure 5.
Identification of 9 EsrB-regulated putative effectors using HeLa cell translocation assays. (A) HeLa cells were infected with EIB202 WT, ΔT3SS, or ΔT6SS strains expressing TEM-1 fused to the 67 candidate genes. Seven hours after infection, the HeLa cells were washed and loaded with CCF2-AM. Translocation of the TEM effectors into host cells causes the cleavage of the CCF2 product, resulting in the emission of a blue fluorescence signal, whereas uncleaved CCF2 emits green fluorescence upon excitation at 409 nm. Bar = 100 µm. (B) Translocation was further determined by counting the ratio of blue cells to total cells in the foci (n = 5). *, P < 0.05 based on Student's t-test. (C) Translocation analysis based on a single-time-point translocation (STPT) assay as detailed in Materials and Methods. All the experiments were performed independently at least 3 times with 5 parallel samples.
Figure 6.
Figure 6.
Characterization of the in vitro and in vivo expression of the putative effectors (A) and their fitness contribution in E. piscicida during infection of turbot fish (B). (A) qRT-PCR analysis of the expression of the putative effectors during bacterial growth in DMEM, J774A.1 or in vivo in turbot fish at 3 or 7 DPI. The preparation of total mRNA from E. piscicida WT and ΔesrB cells grown in the above-mentioned conditions is detailed in Materials and Methods. *P < 0.05, **P < 0.01 based on Student's t-test. (B) Barcoded WT and in-frame deletion mutants of the putative effectors were recovered from turbot fish inoculated with a pool of WT and mutant strains, and competitive indices (CI) were calculated based on the ratios of individual mutant/WT tags in output vs. input. Data from liver, spleen and kidney at 3 and 7 DPI are shown as the mean ± SEM. *P < 0.05, **P < 0.01 based on ANOVA followed by Dunnett's test for multiple comparisons comparing the data with the corresponding WT (barcode A,B)/WT(barcode C,D). All the experiments were conducted in triplicate with liver, spleen, and kidney samples that were pooled (n = 5) at each time point.
Figure 7.
Figure 7.
(see previous page) Evaluation of virulence and vaccine efficiency of 9Δ in turbot fish. (A) Virulence was analyzed in turbot. Fish were inoculated intramuscularly (i.m.) with a series of dilutions of the WT and mutant strains. The infected fish were monitored for 3 weeks. (B) Infection kinetics of E. tarda strains in turbot. Following i.m. infection with the corresponding strains at a dose of 1 × 10⁵ CFU/fish, the fish were sampled in triplicate at 0, 1, 3, 5, 7, 10, 14, 18, 22, and 28 d. The organs (liver, spleen, kidney, and intestine) from 3 fish were mixed and homogenized, and serial dilutions of the homogenates were plated on DHL agar plates. The bacterial count was normalized by dividing the bacterial count (n = 3) by the weight of the mixed sample. *, P < 0.05; **, P < 0.01 based on student's t-test analysis of the bacterial counts at 14 DPI. (C) Survival curve of vaccinated turbots after challenge. Vaccinated or PBS mock-vaccinated turbot were challenged by injection of WT bacteria. The survival curves were recorded for 28 d after challenge. ***, P < 0.001 based on Kaplan-Meier survival analysis with a log rank test with Prism software (Graphpad Software). The derived relative protection index (RPS) of each strain is shown in the right panel. *, P < 0.05 based on one-way ANOVA. (D) Serum IgM titers against E. piscicida at 35 DPI were assayed by ELISA. The data reflect the mean absorbance and SEM (n = 5).
Figure 8.
Figure 8.
Schematic overview of the regulatory roles of TCS EsrA-EsrB in E. piscicida. The virulence master regulator EsrB can modulate the expression of genes associated with various processes during infection. In particular, unknown signals from the intracellular environment trigger a phosphorylation relay from EsrA to EsrB, which then directly or indirectly activates T3SS, T6SS and cognate effector translocation into the host cells. EsrB-activated processes are depicted in red; those inhibited by EsrB are shown in blue.

Comment in

Similar articles

Cited by

References

    1. Stock AM, Robinson VL, Goudreau PN. Two-component signal transduction. Annu Rev Biochem 2000; 69:183-215; PMID:10966457; https://doi.org/10.1146/annurev.biochem.69.1.183 - DOI - PubMed
    1. Mitrophanov AY, Groisman EA. Signal integration in bacterial two-component regulatory systems. Genes Dev 2008; 22(19):2601-11; PMID:18832064; https://doi.org/10.1101/gad.1700308 - DOI - PMC - PubMed
    1. Li L, Wang Q, Zhang H, Yang M, Khan MI, Zhou X. Sensor histidine kinase is a beta-lactam receptor and induces resistance to beta-lactam antibiotics. Proc Natl Acad Sci U S A 2016; 113(6):1648-53; PMID:26831117; https://doi.org/10.1073/pnas.1520300113 - DOI - PMC - PubMed
    1. Rasko DA, Moreira CG, Li DR, Reading NC, Ritchie JM, Waldor MK, Williams N, Taussig R, Wei S, Roth M. Targeting QseC signaling and virulence for antibiotic development. Science 2008; 321(5892):1078-80; PMID:18719281; https://doi.org/10.1126/science.1160354 - DOI - PMC - PubMed
    1. Wang Q, Yang M, Xiao J, Wu H, Wang X, Lv Y, Xu L, Zheng H, Wang S, Zhao G. Genome sequence of the versatile fish pathogen Edwardsiella tarda provides insights into its adaptation to broad host ranges and intracellular niches. PLoS One 2009; 4(10):e7646; PMID:19865481; https://doi.org/10.1371/journal.pone.0007646 - DOI - PMC - PubMed

Publication types

MeSH terms

Substances