Review
. 2017 Apr 25;18(5):901.
doi: 10.3390/ijms18050901.

Collagenous Extracellular Matrix Biomaterials for Tissue Engineering: Lessons from the Common Sea Urchin Tissue

Affiliations
Review

Collagenous Extracellular Matrix Biomaterials for Tissue Engineering: Lessons from the Common Sea Urchin Tissue

Kheng Lim Goh et al. Int J Mol Sci. .

Abstract

Scaffolds for tissue engineering application may be made from a collagenous extracellular matrix (ECM) of connective tissues because the ECM can mimic the functions of the target tissue. The primary sources of collagenous ECM material are calf skin and bone. However, these sources are associated with the risk of having bovine spongiform encephalopathy or transmissible spongiform encephalopathy. Alternative sources for collagenous ECM materials may be derived from livestock, e.g., pigs, and from marine animals, e.g., sea urchins. Collagenous ECM of the sea urchin possesses structural features and mechanical properties that are similar to those of mammalian ones. However, even more intriguing is that some tissues such as the ligamentous catch apparatus can exhibit mutability, namely rapid reversible changes in the tissue mechanical properties. These tissues are known as mutable collagenous tissues (MCTs). The mutability of these tissues has been the subject of on-going investigations, covering the biochemistry, structural biology and mechanical properties of the collagenous components. Recent studies point to a nerve-control system for regulating the ECM macromolecules that are involved in the sliding action of collagen fibrils in the MCT. This review discusses the key attributes of the structure and function of the ECM of the sea urchin ligaments that are related to the fibril-fibril sliding action-the focus is on the respective components within the hierarchical architecture of the tissue. In this context, structure refers to size, shape and separation distance of the ECM components while function is associated with mechanical properties e.g., strength and stiffness. For simplicity, the components that address the different length scale from the largest to the smallest are as follows: collagen fibres, collagen fibrils, interfibrillar matrix and collagen molecules. Application of recent theories of stress transfer and fracture mechanisms in fibre reinforced composites to a wide variety of collagen reinforcing (non-mutable) connective tissue, has allowed us to draw general conclusions concerning the mechanical response of the MCT at specific mechanical states, namely the stiff and complaint states. The intent of this review is to provide the latest insights, as well as identify technical challenges and opportunities, that may be useful for developing methods for effective mechanical support when adapting decellularised connective tissues from the sea urchin for tissue engineering or for the design of a synthetic analogue.

Keywords: collagen fibril; decellularised tissue; elastic stress transfer; fibril diameter; fibril taper; fibril-fibril interactions; fracture; mutable collagenous tissues; plastic stress transfer.


Conflict of interest statement

The authors declare no conflict of interest.

Figures

Figure 1
Figure 1
Sketches of the spine-test system of the sea urchin. (A) Cartoons of the sea urchin, represented by a sphere covered in spines, magnified view of the cross-section of the joint of the spine-test system and the hierarchical architecture of the catch apparatus (CA) tissue. The CA may be regarded as a ligamentous tissue as its ends are embedded in hard tissues of the spine and test; (B) Two positions, i.e., X and Y, of the spine. Symbols: S, spine; NR, nerve ring; Bs, basiepidermal nerve plexus; E, epidermis; L, central ligament; M, spine muscle; T, test. Adapted from Smith et al. [14], Hidaka et al. [15,16] and Motokawa and Fuchigami [17].
Figure 2
Figure 2
The design process for a tissue engineering approach. Left panel shows a flow-chart of the design process. The focus in this process is on the biomaterial for the scaffold development (highlighted in dark fonts). The flow of the design process is typical of engineering design, with the following key stages, statement of needs, problem definition, synthesis, analysis and optimization, evaluation and, finally, market [87]. Of note, some of the stages are expected to be iterative. Right panel shows the tissue engineering triad, comprising biomaterials, cells and signaling molecules. The engineering triad is linked to the problem definition stage and continues through to the analysis and optimization stage. The desired specifications for the biomaterial scaffold are outlined in the box based on some of the key arguments developed by Trotter and co-workers [23].
Figure 3
Figure 3
Profiles of the stress versus strain curves of mutable collagenous tissues (MCTs). (A) A sketch of the graph of stress versus strain of the CA, sea urchin (Anthocidaris crassispina) [15]; (B) A sketch of the graph of stress versus strain of the catch apparatus, sea urchin (Anthocidaris crassispina) [16]; (C) A sketch of the graph of stress versus strain of the tube feet tissue, sea urchin (Paracentrotus lividus) [70]; Sketches of (D) the graph of displacement versus time, indicating the primary (#1), secondary (#2) and tertiary (#3) phases; thereafter rupture results; (E) the graph of incremental stress versus strain and (F) the graph of stress versus strain (derived from E) of the compass depressor ligament, sea urchin (Paracentrotus lividus) [66]; (G) Sketch of graph of stress versus strain of the dermis of the sea cucumber (Cucumbria frondosa) [23] for the purpose of comparison with the results from the sea urchin (AF). Symbols in the graphs: ACh represents acetylcholine; ASW, artificial sea water; EGTA, ethylene-bis-(oxyethylenenitrilo)-tetraacetic acid (calcium chelator); TX, Triton X100.
Figure 4
Figure 4
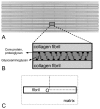
General model of collagen fibril in extracellular matrix (ECM). (A) An array of parallel collagen fibrils embedded in the ECM. The vertical dard bands and light shades represent the D-periodic patterns. (B) Interaction of collagen fibrils in the matrix. Here the interaction is assumed to be aided somewhat by proteoglycans and glycosaminoglycans, although the exact identity of the proteoglycans has yet to be determined. Not shown in this schematic are the glycoproteins. (C) A single collagen fibril modelled as a uniform cylinder. The fibril centre, O, defines the origin of the cylindrical polar coordinate system (r,θ,z), where the z axis coincides with the axis of the fibril. Of note, the single fibril-matrix model in part C provides the basic “template” for many of the discussions in this review where stress uptake in the fibril is the key concerned (see Figures 7A and 10A for similar schematics).
Figure 5
Figure 5
Fibre-matrix interfacial shear stress, τ, distributions [99,101]. (A) Shear-lag model; (B) Shear-sliding model. Here Z represents the normalized coordinate, i.e., Z = z/LCF, where z is the z coordinate of the cylindrical polar coordinate system and LCF represents the half-length of the fibril. Z is used to describe the distance along the fibre axis from the fibre centre, Z = 0, to the respective fibre ends, Z = 1 or −1.
Figure 6
Figure 6
Schematic of collagen molecules in tension in collagen fibrils. (A) the Buehler bimolecular model [110], i.e., two collagen molecules sliding under a tensile force, F. Symbol LTC represents the length of the molecule; (B) the axial-staggering of collagen molecules in a fibril. The staggered arrangement gives rise to light-dark bands (i.e., the D-periodic patterns) along the collagen fibril. Symbols D represents the D period of the collagen fibril; N and C denote the amino-terminus (containing an amine group) and C-terminus (containing carboxyl group) of the collagen molecule, respectively; (C) Two adjacent collagen fibrils.
Figure 7
Figure 7
Collagen fibril axial stress, σz, distributions. (A) Model of connective tissue featuring a collagen fibril embedded in ECM. The proposed interfacial shear stress distributions in the (B) Shear-lag and (C) Shear-sliding models for collagen fibril biomechanics [99,101]. In part B and C, symbols F represents the force acting on the ECM (red arrow represents the direction of F); σc represents the stress acting on the tissue in the direction of the fibril, rm represents the radius of the matrix surrounding the fibril; r0 represents the radius of the fibril; LCF represents the half-length of the fibril; r and z are coordinates of the cylindrical polar coordinate system; Z represents the normalized coordinate of z (i.e., Z = z/LCF) which is intended to describe the fractional distance along the fibril axis from the fibre centre, Z = 0 (i.e., O), to the respective fibre ends, Z = 1 or −1; E and E’ represent the ends of a fibril (Figure 6).
Figure 8
Figure 8
Schematic of tissue rupture. The diagram shows a snapshot of the microenvironment of ECM undergoing failure. These failures are identified as a small crack in ECM, rupture of ECM and bridging of the ruptured site by intact collagen fibrils; at the ruptured site of ECM, fibrils may also be pulled out or fractured. Adapted from Goh et al. [58].
Figure 9
Figure 9
Schematics of the cross section of fibre reinforced composites. (A) Continuous uniform cylindrical fibre reinforced composite (left panel) from a 3D perspective. Corresponding 2D perspective showing the plane of interest (POI) containing the cross-sections of the uniform cylindrical fibre (right panel); (B) Discontinuous paraboloidal fibre reinforced composite (left panel, 3D perspective). Corresponding plane of interest (POI) showing the cross-sections of the paraboloidal fibre (right panel, 2D perspective). The fibres numbered, 1–8, in the 3D and 2D schematics are intended to illustrate their associations between the two views. In part (A,B), the force acting on the respective composites is in the direction of the fibre axis.
Figure 10
Figure 10
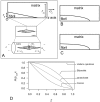
Tapered fibril reinforcing connective tissue. (A) A fibril with conical ends, concentrically arranged within the ECM. In this general model (see illustrations at the bottom and middle panels), the fibril possesses mirror symmetry about the fibril centre, O, and axis symmetry, which defines the z-axis of the cylindrical polar coordinate system, so that one-quadrant of the complete model (see illustration at the top panel) need only to be illustrated. The fibril has a radius, r0, and a half-length, LCF; rm represents the radius of the model. The stress acting on the model is represented by σc, acting in the direction of the axis. The other fibril shapes, namely a fibril with paraboloidal ends, and an ellipsoidal fibril are depicted in (B,C), respectively. These models also adopt similar assumptions of mirror and axis symmetry developed for the conical shape so that only one-quadrant of the complete model is illustrated in the respective subfigure (B,C). (D) Graph of normalized fibril axial mass, ml/ρπ, versus Z from the centre to the end of collagen fibril for the respective shapes. The graphs are obtained by evaluating the respective Equations (15)–(18). Here, ml and ρColl represent the collagen mass per unit length and density, respectively.
Figure 11
Figure 11
The stress distributions along the fibril axis for collagen fibrils, modelled by four different fibril shapes, namely conical ends, paraboloidal ends, ellipsoid and uniform cylinder, undergoing elastic stress transfer (A,B) and plastic stress transfer (C). Sketches of the (A) graph of normalized axial stress, σzc, [104] and (B) graph of interfacial shear stress, τ/σc, [96] versus fractional distance along the fibril axis, Z. The results were evaluated at fibril aspect ratio, q = 3500, and relative stiffness of the fibril to the matrix, ECF/Em = 106. (C) Graph of normalized axial stress, σzq, versus fractional distance along the fibril axis, Z obtained by evaluating the stress equations of the respective fibre shapes [107]. All graphs are shown for the stress plotted from the fibril centre (Z = 0) to one end (Z = 1). Here, symbols σc represents the applied stress acting on the tissue in the direction of the fibril, τ represents the interfacial shear stress, rm represents the radius of the matrix surrounding the fibril; Z = z/LCF where z is the z coordinate of the cylindrical polar coordinate system and LCF represents the half-length of the fibril.
Figure 12
Figure 12
Effects of fibril aspect ratio, q, and ratio of moduli of the fibril to the interfibrillar matrix, ECF/Em, on the axial stress, σz, in a fibril. Sketches of the (A) graph of normalized axial stress, σzc, versus fraction distance, Z, along the fibril and the associated (B) graph of σzc at the fibril centre (Z = 0) versus q (or ECF/Em) during elastic stress transfer [81]. Graphs of the (C) normalized axial stress, σz/τ, versus Z along the fibril and the associated (D) graph of maximum σz/τ (at Z = 0) versus q during plastic stress transfer; the results are obtained by evaluating the stress equation derived for the fibre with paraboloidal ends [107]. Thus, all results shown here apply to the fibril with a paraboloidal shape. The q values range 200 to 3500 (the arrow in part (A,C) indicates increasing q value). Of note, the authors of the paper describing these computer models have made clear the difficulties in meshing the model beyond an aspect ratio of 3500 and have defined a strategy that limits the analysis to within the constraints of the models; further details can be found in the reference [81]. Symbol σc represents the applied stress acting on the tissue in the direction of the fibril and τ represents the fibril-matrix interfacial shear stress.
Figure 13
Figure 13
Model of ECM containing short (uniform cylindrical) collagen fibrils arranged in the square-diagonally packed configuration. (A) A cross-sectional (plane of interest, POI) view; (B) The longitudinal view of the unit cell. In part (A), α refers to the primary fibril of interest; surrounding the α fibril are the β (secondary) fibrils of interest. Here, RVE represents representative volume element; λ and ρ represent the fibril-fibril axial overlap distance and the centre-to-centre lateral separation distance, respectively.
Figure 14
Figure 14
Fibril-fibril interaction. Sketches of the graph of axial tensile stress, σzc, in a fibril versus distance, Z, along the fibril axis (where Z = 0 and 1 correspond to the fibril centre and end, respectively) at (A) λ/LCF = 0; (B) λ/LCF =1/4 and (C) λ/LCF = 3/4 for the uniform cylindrical shape at varying fibril-fibril separation distance, ρ/ro, adapted from the report of Mohonee and Goh [130]. Insets (right of each graph) show representative volume elements (RVEs, Figure 13) of fibrils embedded in the matrix at different overlap distance. In the report of Mohonee and Goh, all results have been obtained by setting the ratio of the stiffnesses of the fibril to the matrix, ECF/Em, equal to 102 (“low”) and the fibril aspect ratio q = 650 (“high”). Symbol σc represents the applied stress acting on the tissue in the direction of the fibril, LCF represents the half-length of the fibril and r0 represents the fibril radius (for the tapered fibril, this refers to the radisu at the fibril centre).
Figure 15
Figure 15
Framework of the ECM mechanics for the MCT [27]. The framework provides a systematic approach to map the mechanisms involve in regulating the mechanical response of ECM at the respective loading regimes, labelled 1–5. These mechanisms are identified across the length scale from molecular to bulk tissue level. At the tissue level, the graph illustrates a schematic representation of typical MCT stress-strain behaviour.

Similar articles

Cited by

References

    1. Khang G., Kim M.S., Lee H.B. A Manual for Biomaterials/Scaffold Fabrication Technology. World Scientific; Singapore: 2007.
    1. Williams D. Essential Biomaterials Science. Cambridge University Press; Cambridge, UK: 2014. p. 672.
    1. Chan B.P., Leong K.W. Scaffolding in tissue engineering: General approaches and tissue-specific considerations. Eur. Spine J. 2008;17(Suppl. S4):467–479. doi: 10.1007/s00586-008-0745-3. - DOI - PMC - PubMed
    1. Engler A.J., Sen S., Sweeney H.L., Discher D.E. Matrix elasticity directs stem cell lineage specification. Cell. 2006;126:677–689. doi: 10.1016/j.cell.2006.06.044. - DOI - PubMed
    1. Xie J.Z., Hein S., Wang K., Liao K., Goh K.L. Influence of hydroxyapatite crystallization temperature and concentration on stress transfer in wet-spun nanohydroxyapatite-chitosan composite fibres. Biomed. Mater. 2008;3:2–6. doi: 10.1088/1748-6041/3/2/025014. - DOI - PubMed

LinkOut - more resources