. 2017 Apr 25;12(4):e0175362.
doi: 10.1371/journal.pone.0175362. eCollection 2017.

The basis of sharp spike onset in standard biophysical models

Affiliations

The basis of sharp spike onset in standard biophysical models

Maria Telenczuk et al. PLoS One. .

Abstract

In most vertebrate neurons, spikes initiate in the axonal initial segment (AIS). When recorded in the soma, they have a surprisingly sharp onset, as if sodium (Na) channels opened abruptly. The main view stipulates that spikes initiate in a conventional manner at the distal end of the AIS, then progressively sharpen as they backpropagate to the soma. We examined the biophysical models used to substantiate this view, and we found that spikes do not initiate through a local axonal current loop that propagates along the axon, but through a global current loop encompassing the AIS and soma, which forms an electrical dipole. Therefore, the phenomenon is not adequately modeled as the backpropagation of an electrical wave along the axon, since the wavelength would be as large as the entire system. Instead, in these models, we found that spike initiation rather follows the critical resistive coupling model proposed recently, where the Na current entering the AIS is matched by the axial resistive current flowing to the soma. Besides demonstrating it by examining the balance of currents at spike initiation, we show that the observed increase in spike sharpness along the axon is artifactual and disappears when an appropriate measure of rapidness is used; instead, somatic onset rapidness can be predicted from spike shape at initiation site. Finally, we reproduce the phenomenon in a two-compartment model, showing that it does not rely on propagation. In these models, the sharp onset of somatic spikes is therefore not an artifact of observing spikes at the incorrect location, but rather the signature that spikes are initiated through a global soma-AIS current loop forming an electrical dipole.


Conflict of interest statement

Competing Interests: The authors have declared that no competing interests exist.

Figures

Fig 1
Fig 1. Theories of spike initiation.
(A) Standard account of spike initiation: spike initiation results from the interplay between Na current and K current (mostly leak) flowing through the membrane at the initiation site. (B) Top: The isopotential Hodgkin-Huxley model produces spikes with smooth onset (left), exhibiting a gradual increase in dV/dt as a function of membrane potential V (right: onset rapidness measured as the slope at 20 mV/ms = 5.6 ms-1). Bottom: cortical neurons have somatic spikes with sharp onsets (left), with steep increase in dV/dt as a function of V (onset rapidness: 28.8 ms-1; human cortical data from [4]). (C) Backpropagation hypothesis: spikes are initiated according to the conventional account, with a local axonal current loop propagating towards the soma. (D) Critical resistive coupling hypothesis: owing to the strong resistive coupling between the two sites and the soma acting as a current sink, spike initiation results from the interplay between Na current and axial current. Spikes then initiate through a global current loop encompassing AIS and soma, which behaves as an electrical dipole.
Fig 2
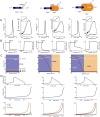
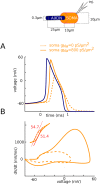
Fig 2. Intracellular features of sharp spike initiation in multicompartmental models.
Left: model with simplified soma-axon geometry. Middle: cortical pyramidal cell model with morphological reconstruction from [7]. Right: pyramidal cell model from [12]. (A) Somatic voltage trace of a spike, with (solid orange) and without (dotted orange) somatic Na channels, and axonal spike (blue). (B) Phase plot of the same trace, showing dV/dt versus membrane potential V.
Fig 3
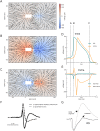
Fig 3. Extracellular field at spike initiation.
(A)-(C), Extracellular potential (color coded) and electrical field (arrows) around the simplified neuron (white box and line), at three different times indicated in (D) and (E). (D), Intracellular voltage trace at the soma and AIS distal end. (E), Extracellular potential near the soma and AIS distal end. (F), Extracellular recording near the soma of two cortical neurons (from [13]). (G), Extracellular AP recording near the AIS (grey) of a cortical pyramidal cell (from [14]).
Fig 4
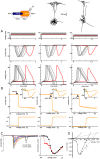
Fig 4. Currents at spike initiation.
(A) Somatic voltage-clamp recordings. Top: somatic membrane potential, spaced by 1 mV increments from threshold (red), with one trace just below threshold. Middle: recorded currents. Bottom: membrane potential at the AIS end. (B) Top: peak current measured in somatic voltage-clamp versus holding voltage, with and without somatic Na channels, showing a discontinuity. Bottom: peak proportion of open Na channels at the distal axonal end versus holding voltage (variable m3 representing activation is shown for the first two models; variable o representing current-passing state is shown for the third model). (C) Left, Current traces experimentally measured in somatic voltage-clamp in raphé neuron (from [15]). Right, Peak current vs. command voltage (red; the black curve is obtained when axonal Na channels are inactivated with a prepulse). (D) Same as (C), but in a two-electrode somatic voltage-clamp of a cat motoneuron [16]. Voltage is relative to the resting potential.
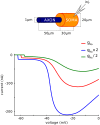
Fig 5
Fig 5. Peak current versus holding voltage in somatic voltage-clamp, using the simple model with different Nav channel conductance densities (from half to twice the initial value used in Fig 4).
Fig 6
Fig 6. Balance of currents at spike initiation.
(A) Axonal spike. (B) Rising phase of the spike. (C) Na (red), K (green) and axial (green) current traces at the axonal initiation site. Na and K currents are summed over the AIS membrane; axial current is measured at the soma-axon junction.
Fig 7
Fig 7. Balance of currents at spike initiation in the simple model, with different Nav channel conductance densities (from half to twice the initial value used in Fig 4).
Same conventions as in Fig 6.
Fig 8
Fig 8. Impact of intracellular resistivity Ri on excitability.
(A) Spikes are triggered by a slow current ramp, for different values of Ri between 1 Ω.cm and 250 Ω.cm (green: original value). The neuron is more excitable for larger values of Ri. (B) Current vs. somatic voltage in somatic voltage-clamp (as in Fig 2B) and fraction of open Na channels vs. somatic voltage, for different values of Ri.
Fig 9
Fig 9. Influence of soma size on spike initiation.
(A) Somatic voltage trace and phase plot. (B) Peak Na current (left) and proportion of open axonal Na channels (right) versus holding potential in somatic voltage-clamp. (C) Membrane potential across the neuron at different instants near spike initiation. (D) Balance of currents at initiation site (bottom) near spike initiation (top and middle: voltage trace).
Fig 10
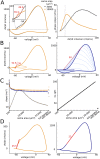
Fig 10. Somatic onset rapidness.
(A) Phase plot of a somatic spike with a large soma (orange, 10,000 μm2) and a small soma (gray, 3,000 μm2). The phase plot is linear (corresponding to locally constant phase slope) around dV/dt = 25 mV/ms in the former case and around 60 mV/ms in the latter case. Maximum phase slope is similar in both cases (39.3 and 49.5 ms-1). (B) Left: phase plot for a large soma (10,000 μm2). The presence of somatic Na channels slightly decreases onset rapidness (orange, slope: 39 ms-1). Without them, onset rapidness is 52.6 ms-1. Right: phase plots at different points along the axon (dotted blue: soma; dark blue: distal end; light blue: intermediate axonal positions). The prediction of somatic onset rapidness based on resistive coupling is the maximum slope of a tangent to the phase plot intersecting the spike initiation point, which gives 50 ms-1 at the distal end (red line). (C) Left: Somatic onset rapidness (orange) and prediction from axonal phase plots (blue) as a function of soma area for the simple model. The morphologically detailed model and the simple model with a dendrite are also shown on the right. Grey: somatic phase slope at 20 mV/ms. Right: For comparison, total somatic capacitance is shown as a function of soma area. (D) Somatic (left) and axonal (right) phase plots of a spike digitized from [7]. Maximum phase slopes are similar.
Fig 11
Fig 11. Active backpropagation is not necessary for sharp initiation.
Left: model with simplified soma-axon geometry. Right: cortical pyramidal cell model with morphological reconstruction. (A) Axonal Na channels are moved to a single axonal location (3 different locations shown). Left: voltage traces; right: phase plots. (B) Peak Na current (left) and proportion of open axonal Na channels (right) versus holding potential in somatic voltage-clamp. (C) Onset rapidness as a function of AIS position.
Fig 12
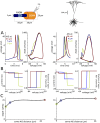
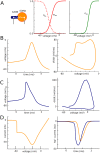
Fig 12. Two-compartment model.
(A) Equilibrium values of the gating variables for the Na (left) and K (right) channels. (B) Voltage trace (left) and phase plot (right) of a somatic spike. (C) Voltage trace (left) and phase plot (right) of an AIS spike. (D) Left: Peak current recorded in somatic voltage-clamp as a function of holding voltage. Right: Na current in the AIS (blue) and soma (orange) during a spike in current-clamp.
Fig 13
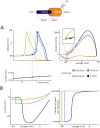
Fig 13. Sharpness of spike initiation in a small simulated neuron (axon diameter: 0.3 μm).
(A) Action potential in the axon (blue) and distal AIS (orange; dotted: with no somatic Na channels). (B) Corresponding phase plot of the action potential, showing onset rapidness greater than 50 ms-1 (inset).

Similar articles

Cited by

References

    1. Debanne D, Campanac E, Bialowas A, Carlier E, Alcaraz G. Axon physiology. Physiol Rev. 2011. April;91(2):555–602. 10.1152/physrev.00048.2009 - DOI - PubMed
    1. Kole MHP, Ilschner SU, Kampa BM, Williams SR, Ruben PC, Stuart GJ. Action potential generation requires a high sodium channel density in the axon initial segment. Nat Neurosci. 2008;11(2):178–86. 10.1038/nn2040 - DOI - PubMed
    1. Naundorf B, Wolf F, Volgushev M. Unique features of action potential initiation in cortical neurons. Nature. 2006;440(7087):1060–3. 10.1038/nature04610 - DOI - PubMed
    1. Testa-Silva G, Verhoog MB, Linaro D, De Kock CPJ, Baayen JC, Meredith RM, et al. High bandwidth synaptic communication and frequency tracking in human neocortex. PLoS Biol. 2014;12(11):1–13. - PMC - PubMed
    1. Öz P, Huang M, Wolf F. Action potential initiation in a multi-compartmental model with cooperatively gating Na channels in the axon initial segment. J Comput Neurosci. 2015;39(1):63–75. 10.1007/s10827-015-0561-9 - DOI - PubMed

Substances

LinkOut - more resources