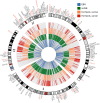
Ancient genes establish stress-induced mutation as a hallmark of cancer
- PMID: 28441401
- PMCID: PMC5404761
- DOI: 10.1371/journal.pone.0176258
Ancient genes establish stress-induced mutation as a hallmark of cancer
Abstract
Cancer is sometimes depicted as a reversion to single cell behavior in cells adapted to live in a multicellular assembly. If this is the case, one would expect that mutation in cancer disrupts functional mechanisms that suppress cell-level traits detrimental to multicellularity. Such mechanisms should have evolved with or after the emergence of multicellularity. This leads to two related, but distinct hypotheses: 1) Somatic mutations in cancer will occur in genes that are younger than the emergence of multicellularity (1000 million years [MY]); and 2) genes that are frequently mutated in cancer and whose mutations are functionally important for the emergence of the cancer phenotype evolved within the past 1000 million years, and thus would exhibit an age distribution that is skewed to younger genes. In order to investigate these hypotheses we estimated the evolutionary ages of all human genes and then studied the probability of mutation and their biological function in relation to their age and genomic location for both normal germline and cancer contexts. We observed that under a model of uniform random mutation across the genome, controlled for gene size, genes less than 500 MY were more frequently mutated in both cases. Paradoxically, causal genes, defined in the COSMIC Cancer Gene Census, were depleted in this age group. When we used functional enrichment analysis to explain this unexpected result we discovered that COSMIC genes with recessive disease phenotypes were enriched for DNA repair and cell cycle control. The non-mutated genes in these pathways are orthologous to those underlying stress-induced mutation in bacteria, which results in the clustering of single nucleotide variations. COSMIC genes were less common in regions where the probability of observing mutational clusters is high, although they are approximately 2-fold more likely to harbor mutational clusters compared to other human genes. Our results suggest this ancient mutational response to stress that evolved among prokaryotes was co-opted to maintain diversity in the germline and immune system, while the original phenotype is restored in cancer. Reversion to a stress-induced mutational response is a hallmark of cancer that allows for effectively searching "protected" genome space where genes causally implicated in cancer are located and underlies the high adaptive potential and concomitant therapeutic resistance that is characteristic of cancer.
Conflict of interest statement
Figures


Similar articles
-
Shared and unique mutational gene co-occurrences in cancers.Biochem Biophys Res Commun. 2015 Oct 2;465(4):777-83. doi: 10.1016/j.bbrc.2015.08.086. Epub 2015 Aug 24. Biochem Biophys Res Commun. 2015. PMID: 26315265
-
Combinatorial patterns of somatic gene mutations in cancer.FASEB J. 2008 Aug;22(8):2605-22. doi: 10.1096/fj.08-108985. Epub 2008 Apr 23. FASEB J. 2008. PMID: 18434431 Review.
-
Hotspot mutations delineating diverse mutational signatures and biological utilities across cancer types.BMC Genomics. 2016 Jun 23;17 Suppl 2(Suppl 2):394. doi: 10.1186/s12864-016-2727-x. BMC Genomics. 2016. PMID: 27356755 Free PMC article.
-
Altered interactions between unicellular and multicellular genes drive hallmarks of transformation in a diverse range of solid tumors.Proc Natl Acad Sci U S A. 2017 Jun 13;114(24):6406-6411. doi: 10.1073/pnas.1617743114. Epub 2017 May 8. Proc Natl Acad Sci U S A. 2017. PMID: 28484005 Free PMC article.
-
Aneuploidy, the somatic mutation that makes cancer a species of its own.Cell Motil Cytoskeleton. 2000 Oct;47(2):81-107. doi: 10.1002/1097-0169(200010)47:2<81::AID-CM1>3.0.CO;2-#. Cell Motil Cytoskeleton. 2000. PMID: 11013390 Review.
Cited by
-
Stepping From Modeling Cancer Plasticity to the Philosophy of Cancer.Front Genet. 2020 Nov 19;11:579738. doi: 10.3389/fgene.2020.579738. eCollection 2020. Front Genet. 2020. PMID: 33329717 Free PMC article. No abstract available.
-
The Multiscale Wisdom of the Body: Collective Intelligence as a Tractable Interface for Next-Generation Biomedicine.Bioessays. 2025 Mar;47(3):e202400196. doi: 10.1002/bies.202400196. Epub 2024 Dec 2. Bioessays. 2025. PMID: 39623868 Free PMC article. Review.
-
Disruption of metazoan gene regulatory networks in cancer alters the balance of co-expression between genes of unicellular and multicellular origins.Genome Biol. 2024 Apr 29;25(1):110. doi: 10.1186/s13059-024-03247-1. Genome Biol. 2024. PMID: 38685127 Free PMC article.
-
Pan-cancer surveys indicate cell cycle-related roles of primate-specific genes in tumors and embryonic cerebrum.Genome Biol. 2022 Dec 6;23(1):251. doi: 10.1186/s13059-022-02821-9. Genome Biol. 2022. PMID: 36474250 Free PMC article.
-
An Evolutionary Perspective of Neoplastic Diseases in the Universe.Cureus. 2019 Feb 7;11(2):e4030. doi: 10.7759/cureus.4030. Cureus. 2019. PMID: 31011493 Free PMC article. Review.
References
-
- Rainey PB, Thompson IP, Moxon ER. Intraclonal Polymorphism in Bacteria In: Jones JG, editor. Advances in Microbial Ecology. Boston, MA: Springer US; 1993. pp. 263–300. http://link.springer.com/10.1007/978-1-4615-2858-6_6 - DOI
-
- Troussellier M, Bonnefont J-L, Courties C, Derrien A, Dupray E, Gauthier M, et al. Responses of enteric bacteria to environmental stresses in seawater. Oceanol Acta. 1998;21: 965–981.
MeSH terms
LinkOut - more resources
Full Text Sources
Other Literature Sources
Miscellaneous

