What happened to anti-malarial markets after the Affordable Medicines Facility-malaria pilot? Trends in ACT availability, price and market share from five African countries under continuation of the private sector co-payment mechanism
- PMID: 28441956
- PMCID: PMC5405529
- DOI: 10.1186/s12936-017-1814-z
What happened to anti-malarial markets after the Affordable Medicines Facility-malaria pilot? Trends in ACT availability, price and market share from five African countries under continuation of the private sector co-payment mechanism
Abstract
Background: The private sector supplies anti-malarial treatment for large proportions of patients in sub-Saharan Africa. Following the large-scale piloting of the Affordable Medicines Facility-malaria (AMFm) from 2010 to 2011, a private sector co-payment mechanism (CPM) provided continuation of private sector subsidies for quality-assured artemisinin combination therapies (QAACT). This article analyses for the first time the extent to which improvements in private sector QAACT supply and distribution observed during the AMFm were maintained or intensified during continuation of the CPM through 2015 in Kenya, Madagascar, Nigeria, Tanzania and Uganda using repeat cross-sectional outlet survey data.
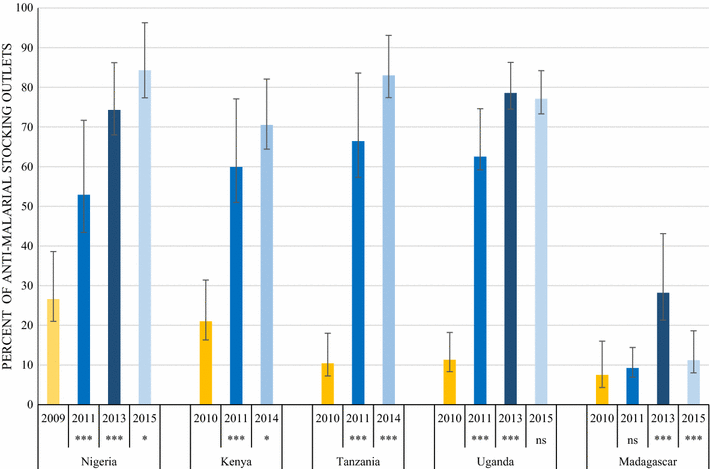
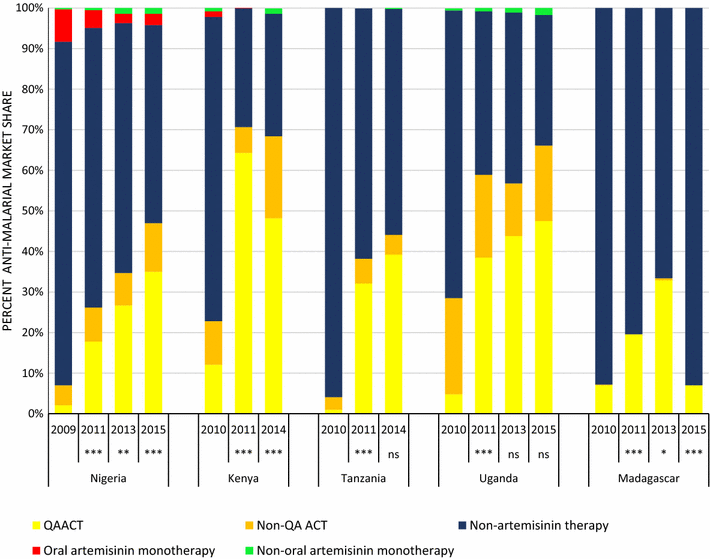
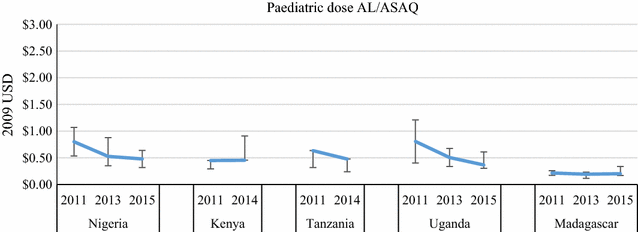
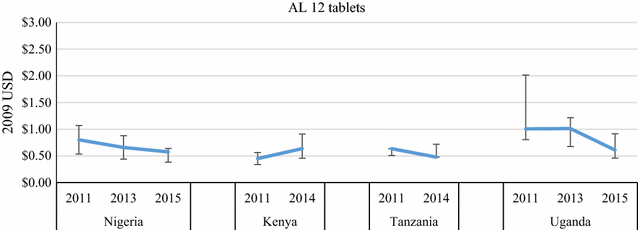
Results: QAACT market share in all five countries increased during the AMFm period (p < 0.001). According to the data from the last ACTwatch survey round, in all study countries except Madagascar, AMFm levels of private sector QAACT availability were maintained or improved. In 2014/15, private sector QAACT availability was greater than 70% in Nigeria (84.3%), Kenya (70.5%), Tanzania (83.0%) and Uganda (77.1%), but only 11.2% in Madagascar. QAACT market share was maintained or improved post-AMFm in Nigeria, Tanzania and Uganda, but statistically significant declines were observed in Kenya and Madagascar. In 2014/5, QAACT market share was highest in Kenya and Uganda (48.2 and 47.5%, respectively) followed by Tanzania (39.2%), Nigeria (35.0%), and Madagascar (7.0%). Four of the five countries experienced significant decreases in median QAACT price during the AMFm period. Private sector QAACT prices were maintained or further reduced in Tanzania, Nigeria and Uganda, but prices increased significantly in Kenya and Madagascar. SP prices were consistently lower than those of QAACT in the AMFm period, with the exception of Kenya and Tanzania in 2011, where they were equal. In 2014/5 QAACT remained two to three times more expensive than the most popular non-artemisinin therapy in all countries except Tanzania.
Conclusions: Results suggest that a private sector co-payment mechanism for QAACT implemented at national scale for 5 years was associated with positive and sustained improvements in QAACT availability, price and market share in Nigeria, Tanzania and Uganda, with more mixed results in Kenya, and few improvements in Madagascar. The subsidy mechanism as implemented over time across countries was not sufficient on its own to achieve optimal QAACT uptake. Supporting interventions to address continued availability and distribution of non-artemisinin therapies, and to create demand for QAACT among providers and consumers need to be effectively implemented to realize the full potential of this subsidy mechanism. Furthermore, there is need for comprehensive market assessments to identify contemporary market barriers to high coverage with both confirmatory testing and appropriate treatment.
Keywords: Artemisinin combination therapy; Case management; Global Fund; Malaria treatment; Private sector.
Figures



References
-
- O’Connell KA, Gatakaa H, Poyer S, Njogu J, Evance I, Munroe E, et al. Got ACTs? Availability, price, market share and provider knowledge of anti-malarial medicines in public and private sector outlets in six malaria-endemic countries. Malar J. 2011;10:326. doi: 10.1186/1475-2875-10-326. - DOI - PMC - PubMed
-
- Marek T, O’Farrell C, Yamamoto C, Zable I. Trends and opportunities in public-private partnerships to improve health service delivery in Africa. Africa region human development working paper series. Washington, DC. 2005. http://documents.worldbank.org/curated/en/480361468008714070/Trends-and-.... Accessed 2 Apr 2017.
-
- WHO. Guidelines for the treatment of malaria. 3rd ed. Geneva: World Health Organization. 2015. http://apps.who.int/iris/bitstream/10665/162441/1/9789241549127_eng.pdf. Accessed 8 Mar 2017.
MeSH terms
Substances
Associated data
LinkOut - more resources
Full Text Sources
Other Literature Sources
Medical

