. 2017 Apr 26;5(1):44.
doi: 10.1186/s40168-017-0261-y.

Fecal metagenomic profiles in subgroups of patients with myalgic encephalomyelitis/chronic fatigue syndrome

Affiliations

Fecal metagenomic profiles in subgroups of patients with myalgic encephalomyelitis/chronic fatigue syndrome

Dorottya Nagy-Szakal et al. Microbiome. .

Abstract

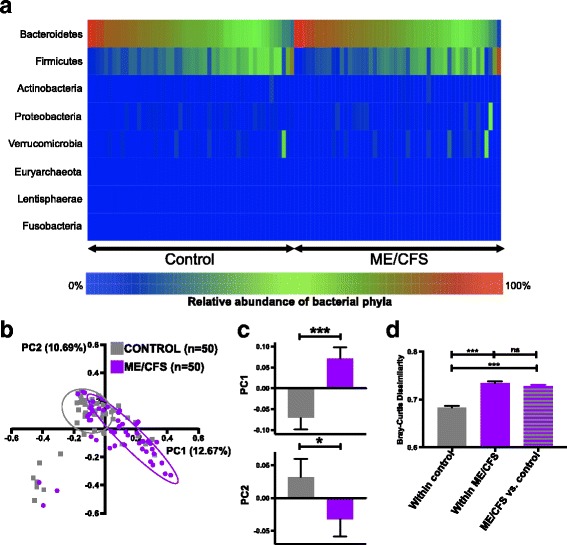
Background: Myalgic encephalomyelitis/chronic fatigue syndrome (ME/CFS) is characterized by unexplained persistent fatigue, commonly accompanied by cognitive dysfunction, sleeping disturbances, orthostatic intolerance, fever, lymphadenopathy, and irritable bowel syndrome (IBS). The extent to which the gastrointestinal microbiome and peripheral inflammation are associated with ME/CFS remains unclear. We pursued rigorous clinical characterization, fecal bacterial metagenomics, and plasma immune molecule analyses in 50 ME/CFS patients and 50 healthy controls frequency-matched for age, sex, race/ethnicity, geographic site, and season of sampling.

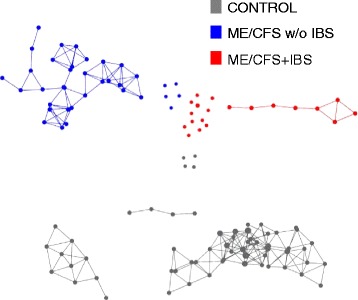
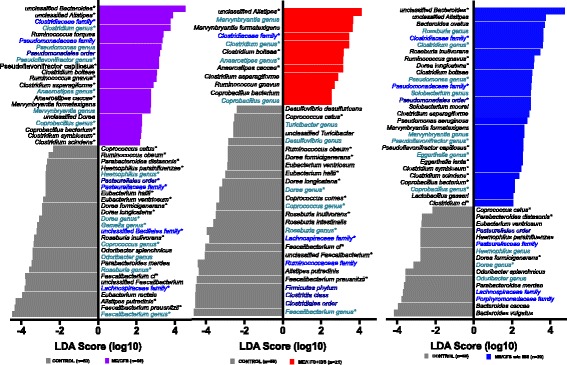
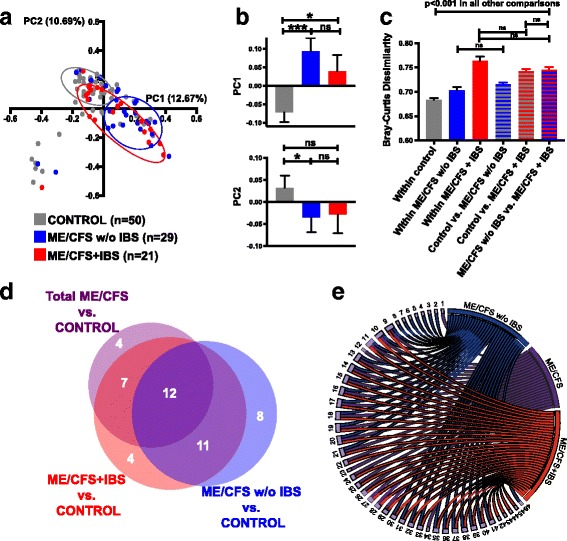
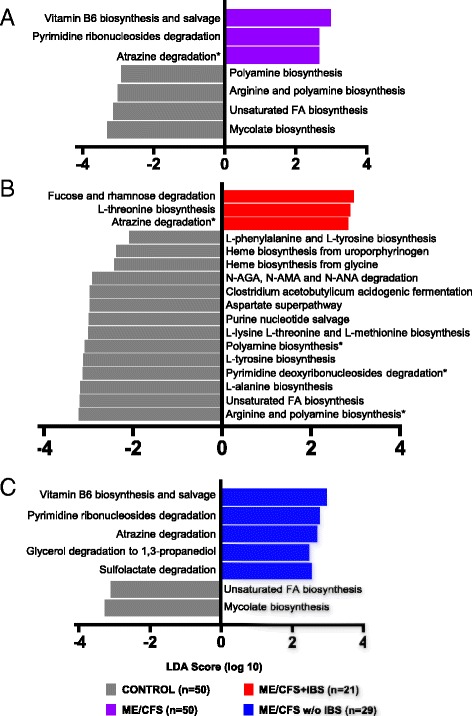
Results: Topological analysis revealed associations between IBS co-morbidity, body mass index, fecal bacterial composition, and bacterial metabolic pathways but not plasma immune molecules. IBS co-morbidity was the strongest driving factor in the separation of topological networks based on bacterial profiles and metabolic pathways. Predictive selection models based on bacterial profiles supported findings from topological analyses indicating that ME/CFS subgroups, defined by IBS status, could be distinguished from control subjects with high predictive accuracy. Bacterial taxa predictive of ME/CFS patients with IBS were distinct from taxa associated with ME/CFS patients without IBS. Increased abundance of unclassified Alistipes and decreased Faecalibacterium emerged as the top biomarkers of ME/CFS with IBS; while increased unclassified Bacteroides abundance and decreased Bacteroides vulgatus were the top biomarkers of ME/CFS without IBS. Despite findings of differences in bacterial taxa and metabolic pathways defining ME/CFS subgroups, decreased metabolic pathways associated with unsaturated fatty acid biosynthesis and increased atrazine degradation pathways were independent of IBS co-morbidity. Increased vitamin B6 biosynthesis/salvage and pyrimidine ribonucleoside degradation were the top metabolic pathways in ME/CFS without IBS as well as in the total ME/CFS cohort. In ME/CFS subgroups, symptom severity measures including pain, fatigue, and reduced motivation were correlated with the abundance of distinct bacterial taxa and metabolic pathways.

Conclusions: Independent of IBS, ME/CFS is associated with dysbiosis and distinct bacterial metabolic disturbances that may influence disease severity. However, our findings indicate that dysbiotic features that are uniquely ME/CFS-associated may be masked by disturbances arising from the high prevalence of IBS co-morbidity in ME/CFS. These insights may enable more accurate diagnosis and lead to insights that inform the development of specific therapeutic strategies in ME/CFS subgroups.

Keywords: Chronic fatigue syndrome; Irritable bowel syndrome; Metabolic pathway; Metagenomic; Microbiota-gut-brain axis; Myalgic encephalomyelitis; Topological data analysis.


Figures

Fig. 1
Fig. 1
Topological data analysis (TDA) reveals altered metagenomic profiles in ME/CFS. Metagenomic data including bacterial composition predicted bacterial metabolic pathways, plasma immune profiles and symptom severity scores were analyzed by using TDA (AYASDI software) to define multidimensional subgroups. TDA of variance-normalized Euclidean distance metric with four lenses [neighborhood lenses (NL1 and NL2), ME/CFS, and IBS diagnosis] revealed that ME/CFS samples formed distinct networks separately from controls. The controls grouped more tightly than the ME/CFS patients. IBS co-morbidity was identified as the strongest driving factor in the separation of metagenomic and immune profile of ME/CFS individuals. Dots that are not connected to the networks represent outliers. Metagenomic data including bacterial composition and inferred metabolic pathways, plasma immune profiles, and health symptom severity scores were integrated for topological data analysis (TDA) using the AYASDI platform (Ayasdi, Menlo Park, California). AYASDI represents high-dimensional, complex biological data sets as a structured 3-dimensional network [56]. Each node in the network comprises one or more subject(s) who share variables in multiple dimensions. Lines connect network nodes that contain shared data points. Unlike traditional network models where a single sample makes a single node, the size of a node in the topological network was proportional to the number of variables with a similar profile. We built a network comprised of 100 samples and 1358 variables (574 variables representing bacterial relative abundance at different taxonomic levels, 61 variables reflecting levels of each immune molecule in the assay, 586 variables representing metabolic pathways, 80 variables representing different ME/CFS fatigue, and other symptom score/health questionnaire items and information on co-morbidities, and demographic variables). All variables were weighted equally. Variance-normalized Euclidean distance method was used as the distance metric; a range of filter lenses (neighborhood lens 1 and 2, ME/CFS, and IBS diagnosis) was used to identify networks
Fig. 2
Fig. 2
The altered microbial profile of ME/CFS compared to controls. a Heatmap representing the relative abundance of phyla in ME/CFS and control subjects. Bacteroidetes and Firmicutes were the two dominant phyla in both ME/CFS and control individuals. The heatmap represents the individual values (relative abundances) of bacterial phyla as colors where blue is the minimum percentage (0%) and red is the maximum percentage (100%). b Principal coordinate analysis (PCoA) based on the Bray-Curtis dissimilarity among species-level relative abundance distributions showed overlap between ME/CFS and control subject microbiota. c Bar charts showing significant separation of ME/CFS and controls along the first two PCs (PC1 explaining 12.67% of the variance, ***p < 0.001; PC2 explaining 10.69% of the variance, *p = 0.030). PCoA coordinates were compared as continuous variables with nonparametric Mann-Whitney U test. d Bar chart showing the BC dissimilarity within control subjects, within ME/CFS subjects, and between ME/CFS vs. control subjects. BC dissimilarity values were compared as continuous variables with nonparametric Mann-Whitney U test; error bars show the mean with SEM (standard error of the mean). *p < 0.05; ***p < 0.001. ns not significant
Fig. 3
Fig. 3
Bacterial taxa differentiate ME/CFS and ME/CFS subgroups (ME/CFS + IBS and ME/CFS without IBS) compared to controls. Histogram showing the log-transformed LDA scores computed with LEfSe for bacterial taxa differentially abundant between ME/CFS groups and controls. Positive LDA score indicates enrichment in a ME/CFS, b ME/CFS + IBS, and c ME/CFS without IBS vs. controls. Negative LDA indicates enrichment in control subjects (reduced in ME/CFS subgroups). The LDA score indicates the effect size and ranking of each bacterial taxon. Names of different taxonomic categories (genus, family, or order) are indicated with shades of blue; species names are written in black. An alpha value of 0.05 for the Kruskal-Wallis test and a log-transformed LDA score of 2.0 were used as thresholds for significance in LEfSe analyses. Asterisks next to taxa names indicate significant differences that were also found for a given taxa based on nonparametric Mann-Whitney U test with Benjamini correction (adjusted p < 0.2)
Fig. 4
Fig. 4
Distinct microbial profiles of ME/CFS + IBS and ME/CFS without IBS compared to controls. a Principal coordinate analysis (PCoA) analysis based on the BC dissimilarity with ME/CFS stratified by IBS co-morbidity. b Bar charts showing separation of ME/CFS with and without IBS compared to controls along PC1 (top panel); only ME/CFS without IBS showed significant separation along PC2 (bottom panel). c Bar chart showing the mean BC dissimilarity within control subjects, within ME/CFS without IBS and within ME/CFS with IBS subjects, as well as, between control vs. ME/CFS without IBS, between control vs. ME/CFS with IBS, and between ME/CFS without IBS vs. ME/CFS with IBS subjects. PCoA coordinates and BC dissimilarity values were compared as continuous variables with nonparametric Mann-Whitney U test; error bars show the SEM (standard error of the mean). *p < 0.05; ***p < 0.001. ns not significant. d, e Unique and overlapping bacterial species differentiate ME/CFS and ME/CFS IBS subgroups from control subjects. d Proportional Venn diagram showing the number of unique and overlapping bacterial species that differentiate ME/CFS groups from control subjects. e Circular visualization (Circos) showing the individual bacterial species and their unique or overlapping relationship between the total ME/CFS group, the ME/CFS without IBS group, and the ME/CFS with IBS group. Unique to total ME/CFS: Gemella unclassified (1), Streptococcus peroris (12), Eubacterium rectale (23), and Ruminococcus torques (34). Unique to ME/CFS without IBS: Bacteroides caccae (2), Bacteroides ovatus [64], Bacteroides vulgatus (4), Lactobacillus gasseri (5), Streptococcus infantis (6), Solobacterium moorei (7), Pseudomonas aeruginosa (8), and Eggerthella lenta (46). Unique to ME/CFS + IBS: Butyrivibrio unclassified (42), Coprococcus comes (43), Roseburia intestinalis (44), and Desulfovibrio desulfuricans (45). Overlapping between all three comparisons (total ME/CFS, ME/CFS without IBS and ME/CFS + IBS groups vs. control): Alistipes unclassified (9), Clostridium asparagiforme (10), Clostridium bolteae (11), Eubacterium ventriosum (13), Coprococcus catus (14), Dorea formicigenerans (15), Dorea longicatena (16), Marvinbryantia formatexigens (17), Roseburia inulinivorans (18), Ruminococcus gnavus (19), Subdoligranulum variabile (20),and Coprobacillus bacterium (21). Overlapping between total ME/CFS and ME/CFS + IBS groups compared to controls: Alistipes putredinis (22), Eubacterium hallii (24), Anaerostipes caccae (25), Faecalibacterium cf. (26), Faecalibacterium prausnitzii (27), Faecalibacterium unclassified (28), and Ruminococcus obeum (29). Overlapping between ME/CFS without IBS and ME/CFS + IBS groups compared to controls: Bacteroides unclassified (30), Odoribacter splanchnicus (31), Parabacteroides distasonis (32), Parabacteroides merdae (33), Clostridium cf. (35), Clostridium scindens (36), Clostridium symbiosum (37), Pseudoflavonifractor capillosus (38), Blautia hansenii (39), Dorea unclassified (40), and Haemophilus parainfluenzae (41)
Fig. 5
Fig. 5
Altered bacterial metabolic pathways define ME/CFS and ME/CFS subgroup with IBS co-morbidity. Histogram of the log-transformed LDA scores computed with LEfSe for bacterial metabolic pathways found to be differentially abundant between ME/CFS groups and controls. Positive LDA score indicates enrichment of pathways in a ME/CFS, b ME/CFS + IBS, and c ME/CFS without IBS vs. controls. Negative LDA indicates enrichment of pathways in control subjects (reduced in ME/CFS groups). The LDA score indicates the effect size and ranking of each superpathway. An alpha value of 0.05 for the Kruskal-Wallis test and a log-transformed LDA score of 2.0 were used as thresholds for significance in LEfSe analyses. Asterisks next to pathways indicate significant differences were also found for a given pathway based on nonparametric Mann-Whitney U test with Benjamini-Hochberg correction (adjusted p < 0.2)

References

    1. Institute of Medicine I . Beyond myalgic encephalomyelitis/chronic fatigue syndrome: redefining an illness. Washington: The National Academies Press; 2015. - PubMed
    1. Jason LA, Benton MC, Valentine L, Johnson A, Torres-Harding S. The economic impact of ME/CFS: individual and societal costs. Dyn Med. 2008;7:6. doi: 10.1186/1476-5918-7-6. - DOI - PMC - PubMed
    1. Evans M, Barry M, Im Y, Brown A, Jason LA. An investigation of symptoms predating CFS onset. J Prev Interv Community. 2015;43(1):54–61. doi: 10.1080/10852352.2014.973240. - DOI - PMC - PubMed
    1. Aaron LA, Herrell R, Ashton S, Belcourt M, Schmaling K, Goldberg J, Buchwald D. Comorbid clinical conditions in chronic fatigue: a co-twin control study. J Gen Intern Med. 2001;16(1):24–31. - PMC - PubMed
    1. Hausteiner-Wiehle C, Henningsen P. Irritable bowel syndrome: relations with functional, mental, and somatoform disorders. World J Gastroenterol. 2014;20(20):6024–6030. doi: 10.3748/wjg.v20.i20.6024. - DOI - PMC - PubMed

Publication types