. 2017 Sep 1;23(17):5225-5237.
doi: 10.1158/1078-0432.CCR-17-0263. Epub 2017 Apr 25.

Ribonucleotide Reductase Catalytic Subunit M1 (RRM1) as a Novel Therapeutic Target in Multiple Myeloma

Affiliations

Ribonucleotide Reductase Catalytic Subunit M1 (RRM1) as a Novel Therapeutic Target in Multiple Myeloma

Morihiko Sagawa et al. Clin Cancer Res. .

Abstract

Purpose: To investigate the biological and clinical significance of ribonucleotide reductase (RR) in multiple myeloma.Experimental Design: We assessed the impact of RR expression on patient outcome in multiple myeloma. We then characterized the effect of genetic and pharmacologic inhibition of ribonucleotide reductase catalytic subunit M1 (RRM1) on multiple myeloma growth and survival using siRNA and clofarabine, respectively, in both in vitro and in vivo mouse xenograft models.Results: Newly diagnosed multiple myeloma patients with higher RRM1 expression have shortened survival. Knockdown of RRM1 triggered significant growth inhibition and apoptosis in multiple myeloma cells, even in the context of the bone marrow microenvironment. Gene expression profiling showed upregulation of DNA damage response genes and p53-regulated genes after RRM1 knockdown. Immunoblot and qRT-PCR analysis confirmed that γ-H2A.X, ATM, ATR, Chk1, Chk2, RAD51, 53BP1, BRCA1, and BRCA2 were upregulated/activated. Moreover, immunoblots showed that p53, p21, Noxa, and Puma were activated in p53 wild-type multiple myeloma cells. Clofarabine, a purine nucleoside analogue that inhibits RRM1, induced growth arrest and apoptosis in p53 wild-type cell lines. Although clofarabine did not induce cell death in p53-mutant cells, it did trigger synergistic toxicity in combination with DNA-damaging agent melphalan. Finally, we demonstrated that tumor growth of RRM1-knockdown multiple myeloma cells was significantly reduced in a murine human multiple myeloma cell xenograft model.Conclusions: Our results therefore demonstrate that RRM1 is a novel therapeutic target in multiple myeloma in the preclinical setting and provide the basis for clinical evaluation of RRM1 inhibitor, alone or in combination with DNA-damaging agents, to improve patient outcome in multiple myeloma. Clin Cancer Res; 23(17); 5225-37. ©2017 AACR.


Conflict of interest statement

Conflict of Interest: The authors declare no potential conflicts of interest.

Figures

Figure 1
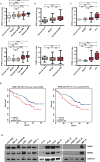
Figure 1. RRM1 and RRM2 expression in MM cells
(A–C) RRM1 (upper panels) and RRM2 (lower panels) mRNA expression in MM patient samples. Three independent data sets (A; GSE6477, B; GSE5900, and C; GSE13591) were analyzed for RRM1 and RRM2 expression in normal donors, monoclonal gammopathy of undetermined significance (MGUS), smoldering multiple myeloma (MM), newly diagnosed MM, relapsed MM, and plasma cell leukemia (PCL). *P<0.05, **P<0.01, ***P<0.001. NS, not significant; analysis of variance (ANOVA) followed by Dunnett’s test. (D) Survival analysis in newly diagnosed MM patients related to RRM1 and RRM2 expression (GSE39754). Red line indicates upper 1/3 of each gene expression, while blue line indicates lower 2/3 of each gene expression. (E) Immunoblot analysis of RRM1 and RRM2 in 6 MM cell lines, 3 MM patient samples (CD138 positive cells from bone marrow), and 3 normal donor PBMC samples.
Figure 2
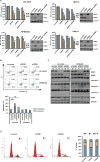
Figure 2. In vitro and in vivo effects of RRM1 and RRM2 knockdown in MM cells
(A) RRM1- and RRM2-specific siRNA were used to knockdown respective genes in MM cell lines. Growth inhibition of the cells was measured by MTT assay. The growth of all 4 MM cell lines was significantly reduced at 72 and/or 96 h, especially in siRRM1 cells. Blue bar: 48 h, Orange bar: 72 h and gray bar: 96 h. **P<0.01 compared with scramble (control) at the same time period; Student’s t-test. Immunoblots confirmed RRM1 and RRM2 knockdown. Whole-cell lysates were subjected to immunoblot analysis, and GAPDH served as the loading control for each membrane. (B) RRM1 and RRM2 were knockdowned in NCI-H929 and RPMI8226 cells with RRM1- and RRM2-specific siRNA, and the number of apoptotic cells were examined at 72 h. While significant apoptosis was triggered by siRNA knockdown in NCI-H929 cells, whereas only mild apoptosis was observed in RPMI8226 cells **P<0.01 compared with scramble; Student’s t-test. (C) Immunoblot analysis of apoptosis-related proteins in RRM1- and RRM2-knockdown NCI-H929 and RPMI8226 cells. Whole-cell lysates were subjected to immunoblot analysis, and GAPDH served as the loading control for each membrane. (D) RRM1 and RRM2 were knockdowned in NCI-H929 cells with RRM1- and RRM2-specific siRNA, and the cell cycle analysis was performed at 48 h. Increase in the number of cells in S-phase was seen in siRNA knockdown cells. (E) NCI-H929 cells were induced with either control or pMSCV-RRM2 plasmid, and then knockdowned with scramble or RRM1-targeted siRNA. Growth inhibition of the cells was measured by MTT assay. **P<0.01 compared with scramble (control) at the same time period; Student’s t-test. Immunoblots confirmed RRM1 knockdown and RRM2 overexpression. GAPDH served as the loading control for each membrane. (F) RRM1 and RRM2 were knockdowned in NCI-H929 and RPMI8226 cells with RRM1- and RRM2-specific siRNA, and co-cultured in the presence or absence patients’ bone marrow stroma cell (BMSC) for 72 h. Data indicate that the BM microenvironment could not abrogate the knockdown effect of RRM1 and RRM2. **P<0.01 compared with scramble; Student’s t-test. (G) MM cells transduced with siRRM1 or scramble (3x10⁶ viable cells) were subcutaneously injected into 200 cGy irradiated SCID mice. Data represent mean ±s.e.m. N=5 mice per group. An image of tumors in each group is shown (top panel). *P=0.0159; Student’s t-test. Data are representative of at least two independent experiments except for xenograft experiment.
Figure 3
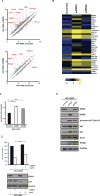
Figure 3. DNA damage response pathway plays essential role in RRM1-knockdown MM cells
(A) Immunoblot analysis of DNA damage response pathway genes in RRM1- and RRM2-knockdown NCI-H929 and RPMI8226 cells. GAPDH served as the loading control for each membrane. (B) Quantitative real-time PCR (QRT-PCR) analysis of RRM1, RRM2, RAD51, 53BP1, BRCA1, and BRCA2 in NCI-H929 and RPMI8226 cells transduced with either siRNA targeting RRM1, RRM2 or scramble (control). Shown are relative signal intensity (scramble=1) normalized by GAPDH. **P<0.01 compared with scramble; Student’s t-test. (C) Immunoblot analysis of RAD51, 53BP1, BRCA1, and BRCA2 in NCI-H929 and RPMI8226 cells transduced with siRNA targeting RRM1, RRM2 or scramble. GAPDH served as the loading control for each membrane, and data are representative of at least two independent experiments.
Figure 4
Figure 4. Transcriptional activity of TP53 pathway is crucial in TP53 wild-type MM cells
(A) Scatter plots depicting the relative gene expression in NCI-H929 cells treated with siRRM1, siRRM2, or scramble. Genes related to TP53 and BRCA1 (plotted in red) were eluted together with >1.5 fold change. (B) Heatmap showed induction of TP53-related genes in RRM1- RRM2-knockdown cells compared to scramble. Yellow denoted higher expression, while blue denoted lower expression. (C) Transcription activity levels of TP53 in TP53 wild-type NCI-H929 cells. Fold changes relative to scramble are shown. (D) Immunoblot analysis of TP53 and its related proteins in whole-cell lysates from RRM1- and RRM2-knockdown NCI-H929 cells (E) NCI-H929 cells were treated with siRRM1, sip53, or both; left panel shows survival of cells 72 h after knockdown. Right panel shows confirmation of knockdown, and GAPDH served as the loading control for each membrane. Data are representative of at least two independent experiments in Figure 4C–4E. **P<0.01; Student’s t-test.
Figure 5
Figure 5. RRM1 inhibitor induces apoptosis in MM cells
(A) Seven MM cell lines (NCI-H929, MM.1S, MOLP8, RPMI8226, OPM2, U266, and KMS-11 cells) were treated with CLO (0–30 µM) for 48 h, and growth was then measured by MTT assay. (B–D) Immunoblot analysis of cell lysates of NCI-H929 cells treated with CLO (5 µM, 3–48 h) GAPDH served as the loading control for each membrane, and data are representative of at least two independent experiments.
Figure 6
Figure 6. RRM1 inhibition combined with DNA damaging agent CLO have synergistic effect on MM cells
(A) (left panels) NCI-H929 and RPMI8226 cells were treated with the combination of CLO and MEL for 48 h at the indicated doses, and tumor growth reduction was measured by MTT assay. (right panels) Combination Index (CI) was calculated in each combination therapy. CI under 1 is recognized as synergy. (B) NCI-H929 and RPMI8226 cells were treated with CLO (NCI-H929; 3 µM, RPMI8226; 10 µM) and MEL (20 µM) for 48 h, and the number of apoptotic cells were examined. Combination treatment indicates higher percentage of apoptotic cells. (C,D) Immunoblot analysis of cell lysates after combination treatment with CLO (NCI-H929; 3 µM, RPMI8226; 10 µM) and MEL (20 µM) for 48 h. (E) NCI-H929 and RPMI8226 cells were treated with combination of siRNA treatment (siRRM1 or scramble) and MEL for 72 h at the indicated doses, and tumor growth was measured by MTT assay. **P<0.01. NS, not significant; Student’s t-test. (F) Immunoblot analysis of cell lysates after combination siRNA treatment (siRRM1 or scramble) and MEL at the indicated doses and time (same condition as Figure 6E). GAPDH served as the loading control for each membrane, and data are representative of at least two independent experiments.

Similar articles

Cited by

References

    1. Hideshima T, Mitsiades C, Tonon G, Richardson PG, Anderson KC. Understanding multiple myeloma pathogenesis in the bone marrow to identify new therapeutic targets. Nat Rev Cancer. 2007;7:585–98. - PubMed
    1. Lonial S, Dimopoulos M, Palumbo A, White D, Grosicki S, Spicka I, et al. Elotuzumab Therapy for Relapsed or Refractory Multiple Myeloma. N Engl J Med. 2015;373:621–31. - PubMed
    1. Lokhorst HM, Plesner T, Laubach JP, Nahi H, Gimsing P, Hansson M, et al. Targeting CD38 with Daratumumab Monotherapy in Multiple Myeloma. N Engl J Med. 2015;373:1207–19. - PubMed
    1. Munshi NC, Anderson KC. New strategies in the treatment of multiple myeloma. Clin Cancer Res. 2013;19:3337–44. - PMC - PubMed
    1. Watanabe R, Tokuhira M, Kizaki M. Current approaches for the treatment of multiple myeloma. Int J Hematol. 2013;97:333–44. - PubMed