. 2017 Jun 5;214(6):1711-1724.
doi: 10.1084/jem.20161707. Epub 2017 Apr 25.

NLRP3 signaling drives macrophage-induced adaptive immune suppression in pancreatic carcinoma

Affiliations

NLRP3 signaling drives macrophage-induced adaptive immune suppression in pancreatic carcinoma

Donnele Daley et al. J Exp Med. .

Abstract

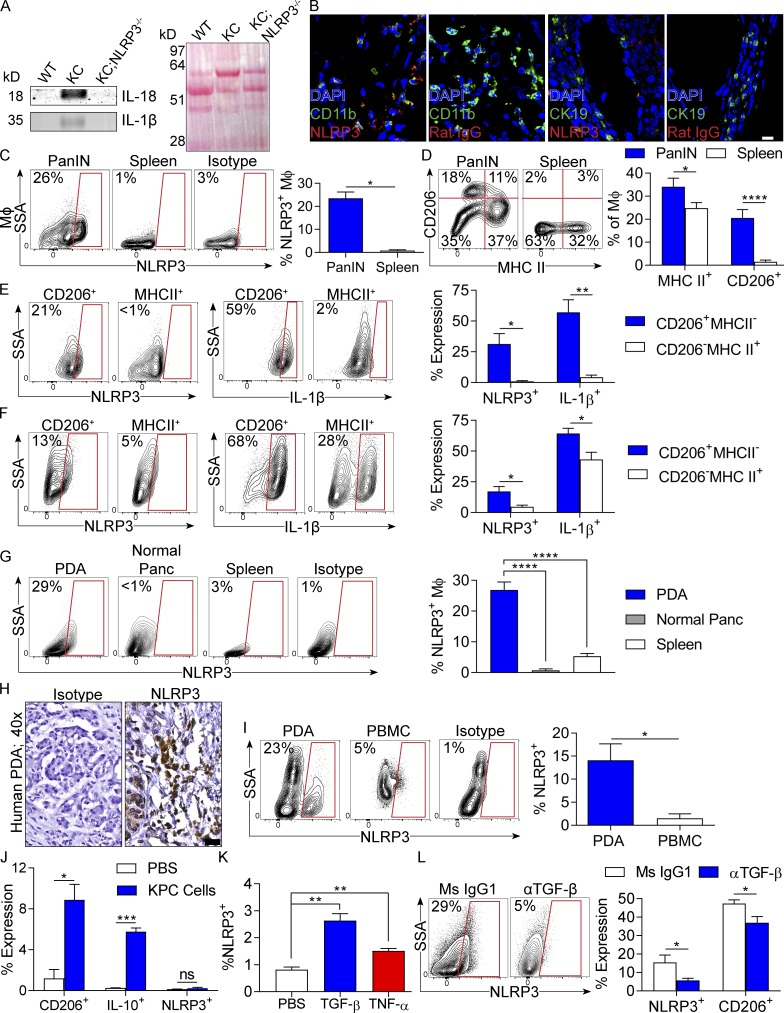
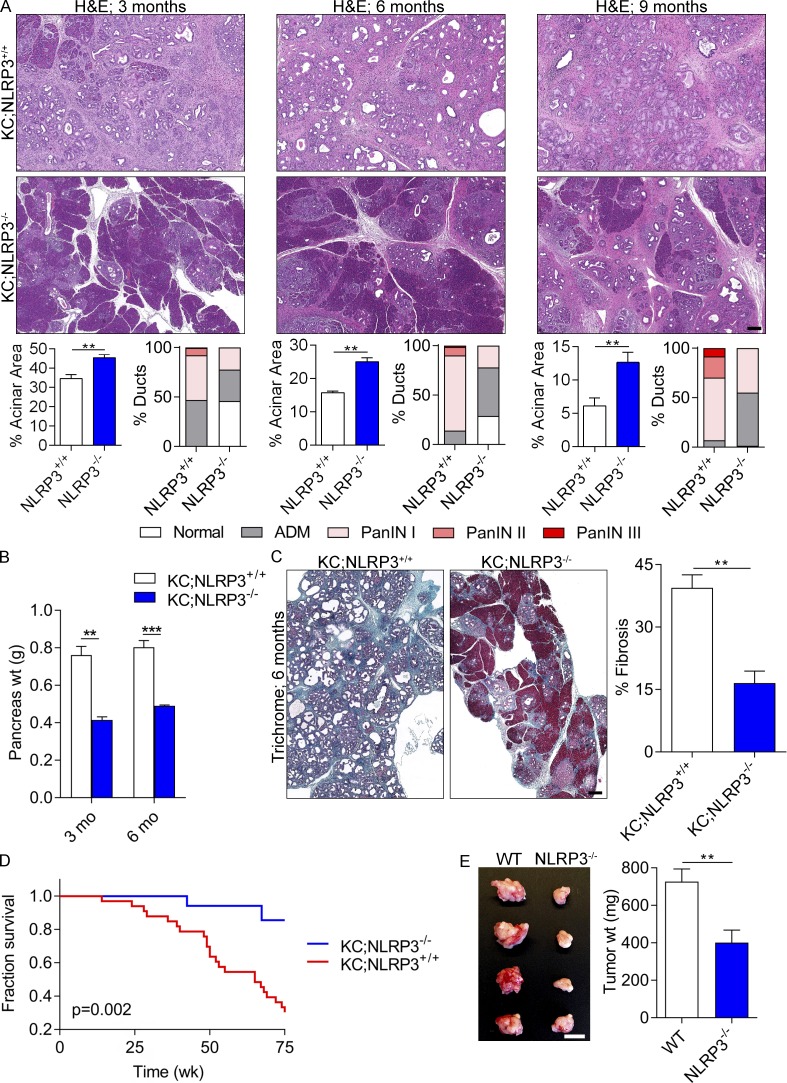
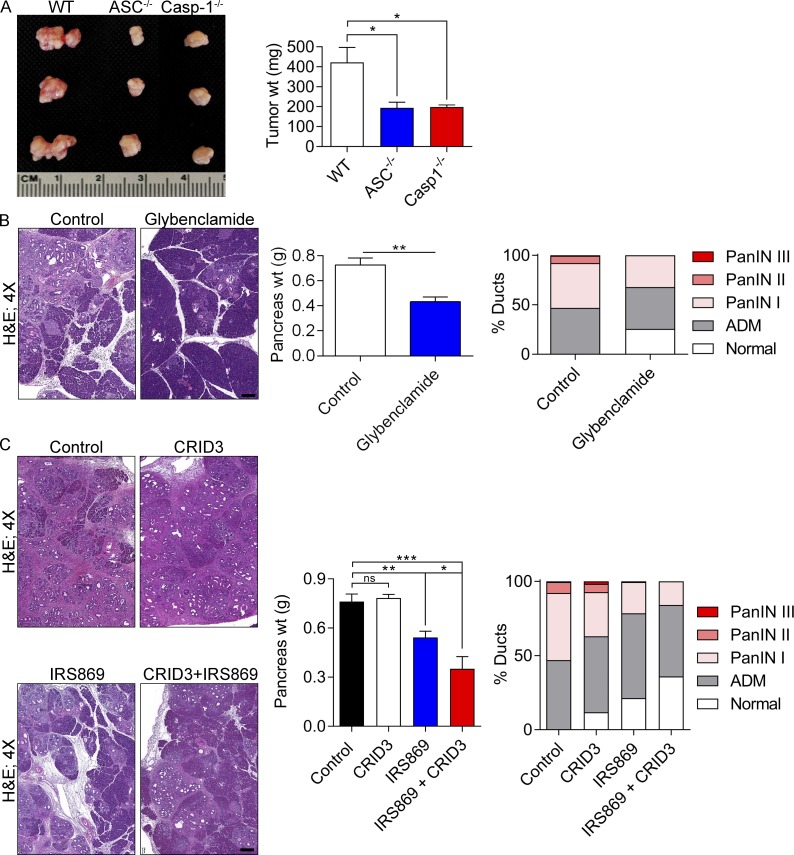
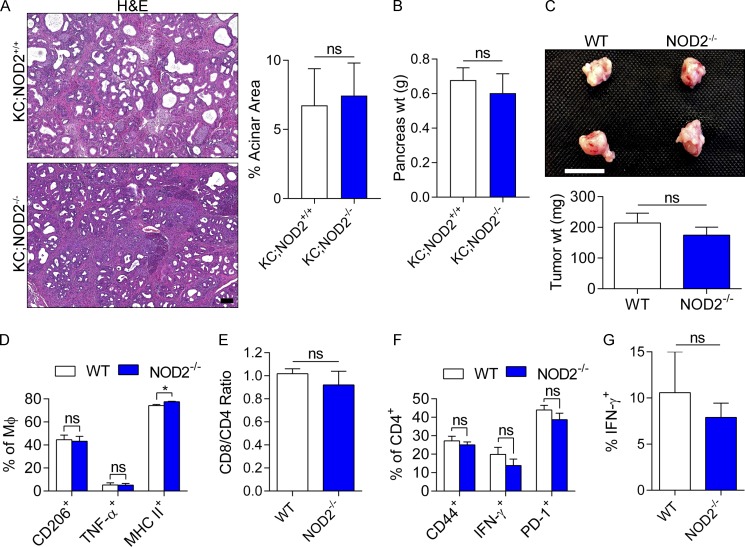
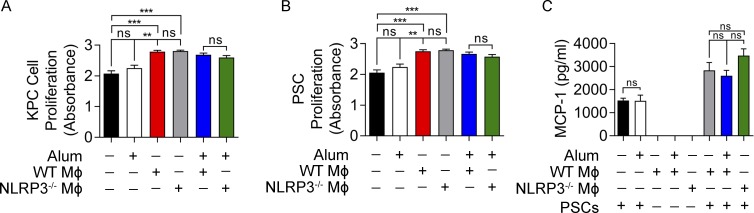
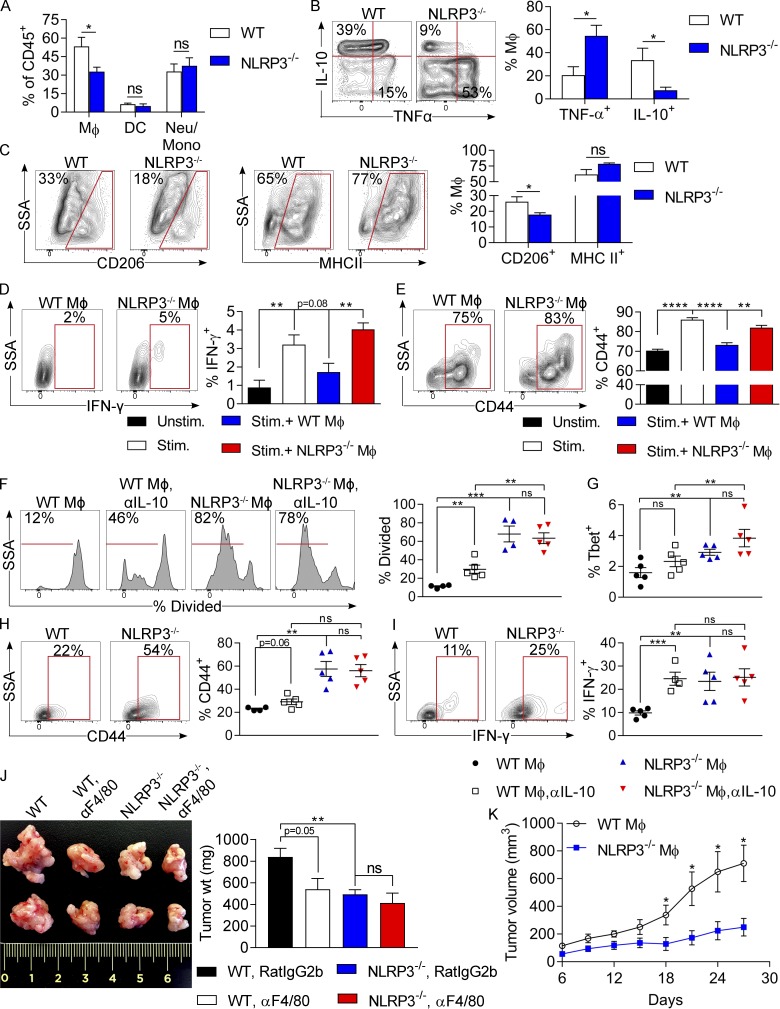
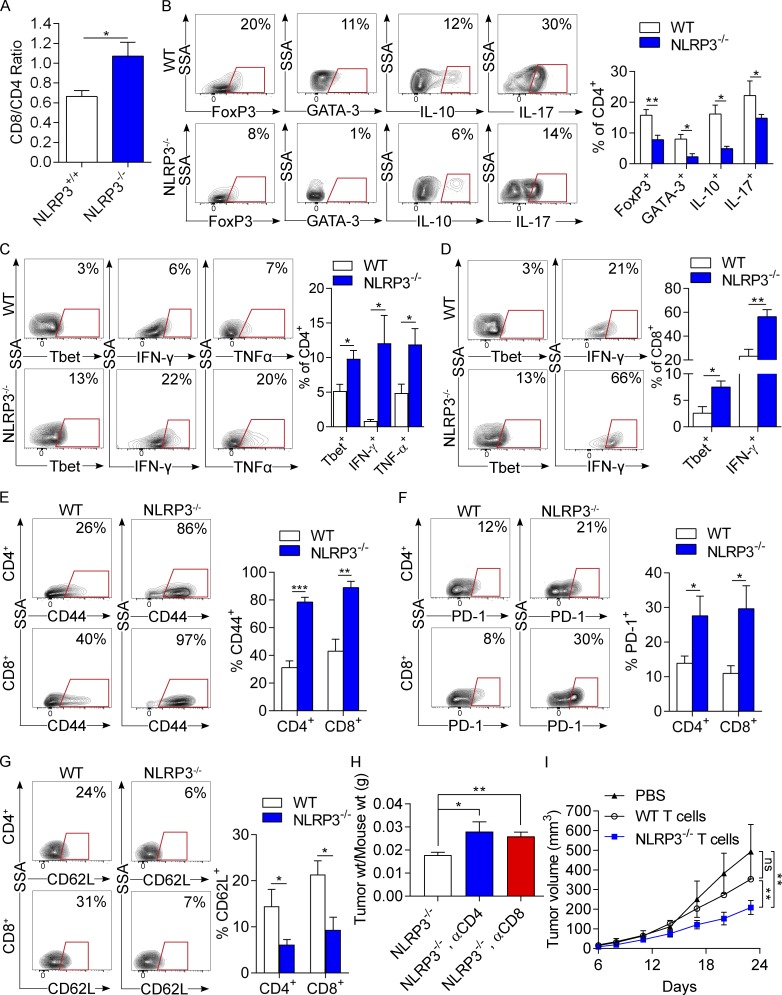
The tumor microenvironment (TME) in pancreatic ductal adenocarcinoma (PDA) is characterized by immune tolerance, which enables disease to progress unabated by adaptive immunity. However, the drivers of this tolerogenic program are incompletely defined. In this study, we found that NLRP3 promotes expansion of immune-suppressive macrophages in PDA. NLRP3 signaling in macrophages drives the differentiation of CD4+ T cells into tumor-promoting T helper type 2 cell (Th2 cell), Th17 cell, and regulatory T cell populations while suppressing Th1 cell polarization and cytotoxic CD8+ T cell activation. The suppressive effects of NLRP3 signaling were IL-10 dependent. Pharmacological inhibition or deletion of NLRP3, ASC (apoptosis-associated speck-like protein containing a CARD complex), or caspase-1 protected against PDA and was associated with immunogenic reprogramming of innate and adaptive immunity within the TME. Similarly, transfer of PDA-entrained macrophages or T cells from NLRP3-/- hosts was protective. These data suggest that targeting NLRP3 holds the promise for the immunotherapy of PDA.


Figures

Figure 1.
Figure 1.
NLRP3 expression in human and mouse PDA. (A) Lysate from 3-mo-old WT, KC, and KC;NLRP3−/− mice were tested for expression of IL-1β and IL-18 by Western blotting. Ponceau staining is shown. Experiments were repeated three times. Representative data are shown. (B) Frozen sections of pancreata of mouse PDA tumors were tested for coexpression of CD11b and NLRP3 or CK19 and NLRP3 compared with respective isotype controls. Bar, 10 µm. (C) F4/80+Gr1CD11cCD11b+ macrophages from pancreata or spleen macrophages from 3-mo-old KC mice were tested for expression of NLRP3 compared with isotype controls. (D) Macrophages from pancreata or spleen of KC mice were tested for coexpression of MHC II and CD206. (E) MHC IICD206+ and MHC II+CD206 pancreatic macrophage subsets from 3-mo-old KC mice were gated and tested for expression of NLRP3 and IL-1β. Representative and quantitative data are shown. Positive gates are based on isotype controls (not depicted). (F) MHC IICD206+ and MHC II+CD206 TAM subsets from WT mice bearing orthotopic PDA were gated and tested for expression of NLRP3 and IL-1β. (G) Macrophages from WT control pancreata or pancreata or spleen of WT mice harboring orthotopic KPC tumors were tested for expression of NLRP3. (H) Paraffin-embedded sections of human PDA were tested for expression of NLRP3 compared with isotype control. Bar, 20 µm. (I) CD15+ monocytic cells from single-cell suspensions of human PDA or PBMCs were gated by flow cytometry and tested for expression of NLRP3. Representative contour plots and quantitative data from six patients are shown. (J) Splenic macrophages from WT mice were cultured alone or in a 5:1 ratio with KPC-derived tumor cells. At 24 h, macrophages were tested for expression of CD206, IL-10, and NLRP3. (K) Similarly, BMDMs from WT mice were stimulated with recombinant TGF-β or TNF and tested for NLRP3 expression. (L) Orthotopic PDA-bearing mice were serially treated with a neutralizing TGF-β mAb or isotype control. Tumors were harvested on day 21, and expression of NLRP3 and CD206 in TAMs was determined by flow cytometry. n = 5/group. All mouse experiments were repeated a minimum of twice using five mice per experimental group. Littermate controls were used. Unpaired Student’s t test was used for statistical analyses. *, P < 0.05; **, P < 0.01; ***, P < 0.001; ****, P < 0.0001. Data are presented as mean ± standard error. MΦ, macrophage; Ms, mouse; Panc, pancreas; PanIN, pancreatic intraepithelial neoplasia; SSA, side scatter.
Figure 2.
Figure 2.
NLRP3 deletion or blockade is protective against PDA. (A) KC;NLRP3+/+ and KC;NLRP3−/− mice were sacrificed at 3, 6, or 9 mo of life (means of six to seven mice per time point). Representative H&E-stained sections are shown. The percentage of pancreatic area occupied by intact acinar structures and the fractions of ductal structures exhibiting normal morphology, acinoductal metaplasia (ADM), or graded pancreatic intraepithelial neoplasia (PanIN) I–III lesions were calculated. Bar, 200 µm. (B) Weights of pancreata were compared in 3- and 6-mo-old KC;NLRP3+/+ and KC;NLRP3−/− mice. (C) Pancreata of 6-mo-old KC;NLRP3+/+ and KC;NLRP3−/− mice were stained with trichrome, and the percentage of fibrotic pancreas’ area was calculated. Bar, 200 µm. Unpaired Student’s t test was used for statistical analyses. (D) Kaplan-Meier survival analysis was performed for KC;NLRP3+/+ (n = 29) and KC;NLRP3−/− (n = 24) mice. P = 0.002 based on the Wilcoxon test. (E) WT and NLRP3−/− mice were challenged with orthotopically implanted KPC-derived tumor cells. Mice were sacrificed at 21 d, and pancreatic tumors were photographed and weighed. n = 8/group. Bar, 1 cm. Orthotopic tumor experiments were repeated more than five times with similar results. Unpaired Student’s t test was used for statistical analyses. Mice were bred in house, and littermate controls were used. **, P < 0.01; ***, P < 0.001. Data are presented as mean ± standard error.
Figure 3.
Figure 3.
ASC or caspase-1 deletion and NLRP3 inhibition are protective in murine disease. (A) WT, ASC−/−, and caspase-1−/− mice were orthotopically implanted with KPC-derived tumor cells. At 21 d, intrapancreatic tumors were harvested. Representative photographs of tumors and quantitative analysis of tumor weights are shown for each group. n = 5/group. (B) 6-wk-old KC mice were serially treated for 8 wk with Glybenclamide or vehicle before sacrifice. Pancreata were harvested, weighed, and analyzed for ductal dysplasia based on H&E staining. n = 5/group. Bar, 200 µm. (C) 6-wk-old KC mice were serially treated for 8 wk with vehicle, a TLR9 oligonucleotide inhibitor (IRS869), CRID3, or IRS869 + CRID3. Pancreata were harvested, weighed, and analyzed by H&E staining. n = 5/group. Bar, 200 µm. Littermate controls were used in all experiments, and experiments were reproduced twice. Unpaired Student’s t test was used for statistical analyses. *, P < 0.05; **, P < 0.01; ***, P < 0.001. ADM, acinoductal metaplasia; PanIN, pancreatic intraepithelial neoplasia.
Figure 4.
Figure 4.
NOD2 deletion is not protective against PDA. (A and B) Cohorts of KC and KC;NOD2−/− mice were sacrificed at 6 mo of life. Mean n = 6/group. (A) Representative H&E-stained sections are shown, and the fraction of preserved acinar area was calculated (P = NS). Bar, 200 µm. (B) Pancreas weights (wt) were recorded (P = NS). (C–G) WT and NOD2−/− mice were orthotopically implanted with KPC-derived tumor cells. (C) Mice were sacrificed at 21 d. Representative gross pictures of tumors and mean tumor weights are shown (P = NS). n = 5/group. Bar, 1 cm. (D) Expression of CD206, TNF, and MHC II in TAMs were determined by flow cytometry. *, P < 0.05. MΦ, macrophage. (E–G) Similarly, the intratumoral CD8+/CD4+ T cell ratio (P = NS; E), CD4+ T cell expression of CD44, IFN-γ, and PD-1 (F), and CD8+ T cell expression of IFN-γ (G) were assessed (P = NS). Orthotopic tumor experiments in NOD2−/− mice were repeated four times with similar results, and littermate controls were used. Unpaired Student’s t test was used for statistical analyses.
Figure 5.
Figure 5.
NLRP3 signaling does not enable TAMs to directly induce tumor cell proliferation or PSC activation. (A) KPC tumor cells were cultured alone or with the NLRP3 agonist alum, WT macrophages, or NLRP3−/− macrophages FACS sorted from orthotopic PDA tumors, in single or in the indicated combinations. Tumor cell proliferation was measured using the XTT assay. (B and C) PSCs were cultured alone or with the NLRP3 agonist alum, WT macrophages, or NLRP3−/− macrophages, in single or in the indicated combinations. (B) PSC proliferation was measured using the XTT assay. (C) MCP-1 was measured in the cell culture supernatant. All experiments were performed in replicates of five and repeated twice with similar results. Unpaired Student’s t test was used for statistical analyses. **, P < 0.01; ***, P < 0.001. Data are presented as mean ± standard error. MΦ, macrophage.
Figure 6.
Figure 6.
NLRP3 deletion induces immunogenic reprogramming of TAMs. (A) WT and NLRP3−/− mice were orthotopically implanted with KPC-derived tumor cells. Tumors were harvested at 3 wk. The fraction of tumor-infiltrating Gr1CD11cCD11b+F4/80+ macrophages, CD11c+MHCII+F4/80 DCs, and Gr1+CD11b+ neutrophils and inflammatory monocytes were determined by flow cytometry. (B and C) PDA-infiltrating macrophages in WT and NLRP3−/− hosts were gated and tested for expression of TNF and IL-10 (B) and CD206 and MHC II (C). Experiments were reproduced greater than three times using five mice per group. (D and E) Splenic CD8+ T cells from untreated WT mice were cultured in 96-well plates, either unstimulated or stimulated with αCD3/αCD28 alone or in co-culture with PDA-infiltrating WT or NLRP3−/− TAMs. CD8+ T cell expression of IFN-γ (D) and CD44 (E) were determined at 72 h by flow cytometry. (F–I) TAMs were harvested from orthotopic KPC tumors in WT and NLRP3−/− hosts, pulsed with OVA257–264 peptide, and plated with CFSE-labeled CD8+ OT-I T cells. (F) T cell proliferation at 96 h was determined by dilution of CFSE. (G–I) T-bet (G), CD44 (H), and IFN-γ (I) expression in the CD8+ T cells was assessed by flow cytometry. Experiments were performed using five biological replicates per group and repeated twice. Unpaired Student’s t test was used for statistical analyses. (J) WT and NLRP3−/− mice were orthotopically implanted with KPC-derived tumor cells and serially treated with neutralizing αF4/80 mAb or isotype control. Cohorts of mice were sacrificed on day 21. Representative images and quantitative data on tumor weights are shown. n = 5/group. Unpaired Student’s t test was used for statistical analyses. (K) Littermate NLRP3−/− mice were subcutaneously implanted with KPC-derived PDA tumor cells admixed with tumor-entrained WT or NLRP3−/− macrophages. Tumor volume was recorded at serial intervals. Adoptive transfer experiments were repeated twice. n = 5/group. Unpaired Student’s t-test was used for statistical analyses. *, P < 0.05; **, P < 0.01; ***, P < 0.001; ****, P < 0.0001. Data are presented as mean ± standard error. Mono, monocyte; Neu, neutrophil; SSA, side scatter; Stim., stimulated; Unstim., unstimulated; wt, weight.
Figure 7.
Figure 7.
NLRP3 deletion results in immunogenic T cell differentiation in PDA. (A–G) WT and NLRP3−/− mice were orthotopically implanted with KPC-derived tumor cells. Tumors were harvested at 3 wk, and single-cell suspensions were analyzed by flow cytometry. (A) The CD8+/CD4+ T cell ratio was calculated. (B) Tumor-infiltrating CD4+ T cells were gated and tested for expression of FoxP3, GATA-3, IL-10, and IL-17. (C) CD4+ T cells were also tested for T-bet, IFN-γ, and TNF expression. (D) CD8+ T cells were gated and tested for expression of T-bet and IFN-γ. (E–F) Intratumoral CD4+ and CD8+ T cells were analyzed for expression of CD44 (E), PD-1 (F), and CD62L (G). Each experiment was repeated more than three times, using at least four mice per group. Representative contour plots and quantitative data are shown. Unpaired Student’s t test was used for statistical analyses. (H) Cohorts of littermate NLRP3−/− animals serially treated with neutralizing αCD4 or αCD8 mAbs or isotype were challenged with orthotopic PDA. Mice were sacrificed at 21 d, and pancreatic tumors were weighed. (I) Littermate WT mice were subcutaneously implanted with KPC-derived PDA tumor cells alone or admixed with tumor-entrained CD3+ WT or NLRP3−/− T cells. Tumor volume was recorded at serial intervals. T cell depletion and T cell adoptive transfer experiments were repeated twice. n = 5/group. Unpaired Student’s t test was used for statistical analyses. *, P < 0.05; **, P < 0.01; ***, P < 0.001. Data are presented as mean ± standard error. SSA, side scatter; wt, weight.

References

    1. Allen I.C., TeKippe E.M., Woodford R.M., Uronis J.M., Holl E.K., Rogers A.B., Herfarth H.H., Jobin C., and Ting J.P.. 2010. The NLRP3 inflammasome functions as a negative regulator of tumorigenesis during colitis-associated cancer. J. Exp. Med. 207:1045–1056. 10.1084/jem.20100050 - DOI - PMC - PubMed
    1. Clark C.E., Hingorani S.R., Mick R., Combs C., Tuveson D.A., and Vonderheide R.H.. 2007. Dynamics of the immune reaction to pancreatic cancer from inception to invasion. Cancer Res. 67:9518–9527. 10.1158/0008-5472.CAN-07-0175 - DOI - PubMed
    1. Coll R.C., Robertson A., Butler M., Cooper M., and O’Neill L.A.. 2011. The cytokine release inhibitory drug CRID3 targets ASC oligomerisation in the NLRP3 and AIM2 inflammasomes. PLoS One. 6:e29539 10.1371/journal.pone.0029539 - DOI - PMC - PubMed
    1. Daley D., Zambirinis C.P., Seifert L., Akkad N., Mohan N., Werba G., Barilla R., Torres-Hernandez A., Hundeyin M., Mani V.R., et al. . 2016. γδ T cells support pancreatic oncogenesis by restraining αβ T cell activation. Cell. 166:1485–1499.e15. 10.1016/j.cell.2016.07.046 - DOI - PMC - PubMed
    1. Demols A., Le Moine O., Desalle F., Quertinmont E., Van Laethem J.L., and Devière J.. 2000. CD4+ T cells play an important role in acute experimental pancreatitis in mice. Gastroenterology. 118:582–590. 10.1016/S0016-5085(00)70265-4 - DOI - PubMed

MeSH terms