. 2017 May 16;8(20):33807-33826.
doi: 10.18632/oncotarget.16995.

Pharmacologic targeting ERK1/2 attenuates the development and progression of hyperuricemic nephropathy in rats

Affiliations

Pharmacologic targeting ERK1/2 attenuates the development and progression of hyperuricemic nephropathy in rats

Na Liu et al. Oncotarget. .

Abstract

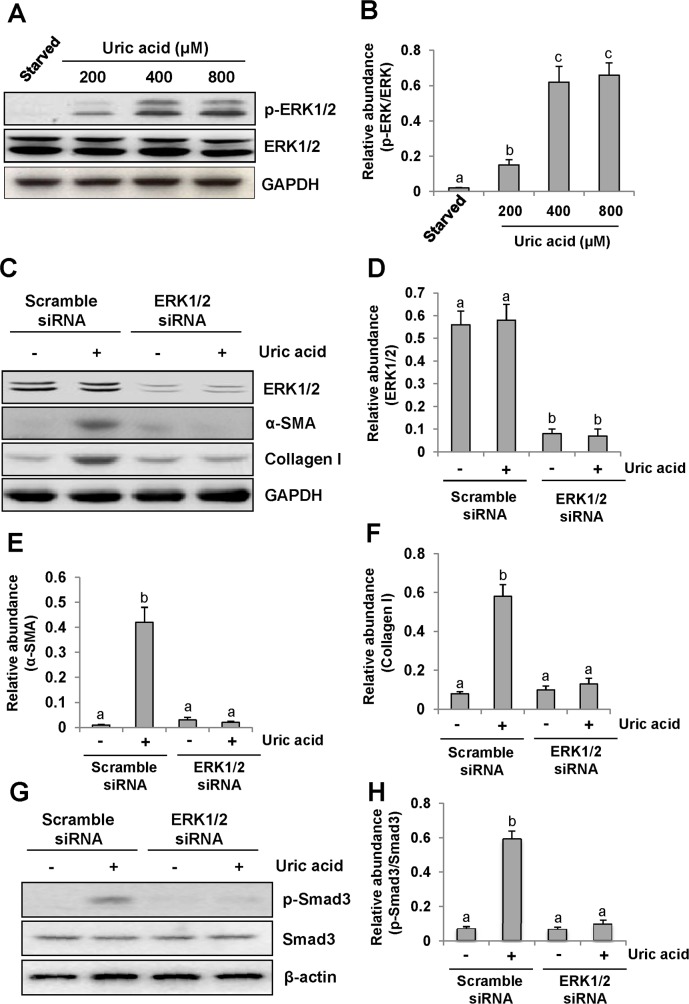
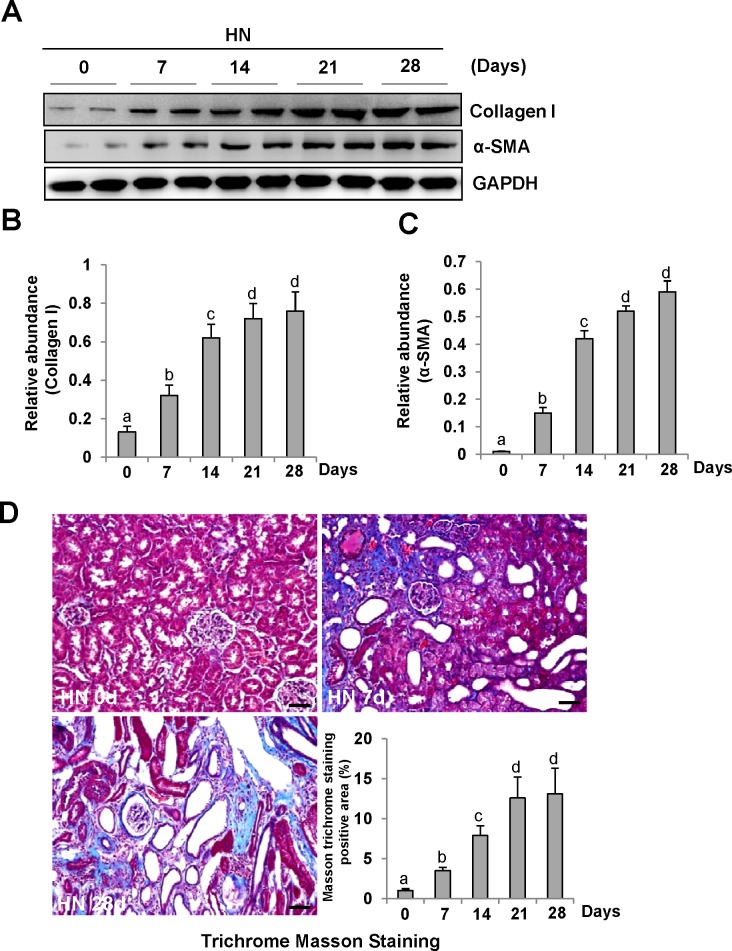
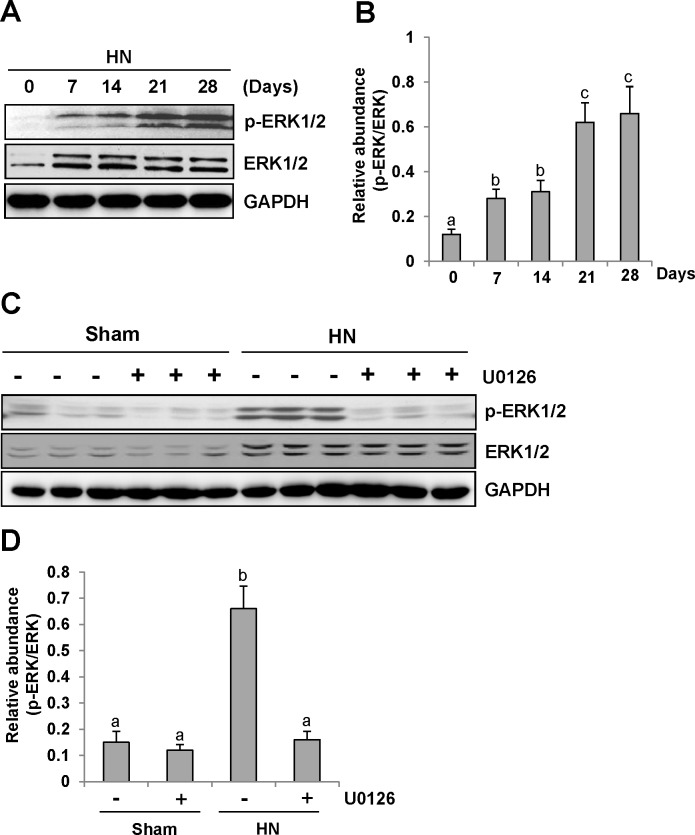
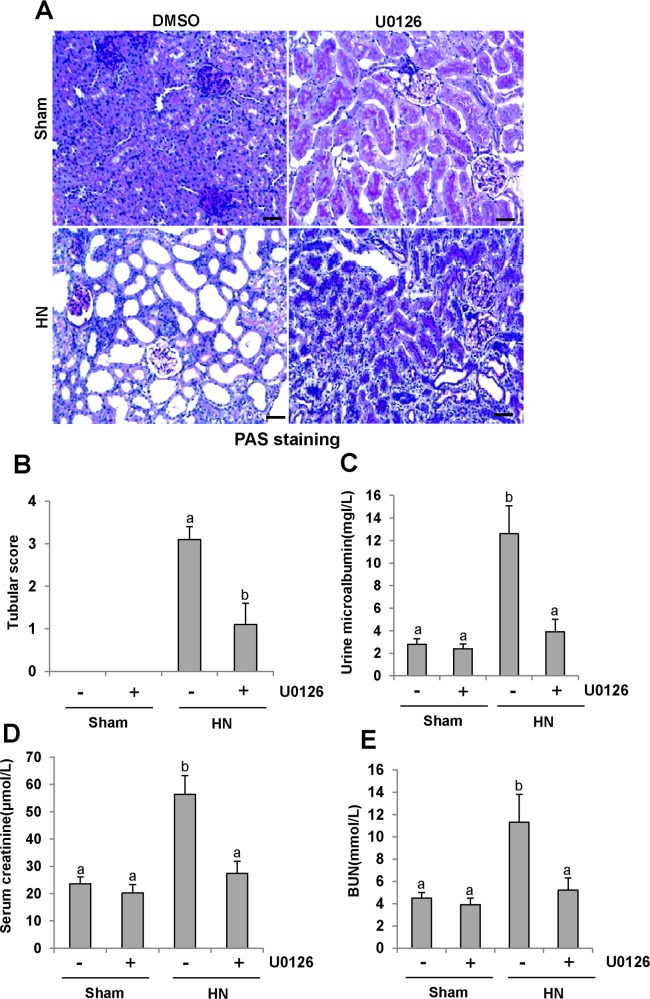
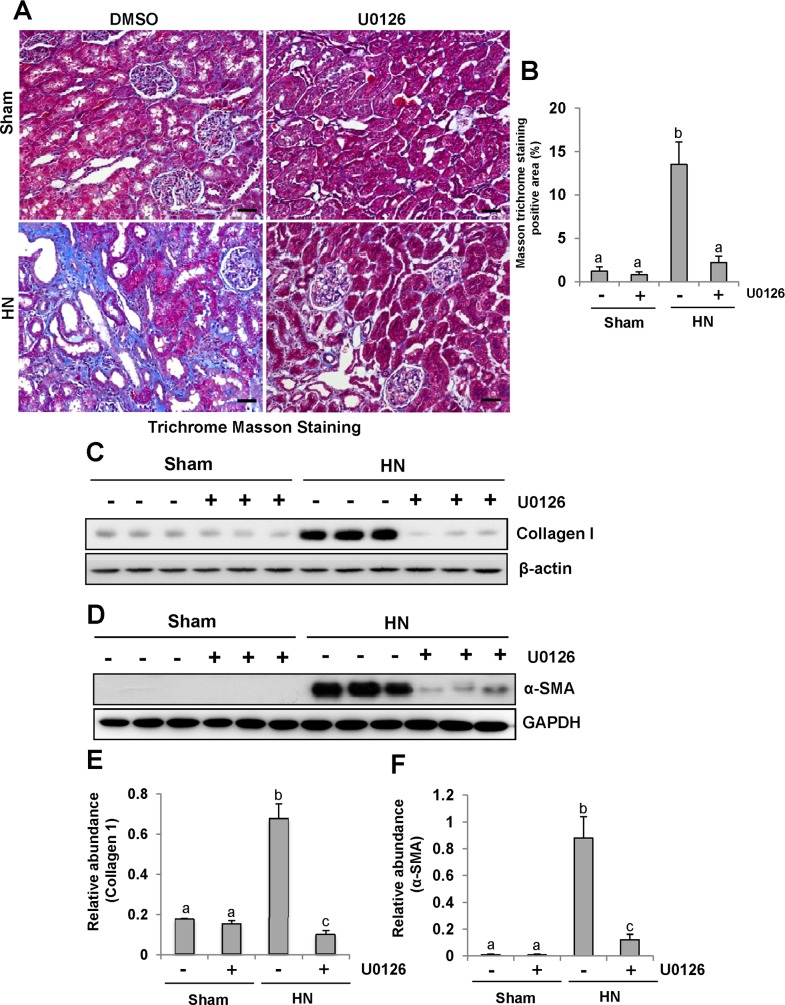
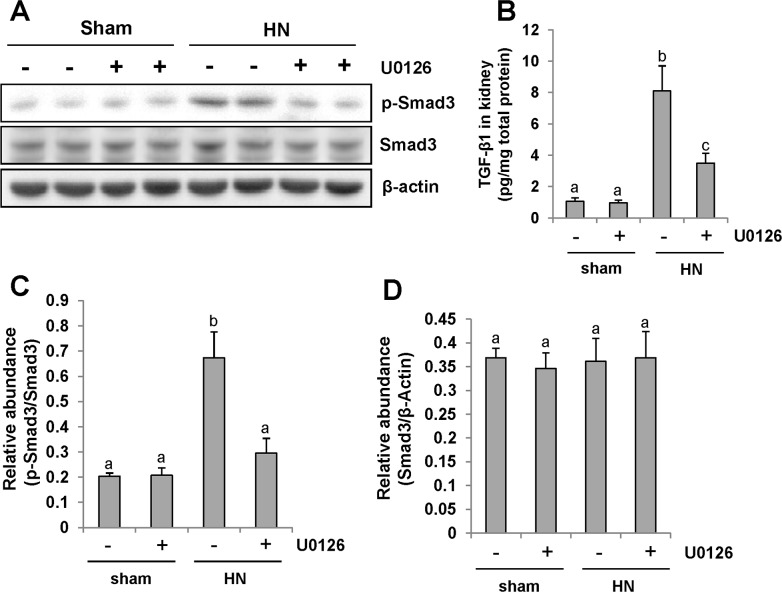
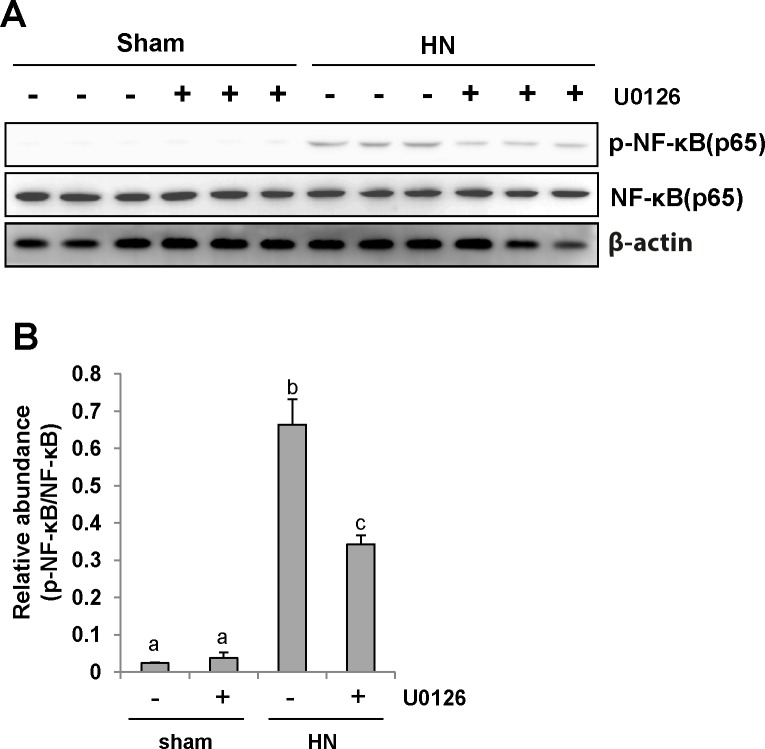
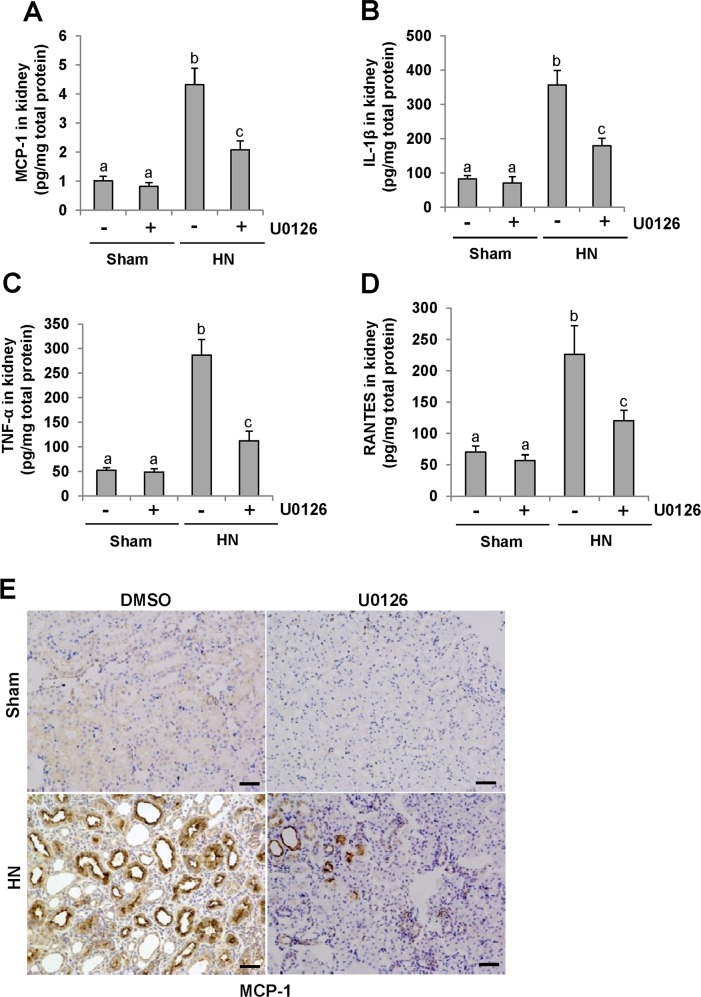
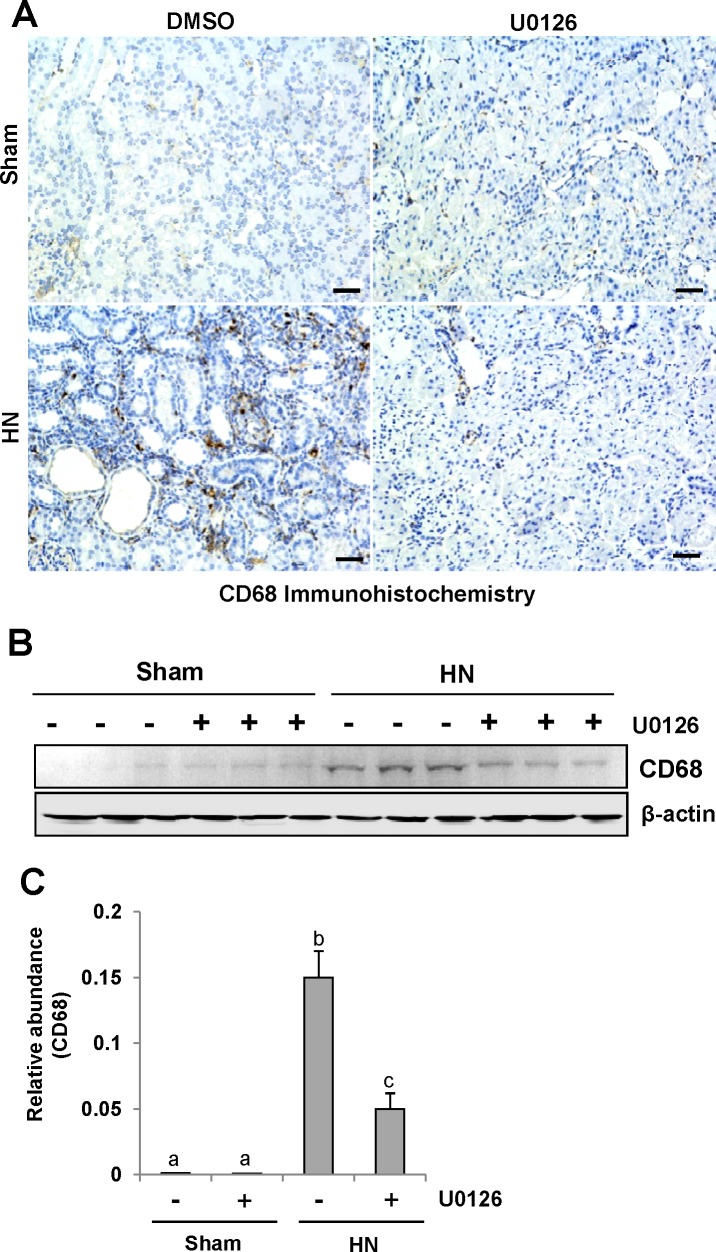
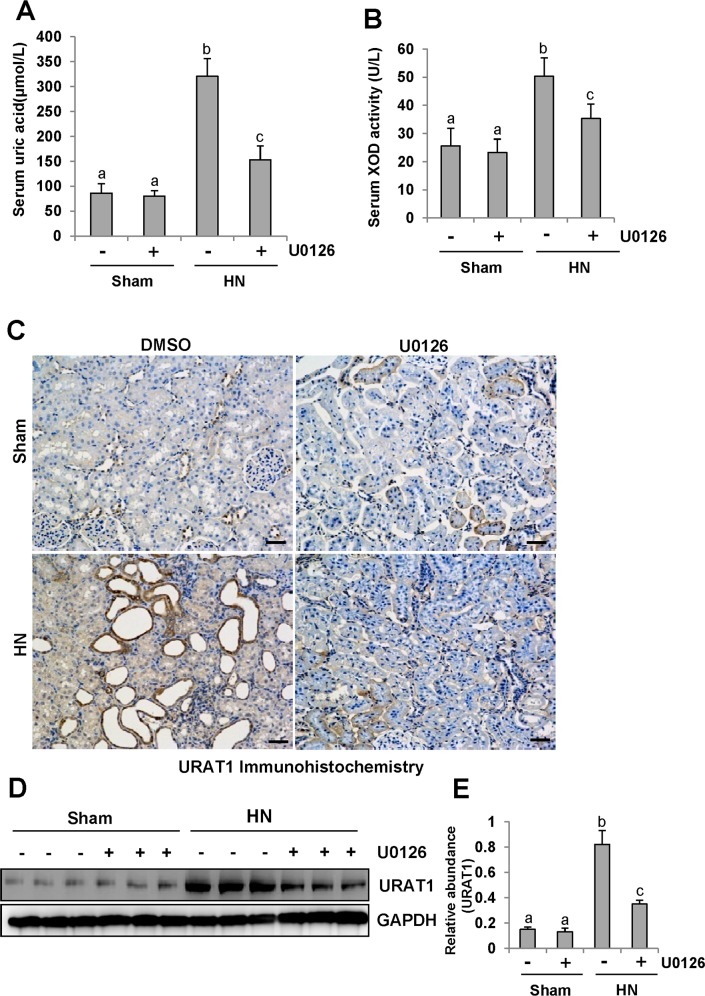
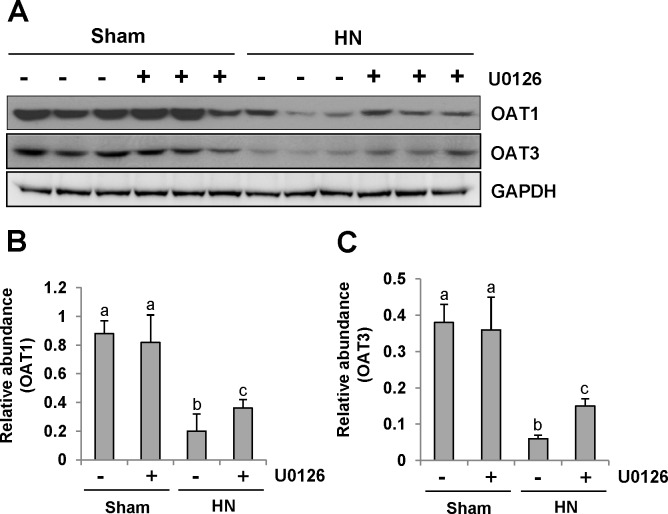
The pathogenesis of hyperuricemia-induced chronic kidney disease is largely unknown. In this study, we investigated whether extracellular signal-regulated kinases1/2 (ERK1/2) would contribute to the development of hyperuricemic nephropathy (HN). In a rat model of HN induced by feeding mixture of adenine and potassium oxonate, increased ERK1/2 phosphorylation and severe glomerular sclerosis and renal interstitial fibrosis were evident, in parallel with diminished levels of renal function and increased urine microalbumin excretion. Administration of U0126, which is a selective inhibitor of the ERK1/2 pathway, improved renal function, decreased urine microalbumin and inhibited activation of renal interstitial fibroblasts as well as accumulation of extracellular proteins. U0126 also inhibited hyperuricemia-induced expression of multiple profibrogenic cytokines/chemokines and infiltration of macrophages in the kidney. Furthermore, U0126 treatment suppressed xanthine oxidase, which mediates uric acid production. It also reduced expression of the urate anion exchanger 1, which promotes reabsorption of uric acid, and preserved expression of organic anion transporters 1 and 3, which accelerate uric acid excretion in the kidney of hyperuricemic rats. Finally, U0126 inhibited phosphorylation of Smad3, a key mediator in transforming growth factor (TGF-β) signaling. In cultured renal interstitial fibroblasts, inhibition of ERK1/2 activation by siRNA suppressed uric acid-induced activation of renal interstitial fibroblasts. Collectively, pharmacologic targeting of ERK1/2 can alleviate HN by suppressing TGF-β signaling, reducing inflammation responses, and inhibiting the molecular processes associated with elevation of blood uric acid levels in the body. Thus, ERK1/2 inhibition may be a potential approach for the prevention and treatment of hyperuricemic nephropathy.

Keywords: ERK1/2; TGF-β/Smad signaling pathway; hyperuricemic nephropathy; inflammation; urate transporters.


Conflict of interest statement

CONFLICTS OF INTEREST

No authors have any competing interests.

Figures

Figure 1
Figure 1. Uric acid dose-dependently induces ERK1/2 phosphorylation in cultured renal interstitial fibroblasts and the effect of ERK1/2 silencing on the activation of renal interstitial fibroblasts
Cultured NRK-49F cells were starved for 24h and then exposed to various concentrations of uric acid (0-800 μM) for 36h. Then, cell lysates were subjected to immunoblot analysis with antibodies against p-ERK1/2, ERK1/2 or glyceraldehyde 3-phosphate dehydrogenase (GAPDH) (A and B). The level of p-ERK1/2 was quantified by densitometry and normalized with ERK1/2(B). Serum starved NRK-49F cells were transfected with siRNA targeting ERK1/2 or scrambled siRNA and then exposed to uric acid (800 μM) for 36h (C). Cells lysates were subjected to immunoblot analysis with antibodies against ERK1/2, α-SMA, Collagen-I or GAPDH. Expression levels of ERK1/2, α-SMA or Collagen-I were quantified by densitometry and normalized with GAPDH (D-F). In addition, immunoblot analysis was also performed with antibodies against p-Smad3, Smad3 or β-actin and p-Smad3was quantified by densitometry and normalized with Smad3 (G and H). Values are means±SDs of at least three independent experiments. Bars with different letters (a-c) for each molecule are significantly different from one another (P<0.05).
Figure 2
Figure 2. Activation of renal interstitial fibroblasts in the kidney of hyperuricemic rats in a time-dependent manner
(A) The kidneys were taken for immunoblot analysis of Collagen-I, α-SMA or glyceraldehyde 3-phosphate dehydrogenase(GAPDH); the representative results with two samples are shown. (B and C) Expression levels of Collagen I or α-SMA were quantified by densitometry and normalized with GAPDH. (C) Photomicrographs illustrating Masson trichrome staining of kidney after feeding with adenine and potassium oxonate at different times. (D) The graph shows the fibrosis score of Masson-positive area (blue) from ten random fields (original magnification, ×200) of rat kidney samples. Data are represented as the mean±SEM (n=6). Means with different letters are significantly different from one another (P<0.05). The scale bar in all of the images is 20 μm.
Figure 3
Figure 3. U0126 inhibits ERK1/2 activation in the kidney of hyperuricemic rats
(A) ERK1/2 was activated in the kidney of HN rats in a time-dependent manner. The kidneys were taken for immunoblot analysis of p-ERK1/2, ERK1/2 or glyceraldehyde 3-phosphate dehydrogenase (GAPDH); the representative results are shown. (B and D) Expression level of p-ERK1/2 was quantified by densitometry and normalized with total ERK1/2. (C) Rat model of HN was established by feeding with adenine and potassium oxonate daily. In some rats, U0126 were simultaneously administrated intraperitoneally. After 28 days, the kidneys were taken for immunoblot analysis of p-ERK1/2, ERK1/2 or GAPDH. Data are represented as the mean±SEM (n=6). Means with different letters are significantly different from one another (P<0.05).
Figure 4
Figure 4. U0126 halts progression of proteinuria and improves renal function and kidney pathology in hyperuricemic rats
(A) Photomicrographs (original magnification×200) illustrate periodic acid-Schiff staining of the kidney tissues in control or HN rats with or without U0126. (B) Morphologic changes were scored on the basis of the scale described in the Concise Methods section. (C) Urine microalbumin. (D) Expression level of serum creatinine was examined using automatic biochemistry assay. (E) Serum BUN. Data are represented as the mean±SEM (n=6). Means with different letters are significantly different from one another (P<0.05). The scale bar in all of the images is 20 μm.
Figure 5
Figure 5. U0126 alleviates the development and progression of renal fibrogenesis in hyperuricemic rats
(A) Photomicrographs illustrating Masson trichrome staining of kidney tissue collected at day 28 after feeding of mixture of adenine and potassium oxonate with or without U0126. (B) The graph shows the percentage of Masson-positive tubulointerstitial area (original magnification, ×200). The kidney tissue lysates were subjected to immunoblot analysis with specific antibodies against collagen I or-β-actin(C), as well as α-SMA or GAPDH (D). (E) Expression level of collagen I was quantified by densitometry and normalized with β-actin. (F) Expression level of α-SMA was quantified by densitometry and normalized with GAPDH. Data are represented as the mean±SEM (n=6). Means with different letters are significantly different from one another (P<0.05). The scale bar in all of the images is 20 μm.
Figure 6
Figure 6. Pharmacologic blockade of ERK1/2 activity suppresses TGF-β1 signaling in the kidney of hyperuricemic rats
(A) The kidneys were taken from immunoblot analysis of p-Smad3, Smad3, or β-actin. (B) Protein was extracted from the kidneys of rats after feeding of the mixture of adenine and potassium oxonate with or without U0126 and subjected to ELISA as described in the Concise Method section. Protein expression level of TGF-β1 was indicated. (C) Expression level of p-Smad3 was quantified by densitometry and normalized with total Smad3. (D) Expression level of Smad3 was quantified by densitometry and normalized with β-actin. Data are represented as the mean±SEM (n=6). Means with different letters are significantly different from one another (P<0.05).
Figure 7
Figure 7. U0126 inhibits NF-κB pathway activation in the kidney of hyperuricemic rats
(A) The kidney tissue lysates were subjected to immunoblot analysis with specific antibodies against p-NF-κB(p65), NF-κB (p65), or β-actin. (B) Expression level of p-NF-κB (p65) was quantified by densitometry and normalized with NF-κB (p65). Data are represented as the mean±SEM (n=6). Means with different letters are significantly different from one another (P<0.05).
Figure 8
Figure 8. U0126 reduces the expression of MCP-1, IL-1β, TNF-α and RANTES in the kidney of hyperuricemic rats
(A) Protein was extracted from the kidneys of rats after feeding of the mixture of adenine and potassium oxonate with or without U0126 treatment and subjected to ELISA as described in the Concise Methods section. Protein expression level of MCP-1 was indicated. (B) IL-1β. (C) TNF-α. (D) RANTES. (E) Photomicrographs (original magnification ×200) illustrate MCP-1 staining of the kidney tissues. Data are represented as the mean±SEM (n=6). Means with different letters are significantly different from one another (P<0.05). The scale bar in all of the images is 20 μm.
Figure 9
Figure 9. U0126 inhibits macrophage infiltration in the kidney of hyperuricemic rats
(A) Photomicrographs (original magnification ×200) illustrate CD68 staining of the kidney tissues. (B) The kidney tissue lysates were subjected to immunoblot analysis with specific antibodies against CD68 or β-actin. (C) Expression level of CD68 was quantified by densitometry and normalized with β-actin. Data are represented as the mean±SEM (n=6). Means with different letters are significantly different from one another (P<0.05). The scale bar in all of the images is 20 μm.
Figure 10
Figure 10. ERK1/2 inhibition reduced serum uric acid and XOD activity and preserved the expression of one key urate transporters
(A) Expression level of serum uric acid was examined using automatic biochemistry assay (P800; Modular). (B) Serum XOD activity was examined by XOD kit. (C) Photomicrographs (original magnification ×200) illustrate URAT1 staining of the kidney tissues. (D) The kidney tissue lysates were subjected to immunoblot analysis with specific antibodies against URAT1 or glyceraldehyde 3-phosphate dehydrogenase (GAPDH). (E) Expression level of URAT1 was quantified by densitometry and normalized with GAPDH. Data are represented as the mean±SEM (n=6). Means with different letters are significantly different from one another (P<0.05). The scale bar in all of the images is 20 μm.
Figure 11
Figure 11. U0126 administration preserves the expression of two key urate transporters
(A) The kidney tissue lysates were subjected to immunoblot analysis with specific antibodies against OAT1, OAT3 or glyceraldehyde 3-phosphate dehydrogenase (GAPDH). (B) Expression level of OAT1 was quantified by densitometry and normalized with GAPDH. (C) Expression level of OAT3 was quantified by densitometry and normalized with GAPDH. Data are represented as the mean±SEM (n=6). Means with different letters are significantly different from one another (P<0.05).

Similar articles

Cited by

References

    1. Levey AS, Atkins R, Coresh J, Coresh J. Chronic kidney diseaseas a global public health problem: approaches and initiatives-aposition statement from Kidney Disease Improving Global Outcomes. Kidney Int. 2007;72:247–259. - PubMed
    1. Fried LF. Higher incidence of ESRD than mortality in theAASK study. J Am SocNephrol. 2010;21:1244–1246. - PubMed
    1. Tsuruta Y, Mochizuki T, Moriyama T, Itabashi M, Takei T, Tsuchiya K, Nitta K. Switching from allopurinol to febuxostat for the treatment of hyperuricemia and renal function in patients with chronic kidney disease. ClinRheumatol. 2014;33:1643–1648. - PMC - PubMed
    1. Shi Y, Chen W, Jalal D, Li Z, Chen W, Mao H, Yang Q, Johnson RJ, Yu X. Clinical outcome of hyperuricemia in IgAnephropathy: a retrospective cohort study and randomized controlled trial. Kidney Blood Press Res. 2012;35:153–160. - PMC - PubMed
    1. Sonoda H, Takase H, Dohi Y, Kimura G. Uric acid levels predict future development of chronic kidney disease. Am J Nephrol. 2011;33:352–357. - PubMed

MeSH terms