. 2016 Dec 5;6(1):1.
doi: 10.1038/s41598-016-0001-8.

Ultrastructural Characterization of the Lower Motor System in a Mouse Model of Krabbe Disease

Affiliations

Ultrastructural Characterization of the Lower Motor System in a Mouse Model of Krabbe Disease

Valentina Cappello et al. Sci Rep. .

Abstract

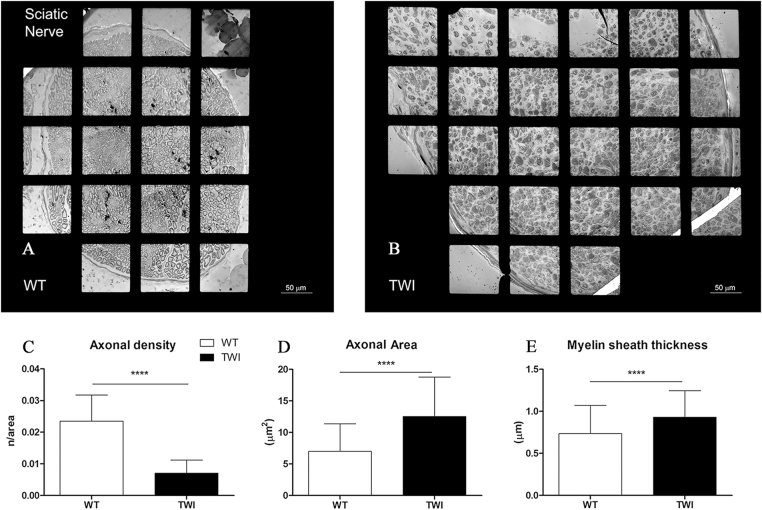
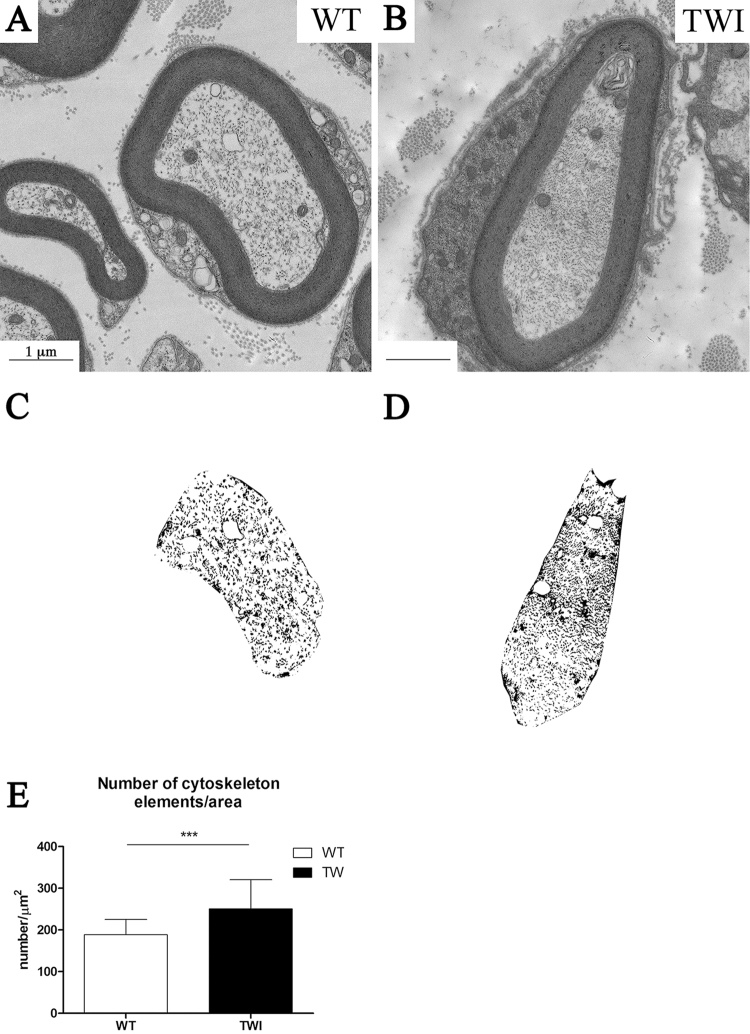
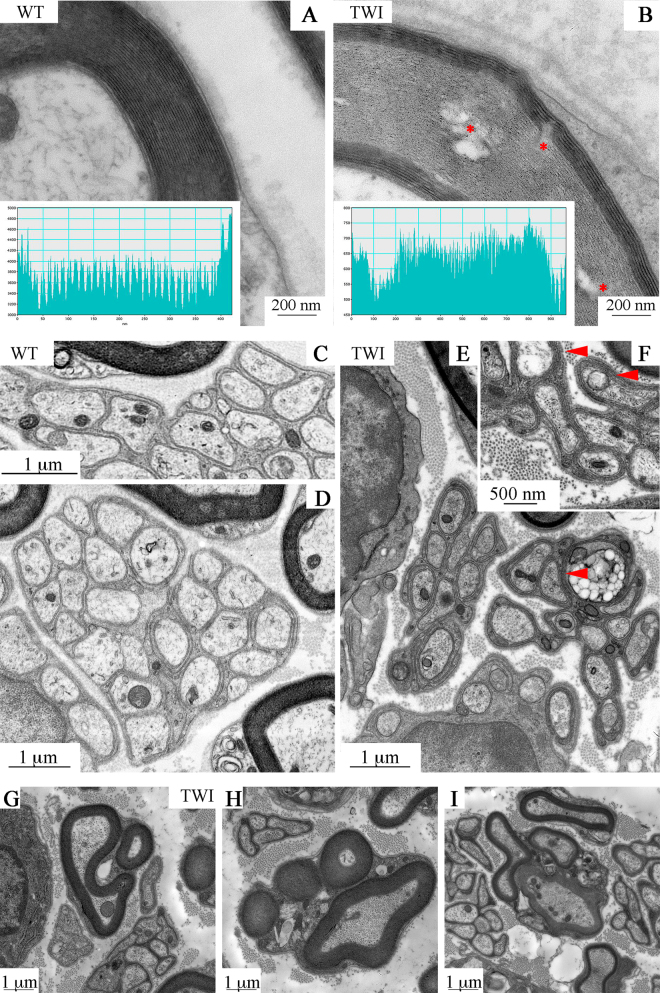
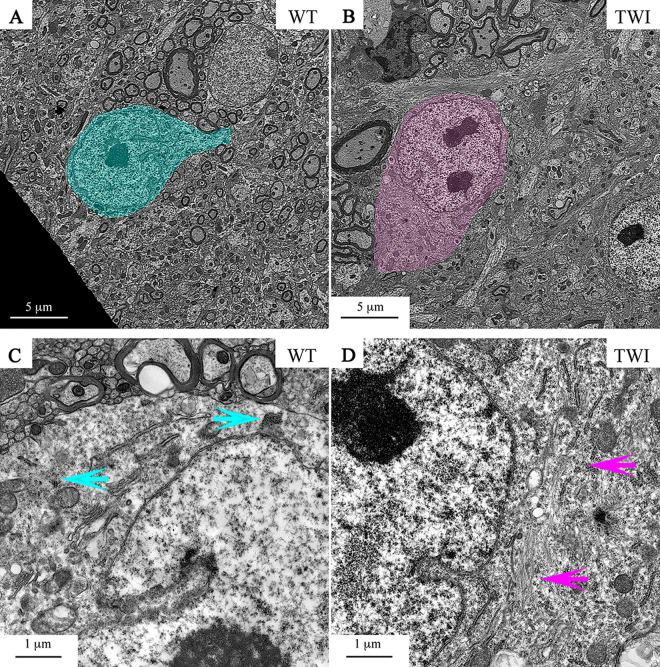
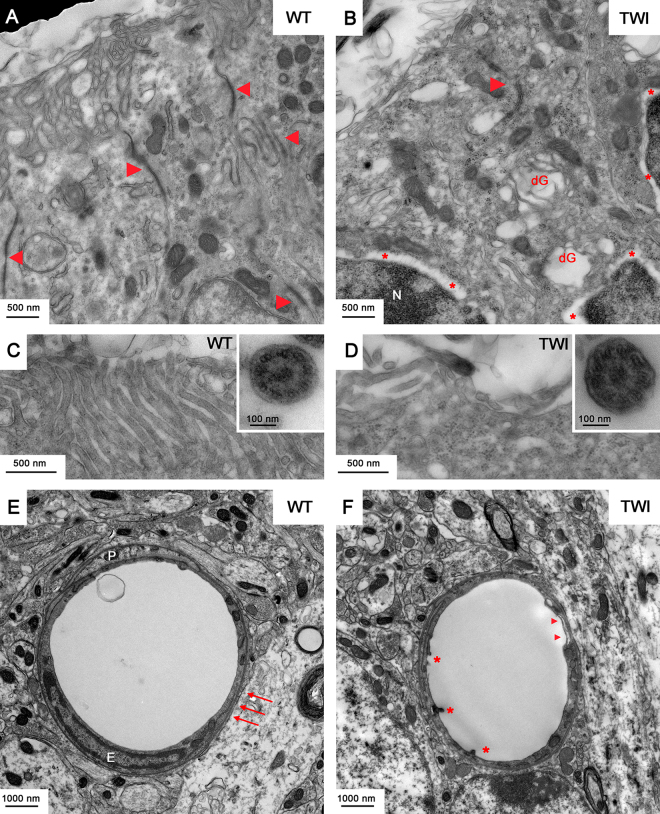
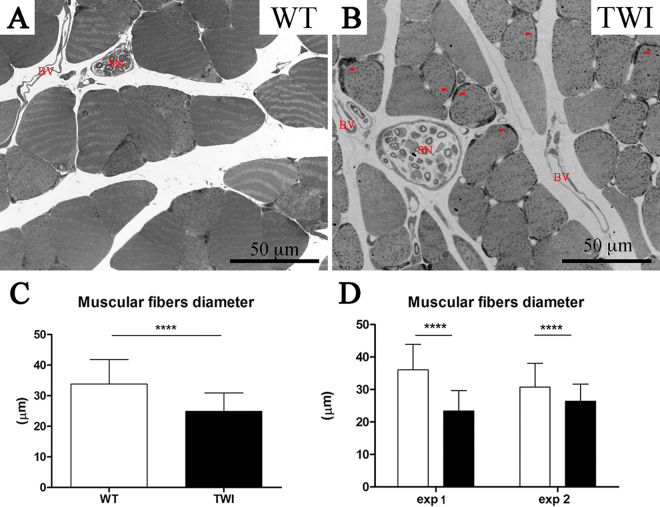
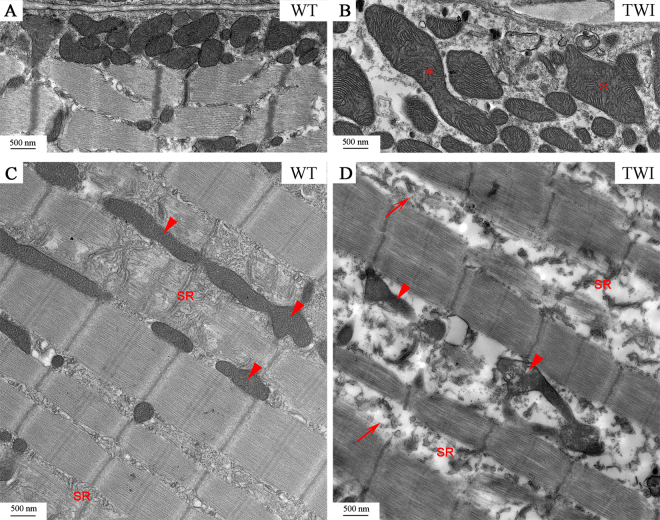
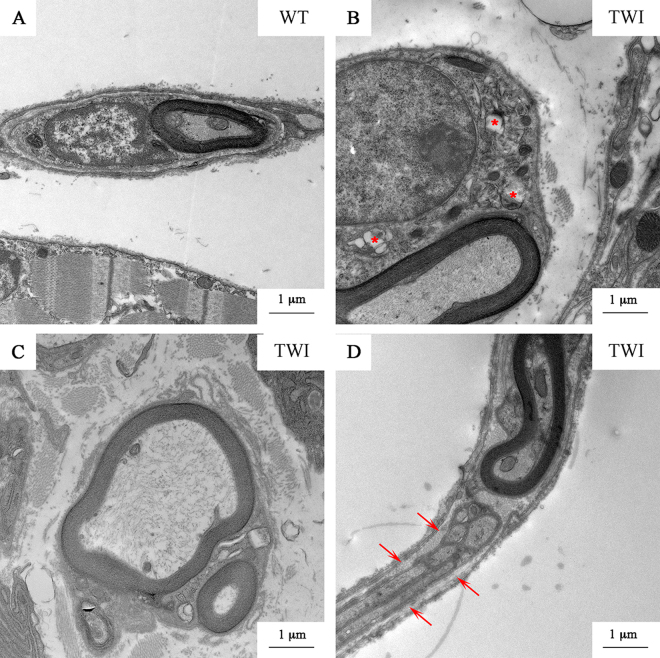
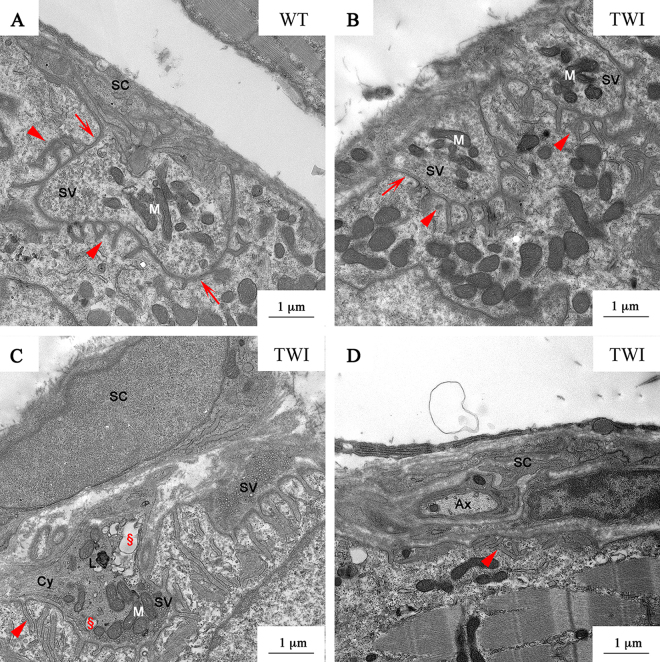
Krabbe disease (KD) is a neurodegenerative disorder caused by the lack of β- galactosylceramidase enzymatic activity and by widespread accumulation of the cytotoxic galactosyl-sphingosine in neuronal, myelinating and endothelial cells. Despite the wide use of Twitcher mice as experimental model for KD, the ultrastructure of this model is partial and mainly addressing peripheral nerves. More details are requested to elucidate the basis of the motor defects, which are the first to appear during KD onset. Here we use transmission electron microscopy (TEM) to focus on the alterations produced by KD in the lower motor system at postnatal day 15 (P15), a nearly asymptomatic stage, and in the juvenile P30 mouse. We find mild effects on motorneuron soma, severe ones on sciatic nerves and very severe effects on nerve terminals and neuromuscular junctions at P30, with peripheral damage being already detectable at P15. Finally, we find that the gastrocnemius muscle undergoes atrophy and structural changes that are independent of denervation at P15. Our data further characterize the ultrastructural analysis of the KD mouse model, and support recent theories of a dying-back mechanism for neuronal degeneration, which is independent of demyelination.


Conflict of interest statement

The authors declare no competing financial interests.

Figures

Figure 1
Figure 1
Qualitative and quantitative characterization of P30 sciatic nerves. (A,B) Representative micrograph of WT vs TWI sciatic nerve. The total size of sciatic nerve is increased in TWI samples. (C) Evaluation of axonal density (number of axons/axonal area). (D,E) Morphometric evaluation of axonal parameters.
Figure 2
Figure 2
Axonal cytoskeleton density is increased in P30 TWI mice sciatic nerves. (A,B) bright field images of representative axons in WT (A) and TWI (B) sciatic nerves. (C,D) bitmaps obtained with the semi-automated method to compute axonal cytoskeleton density from the images in A and B, respectively. (E) Quantification of cytoskeleton elements density.
Figure 3
Figure 3
Myelinating and non-myelinating SCs in sciatic nerves of P30 WT and TWI mice. (A,B) Myelin sheath structure in WT and TWI samples; the insets show the image profile of a line crossing the myelin sheath. Gaps between consecutive layers are visible in TWI mice (B, *). (C–F) Remak bundles in WT sciatic nerves (C,D) and TWI ones (E,F). TWI mice Remak bundles show a denser cytoplasm compared to WT ones and a more complex winding (arrowheads). (G–I) Examples of multiple myelination processes in the sciatic nerve of P30 TWI mice. (G) type 1 MMP, (H) type 2 MMP, (I) type 3 MMP.
Figure 4
Figure 4
P30 motor neuron bodies in spinal cord. (A,B) MNs bodies (painted) in the spinal cord of WT and TWI. (C,D) Higher magnification of perinuclear regions of WT and TWI MNs. Arrows indicate normal (C) versus altered (D) actin cytoskeleton architecture.
Figure 5
Figure 5
P30 ependymocytes and endothelial cells in spinal cord. (A,B) Representative TEM micrographs of the apical region of WT versus TWI ependymocytes. Arrowheads indicate cell to cell junctions; *indicate gaps separating the two lipid bilayers of the nuclear envelope; dG indicates degenerating Golgi’s cisternae. (C,D) Higher magnification images of microvilli and cilia (inset) in the apical region of ependymocytes of WT and TWI samples. (E,F) Architecture of WT versus TWI capillary; P: pericytes surrounding endothelial cells (E); arrows indicate evident basal membrane; *indicate intraluminal protrusions and arrowheads indicate thinner and discontinuous endothelial profiles.
Figure 6
Figure 6
P30 gastrocnemius muscle fibers diameter. (A,B) Optical microscopy images showing the cross-sectional area of myofibers in gastrocnemius muscle of WT versus TWI mice. Arrowheads indicate higher mitochondria accumulation; SN indicate sciatic nerves and BV blood vessel. (C) Evaluation of mean values of myofibers diameter in WT and TWI mice. (D) Evaluation of fibers diameter in different mice show the same trend of reduction.
Figure 7
Figure 7
P30 Gastrocnemius muscle mitochondria and sarcoplasmic reticulum. (A,B) Representative micrographs of gastrocnemius subsarcolemmal mitochondria in WT and TWI mice. *Indicate swollen mitochondria. (C,D) Qualitative characterization of intermyofibrillar mitochondria. Arrowheads indicate representative mitochondria. SR indicates sarcoplasmic reticulum Arrows in D indicate T-tubules.
Figure 8
Figure 8
P30 nerve ending: axons and SCs. (A) WT nerve ending in gastrocnemius muscle. (B) SCs cytosolic compartment is enlarged and some damaged organelles (*) are visible; (C) MMPs; (D) bundles of non-myelinating SCs (arrows) surround myelinated axons.
Figure 9
Figure 9
P30 neuromuscular junctions in gastrocnemius muscle. (A) NMJ in P30 WT gastrocnemius. SC: Schwann cell processes; SV: synaptic vesicles; M: mitochondria. Arrows and arrowheads indicate the primary and secondary folds respectively. (B) P30 TWI gastrocnemius NMJ type 1. (C) NMJ type 2; Cy: cytoskeleton elements; §: damaged organelles; L: lytic organelles. (D) Representative image of denervated NMJ (type 3) in TWI mice. Ax: axon.

References

    1. Krabbe K. A new familial infantile form of diffuse brain-sclerosis. brain. 1916;39:74–114. doi: 10.1093/brain/39.1-2.74. - DOI - PubMed
    1. Duncan ID, Kondo Y, Zhang SC. The myelin mutants as models to study myelin repair in the leukodystrophies. Neurotherapeutics. 2011;8:607–624. doi: 10.1007/s13311-011-0080-y. - DOI - PMC - PubMed
    1. Shin D, Feltri ML, Wrabetz L. Altered Trafficking and Processing of GALC Mutants Correlates with Globoid Cell Leukodystrophy Severity. The Journal of neuroscience : the official journal of the Society for Neuroscience. 2016;36:1858–1870. doi: 10.1523/JNEUROSCI.3095-15.2016. - DOI - PMC - PubMed
    1. Wenger DA, Rafi MA, Luzi P. Molecular genetics of Krabbe disease (globoid cell leukodystrophy): diagnostic and clinical implications. Hum Mutat. 1997;10:268–279. doi: 10.1002/(SICI)1098-1004(1997)10:4<268::AID-HUMU2>3.0.CO;2-D. - DOI - PubMed
    1. White AB, et al. Psychosine accumulates in membrane microdomains in the brain of krabbe patients, disrupting the raft architecture. The Journal of neuroscience : the official journal of the Society for Neuroscience. 2009;29:6068–6077. doi: 10.1523/JNEUROSCI.5597-08.2009. - DOI - PMC - PubMed

MeSH terms