. 2017 Apr 25;7(1):1137.
doi: 10.1038/s41598-017-01291-5.

Serotonin transporter deficiency drives estrogen-dependent obesity and glucose intolerance

Affiliations

Serotonin transporter deficiency drives estrogen-dependent obesity and glucose intolerance

Weibin Zha et al. Sci Rep. .

Abstract

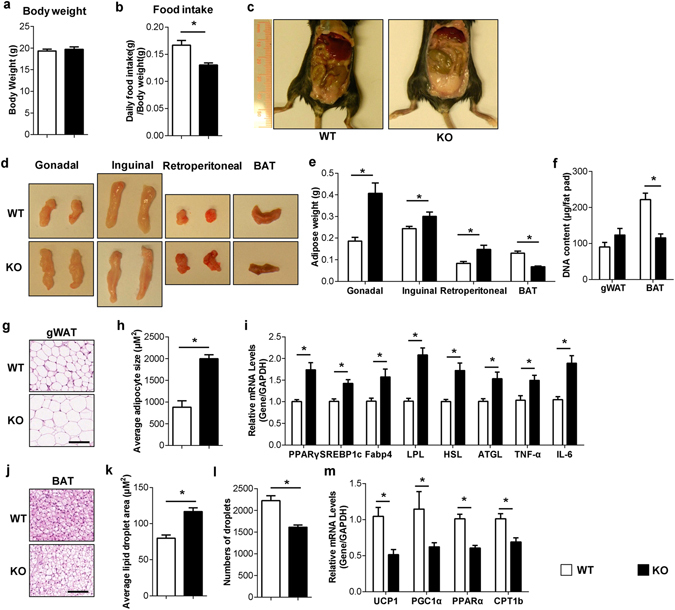
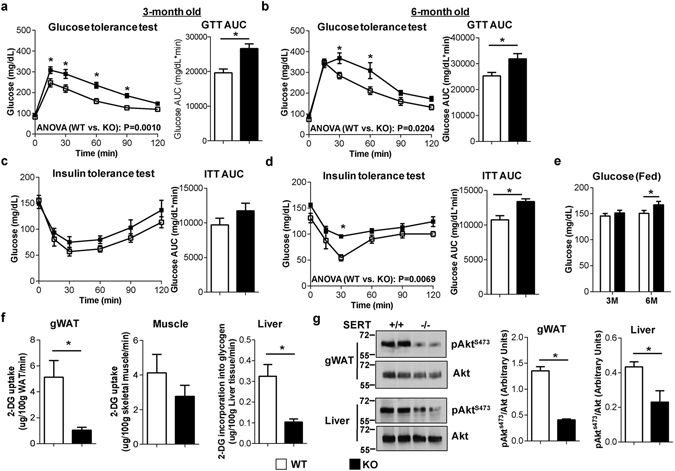
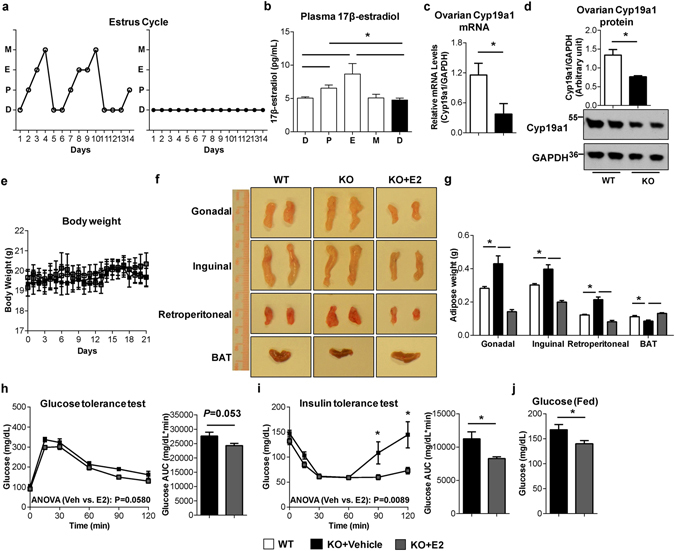
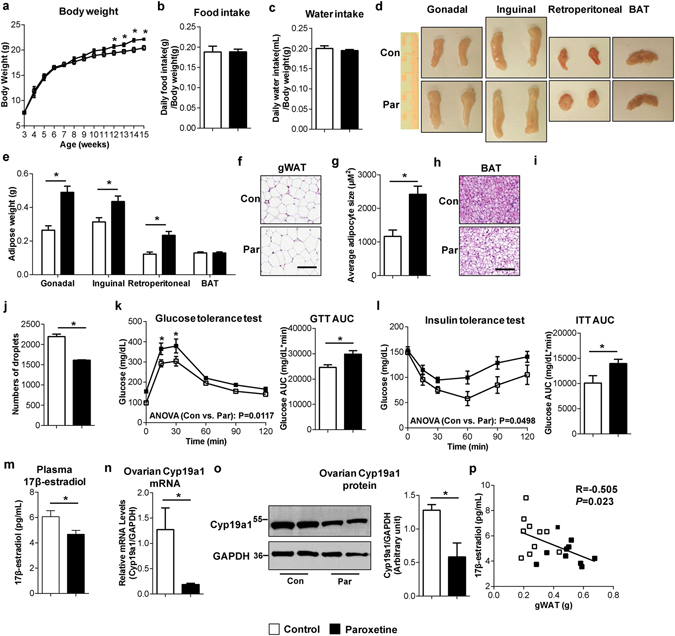
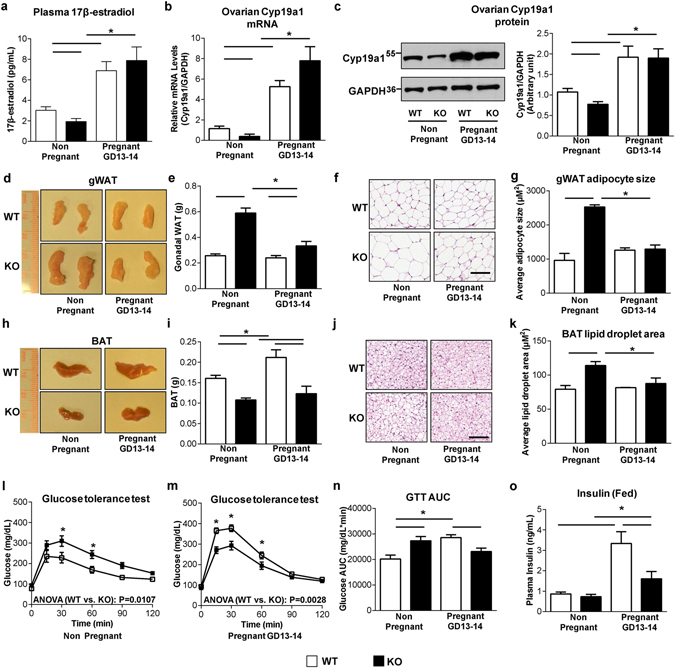
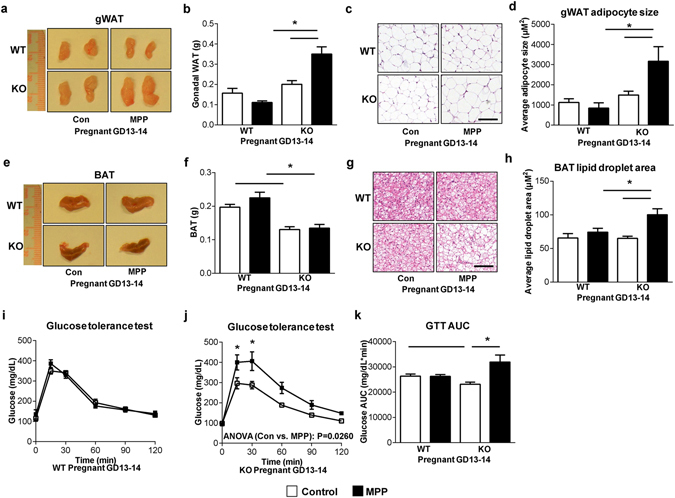
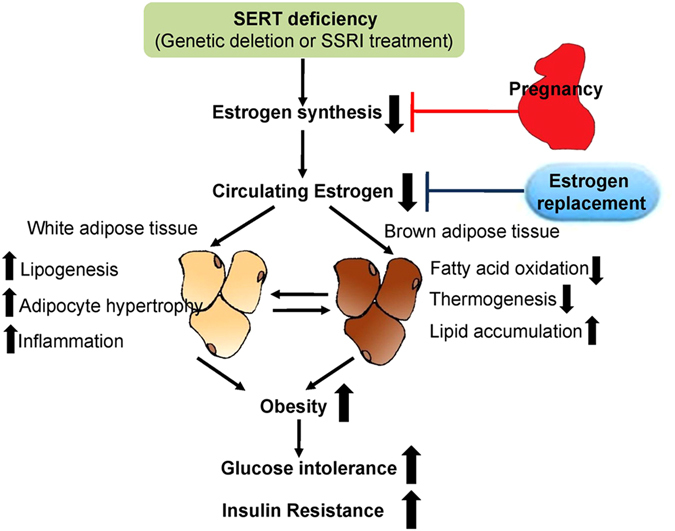
Depression and use of antidepressant medications are both associated with increased risk of obesity, potentially attributed to a reduced serotonin transporter (SERT) function. However, how SERT deficiency promotes obesity is unknown. Here, we demonstrated that SERT -/- mice display abnormal fat accumulation in both white and brown adipose tissues, glucose intolerance and insulin resistance while exhibiting suppressed aromatase (Cyp19a1) expression and reduced circulating 17β-estradiol levels. 17β-estradiol replacement in SERT -/- mice reversed the obesity and glucose intolerance, supporting a role for estrogen in SERT deficiency-associated obesity and glucose intolerance. Treatment of wild type mice with paroxetine, a chemical inhibitor of SERT, also resulted in Cyp19a1 suppression, decreased circulating 17β-estradiol levels, abnormal fat accumulation, and glucose intolerance. Such effects were not observed in paroxetine-treated SERT -/- mice. Conversely, pregnant SERT -/- mice displayed normalized estrogen levels, markedly reduced fat accumulation, and improved glucose tolerance, which can be eliminated by an antagonist of estrogen receptor α (ERα). Together, these findings support that estrogen suppression is involved in SERT deficiency-induced obesity and glucose intolerance, and suggest approaches to restore 17β-estradiol levels as a novel treatment option for SERT deficiency associated obesity and metabolic abnormalities.


Conflict of interest statement

The authors declare that they have no competing interests.

Figures

Figure 1
Figure 1
SERT deficiency leads to increased visceral adiposity and brown fat lipoatrophy in female mice. (a–c) Body weight, food intake and morphologic findings of WT and SERT −/− female mice at 3-month (n = 9–10 per group). (d and e) Representative fat tissues and weights at time of sacrifice (n = 6–12 per group). (f) Genomic DNA content per fat depot (n = 6–7 per group). (g) Representative images of H&E-stained gonadal white adipose tissue (gWAT) sections (Scale bars: 100 µm). (h) Average adipocyte size per 10× field quantified using ImageJ. (i) Gene expression analysis in gWAT by qRT-PCR (n = 6–7 per group). (j) Representative images of H&E-stained brown adipose tissue (BAT) sections (Scale bars: 100 µm). (k and l) Average lipid droplet area and number per 20× field in BAT was quantified using ImageJ. (m) Gene expression analysis in BAT by qRT-PCR (n = 6–7 per group). *P < 0.05. Values are reported as mean ± SEM.
Figure 2
Figure 2
SERT deficiency impairs glucose homeostasis in female mice. (ad) Glucose tolerance test (GTT) (16 hours of fasting) and insulin tolerance test (ITT) (6 hours of fasting) were performed in WT and SERT −/− female mice at 3-month (a and c) and 6-month age (b and d) (n = 6–11 per group). The repeated measures ANOVA P value is provided. The corresponding GTT AUC and ITT AUC were calculated. (e) Fed blood glucose levels were measured (n = 6–10 per group). (f) In vivo glucose uptake. 3-month-old WT and SERT −/− female mice were fasted overnight and injected i.p. with a mixture of glucose and [3H]2-DG, and the accumulation of the 2-DG in gWAT, skeletal muscle (gastrocnemius) and liver were determined (n = 6–10 per group). (g) AktS473 phosphorylation relative to total Akt in gonadal WAT and liver from WT and SERT −/− female mice (3-month old) euthanized 10 min following an injection of 0.75 U kg−1 insulin (n = 3 per group). Uncut blots are included in the Supplementary information. *P < 0.05. Values are reported as mean ± SEM.
Figure 3
Figure 3
The reduction of estrogen levels contributes to abnormal fat accumulation and insulin resistance in SERT −/− female mice. (a) Representative estrous cycle stage profiles of WT and SERT −/− female mice. (b) Plasma 17β-estradiol levels of WT and SERT −/− female mice at 3-month age (n = 6 per group). (c) Cyp19a1 mRNA expression in ovary was quantified by RT-qPCR, normalized to GAPDH, and expressed relative to the control group (n = 5–6 per group). (d) Cyp19a1 protein levels in ovary were quantified by western blotting (n = 4 per group). Uncut blots are included in the Supplementary information. (e) Body weight of WT mice and SERT −/− female mice treated with placebo or 17β-estradiol for 3 weeks (n = 5–6 per group). (f and g) Representative fat tissues and weight at time of sacrifice (n = 5–6 per group). (h and i) GTT and ITT were performed on SERT −/− female mice treated with placebo or 17β-estradiol (n = 5–6 per group). The repeated measures ANOVA P value is provided. The corresponding GTT AUC and ITT AUC were calculated. (j) Fed blood glucose levels were measured (n = 5–6 per group). *P < 0.05. Values are reported as mean ± SEM.
Figure 4
Figure 4
Paroxetine treatment leads to abnormal fat accumulation, insulin resistance and glucose intolerance associated with estrogen suppression in female mice. (ac) Body weight, food and water intakes of WT female mice treated with or without paroxetine for 12 weeks (10 mg/kg/day) (n = 10 per group). (d and e) Representative fat tissues and weights at time of sacrifice (n = 10 per group). (f) Representative images of H&E-stained gWAT sections (Scale bars: 100 µm). (g) Average adipocyte size per 10× field quantified using ImageJ. (h) Representative images of H&E-stained BAT sections (Scale bars: 100 µm). (i and j) Average lipid droplet area and number per 20× field in BAT was quantified using ImageJ. (k and l) GTT and ITT were performed after12 weeks of paroxetine treatment in WT female mice (n = 5 per group). The repeated measures ANOVA P value is provided. The corresponding GTT AUC and ITT AUC were calculated. (m) Concentrations of 17β-estradiol were measured in plasma from WT female mice treated with or without paroxetine for 12 weeks (n = 5 per group). (n) Cyp19a1 mRNA expression in ovary was quantified by RT-qPCR, normalized to GAPDH, and expressed relative to the control group (n = 5 per group). (o) Cyp19a1 protein levels in ovary were quantified by western blotting (n = 4 per group). Uncut blots are included in the Supplementary information. (p) Spearman rank correlation analysis between plasma 17β-estradiol concentrations and gWAT weights. The Spearman’s rank correlation coefficient and accompanying P value are provided. *P < 0.05. Values are reported as mean ± SEM.
Figure 5
Figure 5
Pregnancy reverses abnormal lipid accumulation and glucose intolerance in SERT −/− mice. (a–c) Plasma 17β-estradiol levels (n = 11–13 per group), ovarian Cyp19a1 mRNA (n = 5–6 per group) and protein levels (n = 3 per group) were measured in WT and SERT −/− non-pregnant and pregnant (GD 13–14) mice. Uncut blots are included in the Supplementary information. (d and h) Representative gWAT and BAT from WT and SERT −/− non-pregnant and pregnant (GD 13–14) mice. (e and i) gWAT and BAT weight at time of necropsy (n = 6–14 per group). (f and j) Representative images of H&E-stained gWAT and BAT sections (Scale bars: 100 µm). (g and k) Average adipocyte size per 10× field in gWAT and average lipid droplet area per 20× field in BAT were quantified using ImageJ. (l–n) GTT was performed on WT and SERT −/− non-pregnant and pregnant (GD 13–14) mice (n = 6–11 per group). The repeated measures ANOVA P value is provided. The corresponding GTT AUC was calculated. (o) Fed plasma insulin levels were measured (n = 6–7 per group). Studies were performed at 3-month-old mice. *P < 0.05. Values are reported as mean ± SEM.
Figure 6
Figure 6
ERα signaling is required for the reverse of adiposity and glucose intolerance by pregnancy in SERT −/− mice. (a and e) Images of representative gWAT and BAT from WT and SERT −/− pregnant (GD 13–14) mice treated with MPP (i.p. 0.5 mg/kg/day) or vehicle from day 7 to day 13–14 of pregnancy (n = 5–6 per group). (b and f) gWAT and BAT weight at time of necropsy (n = 5–6 per group). (c and g) Representative images of H&E-stained gWAT and BAT sections (Scale bars: 100 µm). (d and h) Average adipocyte size per 10× field in WAT and average lipid droplet area per 20× field in BAT were quantified using ImageJ. (i-k) GTT was performed in WT and SERT −/− pregnant (GD 13–14) mice treated with or without MPP (n = 5–6 per group). The repeated measures ANOVA P value is provided. The corresponding GTT AUC was calculated. *P < 0.05. Values are reported as mean ± SEM.
Figure 7
Figure 7
SERT deficiency leads to adiposity and abnormal glucose metabolism through estrogen suppression in vivo. Genetic deletion or pharmacological inhibition of SERT in mice reduces gonadal estrogen synthesis and plasma 17β-estradiol levels, which lead to the abnormal fat accumulation in both white and brown adipose tissues, further contributing to adiposity and dysregulation of glucose homeostasis at the whole-body level. Restoring estrogen by exogenous estrogen therapy or during pregnancy rescues SERT deficiency-induced adiposity and glucose intolerance.

Similar articles

Cited by

References

    1. Murray CJ, Lopez AD. Alternative projections of mortality and disability by cause 1990–2020: Global Burden of Disease Study. Lancet. 1997;349:1498–1504. doi: 10.1016/S0140-6736(96)07492-2. - DOI - PubMed
    1. Global, regional, and national incidence, prevalence, and years lived with disability for 301 acute and chronic diseases and injuries in 188 countries, 1990–2013: a systematic analysis for the Global Burden of Disease Study 2013. Lancet386, 743–800 (2015). - PMC - PubMed
    1. Pratt, L. A., Brody, D. J. Depression and obesity in the U.S. adult household population, 2005–2010. NCHS Data Brief, 1–8 (2014). - PubMed
    1. Chien IC, Lin CH, Chou YJ, Chou P. Increased risk of hyperlipidemia in patients with major depressive disorder: a population-based study. J Psychosom Res. 2013;75:270–274. doi: 10.1016/j.jpsychores.2013.06.003. - DOI - PubMed
    1. Raeder MB, Bjelland I, Emil Vollset S, Steen VM. Obesity, dyslipidemia, and diabetes with selective serotonin reuptake inhibitors: the Hordaland Health Study. J Clin Psychiatry. 2006;67:1974–1982. doi: 10.4088/JCP.v67n1219. - DOI - PubMed

Publication types