. 2017 Apr 10:10:102.
doi: 10.3389/fnmol.2017.00102. eCollection 2017.

Genetic Deletion of Akt3 Induces an Endophenotype Reminiscent of Psychiatric Manifestations in Mice

Affiliations

Genetic Deletion of Akt3 Induces an Endophenotype Reminiscent of Psychiatric Manifestations in Mice

Yan Bergeron et al. Front Mol Neurosci. .

Abstract

The protein kinase B (PKB/Akt), found in three distinctive isoforms (PKBα/Akt1, PKBβ/Akt2, PKBγ/Akt3), is implicated in a variety of cellular processes such as cell development, growth and survival. Although Akt3 is the most expressed isoform in the brain, its role in cerebral functions is still unclear. In the present study, we investigated the behavioral, electrophysiological and biochemical consequences of Akt3 deletion in mice. Motor abilities, spatial navigation, recognition memory and LTP are intact in the Akt3 knockout (KO) mice. However, the prepulse inhibition, three-chamber social, forced swim, tail suspension, open field, elevated plus maze and light-dark transition tests revealed an endophenotype reminiscent of psychiatric manifestations such as schizophrenia, anxiety and depression. Biochemical investigations revealed that Akt3 deletion was associated with reduced levels of phosphorylated GSK3α/β at serine 21/9 in several brain regions, although Akt1 and Akt2 levels were unaffected. Notably, chronic administration of lithium, a mood stabilizer, restored the decreased phosphorylated GSK3α/β levels and rescued the depressive and anxiety-like behaviors in the Akt3 KO mice. Collectively, our data suggest that Akt3 might be a critical molecule underlying psychiatric-related behaviors in mice.

Keywords: Akt3; GSK3α/β; anxiety; behavior; depression; lithium.


Figures

Figure 1
Figure 1
Levels of Akt isoforms in the Akt3 knockout (KO) mouse brain. (A) Levels of Akt1, Akt2 and Akt3 were assessed by western blot in the anterior cortex, striatum, hippocampus and cerebellum. The data, expressed relative to GAPDH, represent the mean of relative optical density of Akt1 and Akt2 (expressed as a percentage of control values) ± SEM, n = 3–4; triplicate experiments for each mouse/group. Since Akt3 protein was undetectable in Akt3 KO mice, we did not quantify the optical density.
Figure 2
Figure 2
Normal motor abilities and cognitive functions in Akt3 KO mice. Motor abilities on the (A) Rotarod, (B) Pole, (C) Wire and (D) stepping tests of Akt3 KO and wild type (WT) mice were evaluated. Data represent the average mean latency to fall expressed in seconds from three assays (rotarod) ± SEM, n = 7 mice/group. Data represent the mean time require to perform the test (pole and wire) and the mean numbers of adjusting steps (stepping) ± SEM, n = 6–7 mice/group. (E) Mice were trained on the Morris water maze. Spatial acquisition is evaluated by the latency to reach the hidden platform at each day of training expressed in seconds ± SEM, n = 12–17 mice/group. Memory is evaluated during the probe trial by the time spent in each quadrant expressed in seconds ± SEM, n = 12–17 mice/group. ***p < 0.001 vs. target quadrant. (F) The novel object recognition test was performed to evaluate memory. Time spent exploring the familiar or the novel object is shown as a ratio of the total time spent exploring both objects ± SEM, n = 10–11 mouse/group. *p < 0.05, ***p < 0.001 vs. familiar object. (G) Examples of average fEPSPs elicited in the stratum radiatum before and after theta-burst stimulation in WT and Akt3 KO slices. Each sample trace is an average of five consecutive responses. Calibration bar: 5 ms; 1 mV. Amplitude of fEPSPs was measured before and after theta-burst stimulation and fEPSPs were expressed as the percentage of the average response before theta-burst stimulation (arrow). The values obtained during the period preceding theta-burst stimulation were averaged to derive baseline value. The data are expressed as percentages of baseline values and each point represents the mean ± SEM, n = 7.
Figure 3
Figure 3
Decreased social behaviors and impaired sensorimotor gating in Akt3 KO mice. Social behavior and social novelty were examined in the three-chamber sociability test. (A) On session I, sociability was evaluated by the time Akt3 KO and WT mice were exploring the stranger mouse (stranger I) and the empty cage. Data represent the mean time of exploration expressed in seconds ± SEM, n = 8–11 mice/group. **p < 0.01, ***p < 0.001 vs. exploration of stranger mouse I by WT mice; ##P < 0.01 vs. exploration of stranger mouse I by Akt3 KO. On session II, preference for social novelty was evaluated by comparing the time mice explored the familiar stranger mouse I and the novel stranger mouse II. Data represent the mean exploration time expressed in seconds ± SEM, n = 8–11 mice/group. **p < 0.01 vs. exploration of stranger mouse I by WT mice, ###p < 0.001 vs. exploration of stranger mouse II by WT mice. (B) Sensorimotor gating was evaluated by measuring the level of prepulse inhibition for different prepulse intensities. Data represent the mean percentage ± SEM, n = 11–12 mice/group. **P < 0.01, ***P < 0.001 vs. WT mice.
Figure 4
Figure 4
Depressive and anxiety-like behaviors in Akt3 KO mice. Depressive-like behaviors were evaluated by measuring the immobile time of Akt3 KO mice and WT mice in (A) the forced swim test (FST) and (B) the tail suspension test (TST). (C) In the open field, anxiety-like behavior was based on mice activity and distance traveled in the central zone. (D) In the elevated plus maze, time in open arms and number of entries in open arms were measured. (E) In the light-dark test, time spent in the light chamber and number of entries in the light chamber was measured. All data are expressed as the mean ± SEM, n = 11–17 mice/group. *p < 0.05, **p < 0.01, ***p < 0.001 vs. WT mice.
Figure 5
Figure 5
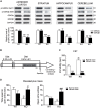
Chronic lithium treatment reversed depressive and anxiety-like behaviors in Akt3 KO mice. (A) Levels of phosphorylated GSK3α/β were evaluated by western blot in the anterior cortex, striatum, hippocampus and cerebellum of Akt3 KO and WT mice. The data, expressed relative to total GSK3α/β, represent the mean of relative optical density (expressed as a percentage of control values) ± SEM, n = 3 mice/group; triplicate experiments for each mouse/group. *p < 0.05, **p < 0.01, ***p < 0.001 vs. WT mice. (B) Experimental design of chronic lithium treatment. (C) Depressive-like behavior was evaluated by the FST after normal or lithium diet. Data express the mean time of immobility in seconds ± SEM, n = 6–12 mice/group. **p < 0.01, ***p < 0.001 vs. WT fed with normal chow, ###p < 0.001 vs. Akt3 KO mice fed with normal chow. (D) Anxiety-like behavior was evaluated in the elevated plus maze after normal or lithium diet. Data are expressed as the mean ± SEM, n = 10–12 mice/group. *p < 0.05 vs. WT fed with normal chow, #p < 0.05, ###p < 0.001 vs. Akt3 KO mice fed with normal chow.
Figure 6
Figure 6
Chronic lithium treatment increased the levels of phosphorylated GSK3α/β in Akt3 KO mice. At the end of the chronic lithium treatment, levels of phosphorylated GSK3α/β were measured by western blot in the (A) anterior cortex, (B) striatum, (C) hippocampus and (D) cerebellum. The data, expressed relative to total GSK3α/β level, represent the mean of relative optical density of phosphorylated GSK3α/β (expressed as a percentage of control values) ± SEM, n = 4–8 mice/group for each condition; triplicate experiments for each mouse/group. *p < 0.05, **p < 0.01, ***p < 0.001 vs. WT fed with normal chow, #p < 0.05, ##p < 0.01, ###p < 0.001 vs. Akt3 KO mice fed with normal chow.

Similar articles

Cited by

References

    1. Balevich E. C., Haznedar M. M., Wang E., Newmark R. E., Bloom R., Schneiderman J. S., et al. . (2015). Corpus callosum size and diffusion tensor anisotropy in adolescents and adults with schizophrenia. Psychiatry Res. 231, 244–251. 10.1016/j.pscychresns.2014.12.005 - DOI - PMC - PubMed
    1. Balu D. T., Carlson G. C., Talbot K., Kazi H., Hill-Smith T. E., Easton R. M., et al. . (2012). Akt1 deficiency in schizophrenia and impairment of hippocampal plasticity and function. Hippocampus 22, 230–240. 10.1002/hipo.20887 - DOI - PMC - PubMed
    1. Beaulieu J. M., Gainetdinov R. R., Caron M. G. (2009). Akt/GSK3 signaling in the action of psychotropic drugs. Annu. Rev. Pharmacol. Toxicol. 49, 327–347. 10.1146/annurev.pharmtox.011008.145634 - DOI - PubMed
    1. Bergeron Y., Chagniel L., Bureau G., Massicotte G., Cyr M. (2014). mTOR signaling contributes to motor skill learning in mice. Front. Mol. Neurosci. 7:26. 10.3389/fnmol.2014.00026 - DOI - PMC - PubMed
    1. Beurel E., Song L., Jope R. S. (2011). Inhibition of glycogen synthase kinase-3 is necessary for the rapid antidepressant effect of ketamine in mice. Mol. Psychiatry 16, 1068–1070. 10.1038/mp.2011.47 - DOI - PMC - PubMed

LinkOut - more resources