. 2017 Apr 10:11:26.
doi: 10.3389/fninf.2017.00026. eCollection 2017.

The Topographical Mapping in Drosophila Central Complex Network and Its Signal Routing

Affiliations

The Topographical Mapping in Drosophila Central Complex Network and Its Signal Routing

Po-Yen Chang et al. Front Neuroinform. .

Abstract

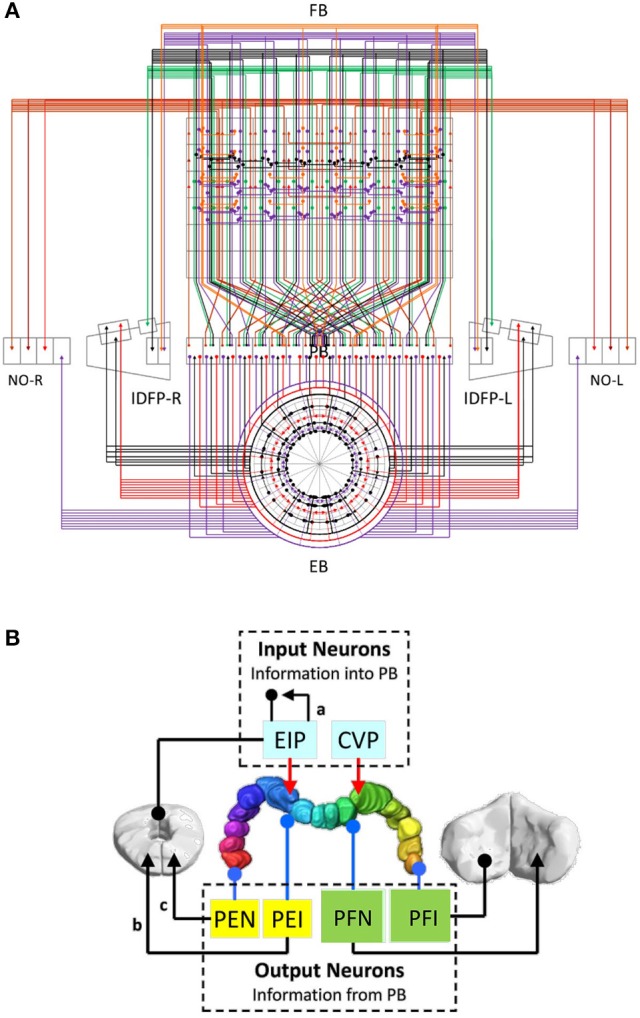
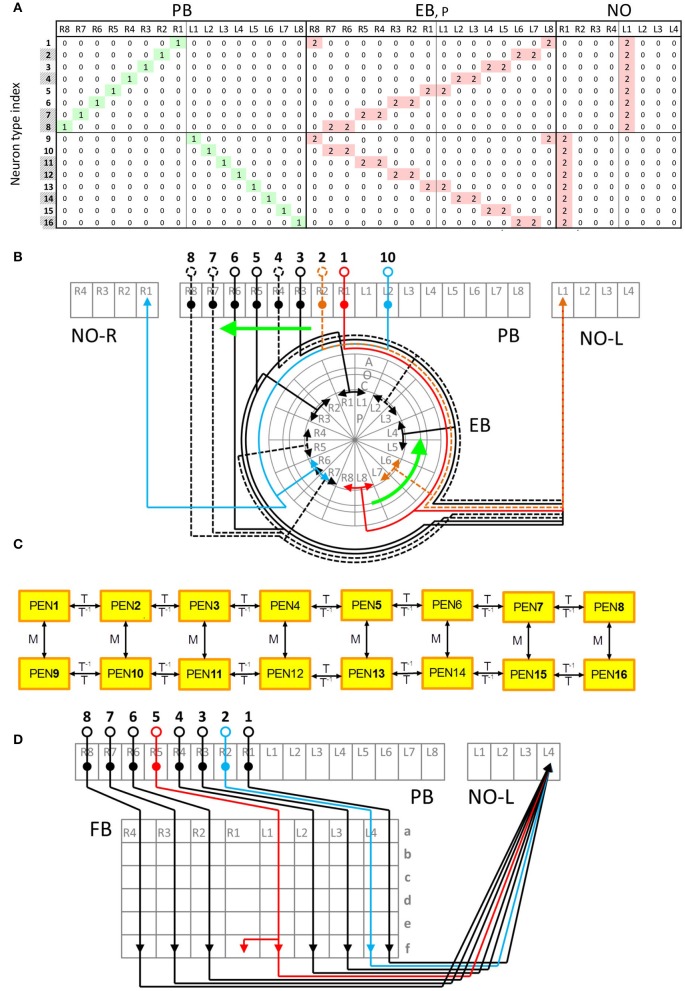
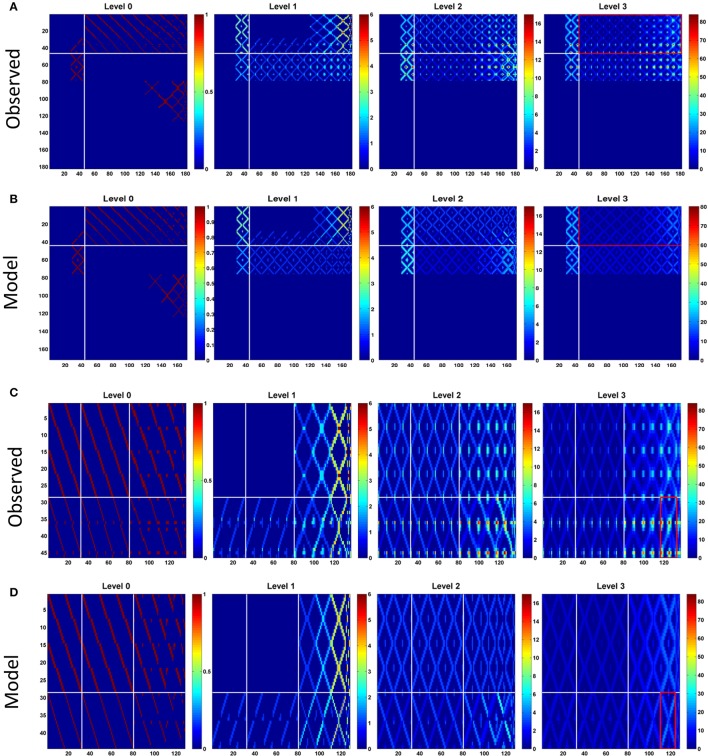
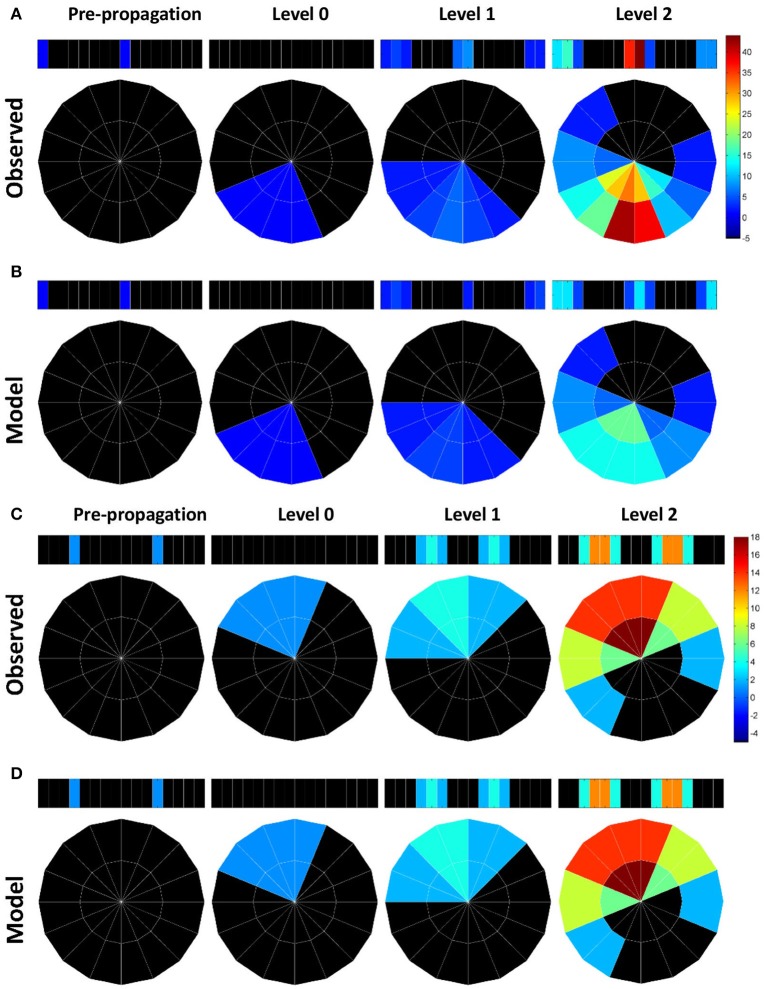
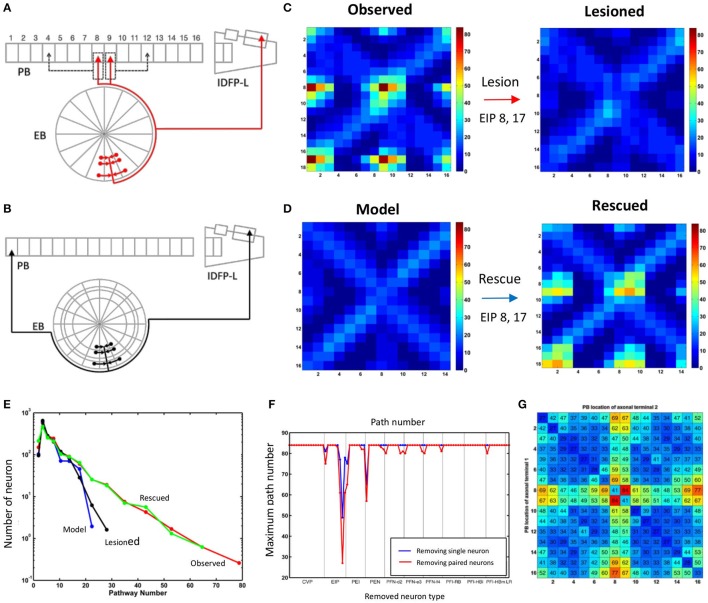
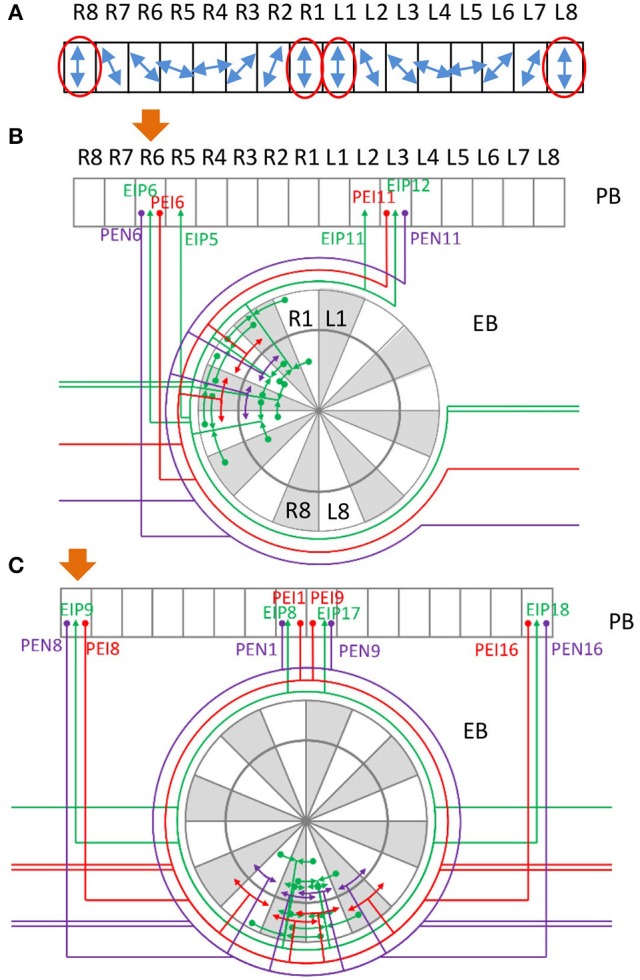
Neural networks regulate brain functions by routing signals. Therefore, investigating the detailed organization of a neural circuit at the cellular levels is a crucial step toward understanding the neural mechanisms of brain functions. To study how a complicated neural circuit is organized, we analyzed recently published data on the neural circuit of the Drosophila central complex, a brain structure associated with a variety of functions including sensory integration and coordination of locomotion. We discovered that, except for a small number of "atypical" neuron types, the network structure formed by the identified 194 neuron types can be described by only a few simple mathematical rules. Specifically, the topological mapping formed by these neurons can be reconstructed by applying a generation matrix on a small set of initial neurons. By analyzing how information flows propagate with or without the atypical neurons, we found that while the general pattern of signal propagation in the central complex follows the simple topological mapping formed by the "typical" neurons, some atypical neurons can substantially re-route the signal pathways, implying specific roles of these neurons in sensory signal integration. The present study provides insights into the organization principle and signal integration in the central complex.

Keywords: Drosophila; central complex; neural networks; protocerebral bridge; topographical mapping.


Figures

Figure 1
Figure 1
The partial central complex network formed by PB-innervating neurons. (A) The innervation diagram of the network. Each neuron type is represented by a color line with arrowheads for axonal innervation and solid circles for dendritic innervation. Each color indicates a specific neuron class. (B) The large-scale circuit diagram of the central complex showing the relationship between neuron classes. The arrowheads and solid circles are defined as in (A). EIP and CVP are input neuron classes for their axonal innervation in PB while other classes are classified as output neurons for their dendritic innervation in PB. The PB local neuron class is not shown. The present study focuses on the recurrent circuits formed by EIP, PEI, and PEN.
Figure 2
Figure 2
Typical and atypical innervation patterns of neurons in the central complex. (A) The innervation table for the PEN class. Each row represents the innervation vector of a given PEN neuron type while each column indicates how a subunit is innervated by different neuron types (0 for no innervation, 1 for dendrite and 2 for axon). Shaded neuron type indices indicate the types that were not observed but predicted in Lin C.-Y. et al. (2013). This neuron class demonstrates a typical (or regular) innervation pattern. (B) The innervation diagram of the PEN class. Neuron types are labeled by black numbers and the subunits are in gray. The relationship between the neuron types PEN1-PEN8 (numbers 1-8) can be described as shifting. The same relationship is observed for PEN9-PEN16. In addition, PEN9-PEN16 are a mirroring of PEN1-PEN8, respectively. The arrowheads represent axons while the solid circles indicate dendrites. The somas are represented by the empty circles. Dashed lines are neurons predicted in Lin C.-Y. et al. (2013). (C) A generator diagram of the PEN class showing how generators can be used to produce one neuron type from others. The PEN class demonstrates a regular (or typical) innervation pattern with which all neuron types can be generated from one initial neuron by recursive application of T or M generators. The rightward arrows indicate the effect of the generators labeled above the arrows while the leftward arrows is for the generators labeled below. (D) Atypical innervation patterns of the PFN-FfN4 class. The type 2 neuron does not make a shift with respect to the type 1 as expected, but innervates the same FB unit (FBf-L4) as type 1. The type 5 neuron innervates two adjacent FB subunits while other neurons only innervate one.
Figure 3
Figure 3
Connection matrices at different propagation levels for, (A). The observed network and, (B). the model network. The vertical axis represents the index of the source neuron types while the horizontal axis is for the destination neuron types. The order of the neuron type index follows that in Supplementary Table S1 but with local neurons (PB LN) removed. So there are only 184 neuron types presented in the matrices. Each element in the matrices indicates the number of paths (represented by the color) connecting the source and destination neuron types at the given propagation levels. In general, the number of paths increases with the level for both networks as expected. However, the difference between the two networks increases dramatically at the higher levels. The observed network has large maximum path numbers, which is more than twice of that in the model network at the propagation level 3. The white lines separate the PB input neurons (before the lines) from the PB output neurons (after the lines). The red rectangles outline the portion of the matrices shown in (C) for the observed and (D) for the model networks. In (C,D), horizontal white lines separate two classes of input neurons (from top to down: CVP and EIP) and the vertical white lines separate output neuron classes (from left to right: PEI, PEN, PFN, and PFI). The red rectangle marks the region formed by EIP->PFI-IHBI classes, where the largest path number in the observed network is located.
Figure 4
Figure 4
Information propagation in the EB-PB feedback loop. (A) If starting from the subunits R1 and L8 of PB (the first panel from the left) in the observed network, a signal quickly propagates to the central and lateral subunits in PB via EB after two levels of propagation. Colors indicate the number of hits by the signal in each subunit. (B) In the model network, the same starting subunit leads to a much smaller hit number. (C) If we start from L5 and R4 subunits in PB, the signal propagates between L5, R4, and neighboring PB subunits via EB. (D) Same as in c but for the model network. The model network exhibits the same propagation pattern and number of hits as those in the observed network.
Figure 5
Figure 5
The unique impact of the atypical neurons EIP8 and EIP17 on the central complex network. (A) The EIP8 neuron type in the observed network innervates the medial PB subunits. (B) In contrast, the predicted EIP8 in the model network innervates the lateral PB subunits. The EIP17 neuron is a mirroring of EIP8 in both networks. (C) Removing EIP8 and EIP17 from the observed network completely abolishes the information hotspots at the propagation level 3. (D) Interestingly, the hotspots can be partially “rescued” at the level 3 in the model network by adding the atypical neurons EIP8 and EIP17 back. In order to visualize the detailed changes, here we only show a small portion (corresponds to the red rectangle in Figures 3C,D) of the connection matrix. (E) The distribution of path numbers at the propagation level 3 between every pair of neurons for observed, model, lesioned, and rescued networks. The distributions for the observed and rescued networks both exhibit a long tail, characterizing the existence of neuron pairs with high path numbers. (F) The effects of different neuron types on the maximum path number at the propagation level 3. By removing a single neuron type (blue) or a neuron type together with its contralateral counterpart (red) one at a time from the observed network, we discovered that only EIP8 and EIP17 cause the most significant reduction in the maximum path number, more than any other neuron types. (G) The locations of the axonal terminals are crucial for the effect of EIP8 and EIP17 on the path number. By randomly allocating the two axonal terminals of EIP8 in PB and keeping the EIP17 neuron symmetric to EIP8, we observed that only in their native terminal locations, EIP8 and EIP17 neurons lead to the highest maximum path numbers. The vertical and the horizontal axes indicate the positions of the axonal terminals in PB (index of PB subunit). The number in each small square labels the maximum path number of the network at the level 3 with the indicated terminal positions. The diagonal represents the condition in which the EIP8 and EIP17 neurons only innervate one single PB subunit.
Figure 6
Figure 6
Possible role of the neurons EIP 8 and 17 in integrating sensory information. (A) A schematic of E-vector selectivity in PB. The blue arrows indicate the orientation of E-vector of polarized light selected by each of the 16 PB subunits observed in locust (Heinze and Homberg, , ; Heinze et al., ; Homberg et al., 2011). Each polarization direction is selected by two contralateral subunits except for the vertical direction, which is selected by two lateral and two medial subunits (red ovals). (B) Example of recurrent circuits between PB and EB. Assuming that a signal starts from PB R6, as indicated by the orange arrow, a strong recurrent signal propagation is quickly established between PB R6, PB L3, and several EB subunits. Note that in locust, R6 and L3 are selective to the same polarized light direction. (C) A special recurrent circuit involving the atypical neurons EIP8 and EIP17. Assuming PB R8 as the starting subunit of a signal (orange arrow), it propagates to EB R8 and L8, and then quickly reaches the medial PB subunits R1 and L1. In a few steps, a strong recurrent signal propagation is established between PB R8, R1, L1, L8, and several EB subunits. Note that in locust, all of these four PB subunits are selective to the vertically polarized light.

Similar articles

Cited by

References

    1. Alivisatos A. P., Chun M., Church G. M., Greenspan R. J., Roukes M. L., Yuste R. (2012). The brain activity map project and the challenge of functional connectomics. Neuron 74, 970–974. 10.1016/j.neuron.2012.06.006 - DOI - PMC - PubMed
    1. Bargmann C. I., Marder E. (2013). From the connectome to brain function. Nat. Methods 10, 483–490. 10.1038/nmeth.2451 - DOI - PubMed
    1. Brunel N. (2000). Dynamics of sparsely connected networks of excitatory and inhibitory spiking neurons. J. Comput. Neurosci. 8, 183–208. 10.1023/A:1008925309027 - DOI - PubMed
    1. Chiang A.-S., Lin C.-Y., Chuang C.-C., Chang H.-M., Hsieh C.-H., Yeh C.-W., et al. . (2011). Three-dimensional reconstruction of brain-wide wiring networks in Drosophila at single-cell resolution. Curr. Biol. 21, 1–11. 10.1016/j.cub.2010.11.056 - DOI - PubMed
    1. Chou Y.-H., Spletter M. L., Yaksi E., Leong J. C. S., Wilson R. I., Luo L. (2010). Diversity and wiring variability of olfactory local interneurons in the Drosophila antennal lobe. Nat. Neurosci. 13, 439–449. 10.1038/nn.2489 - DOI - PMC - PubMed

LinkOut - more resources