

Hemoglobin-Improved Protection in Cultured Cerebral Cortical Astroglial Cells: Inhibition of Oxidative Stress and Caspase Activation
- PMID: 28443065
- PMCID: PMC5385367
- DOI: 10.3389/fendo.2017.00067
Hemoglobin-Improved Protection in Cultured Cerebral Cortical Astroglial Cells: Inhibition of Oxidative Stress and Caspase Activation
Abstract
Oxidative stress plays a major role in triggering astroglial cell death in diverse neuropathological conditions such as ischemia and neurodegenerative diseases. Numerous studies indicate that hemoglobin (Hb) is expressed in both resting and reactive glia cells, but nothing is known regarding a possible role of Hb on astroglial cell survival. Thus, the purpose of the present study was to investigate the potential glioprotective effect of Hb on hydrogen peroxide (H2O2)-induced oxidative stress and apoptosis in cultured rat astrocytes. Our study demonstrates that administration of graded concentrations of Hb (10-12 to 10-6 M) to H2O2-treated astrocytes reduces cell death in a concentration-dependent manner. H2O2 treatment induces the accumulation of reactive oxygen species (ROS) and nitric oxide (NO), a drop of the mitochondrial membrane potential, and a stimulation of caspase-3/7 activity. Exposure of H2O2-treated cells to Hb was accompanied by marked attenuations of ROS and NO surproductions, mitochondrial membrane potential reduction, and caspase-3/7 activity increase. The protective action of Hb was blocked by the protein kinase A (PKA) inhibitor H89, the protein kinase C (PKC) inhibitor chelerythrine, and the mitogen-activated protein (MAP)-kinase kinase (MEK) inhibitor U0126. Taken together, these data demonstrate for the first time that Hb is a glioprotective factor that protects astrocytes from apoptosis induced by oxidative stress and suggest that Hb may confer neuroprotection in neurodegenerative diseases. The anti-apoptotic activity of Hb on astrocytes is mediated through the PKA, PKC, and MAPK transduction pathways and can be accounted for by inhibition of oxidative stress-induced mitochondrial dysfunctions and caspase activation.
Keywords: apoptosis; astrocytes; cell protection; hemoglobin; oxidative stress.
Figures
 ) or with H2O2 (50 µM) in the absence (
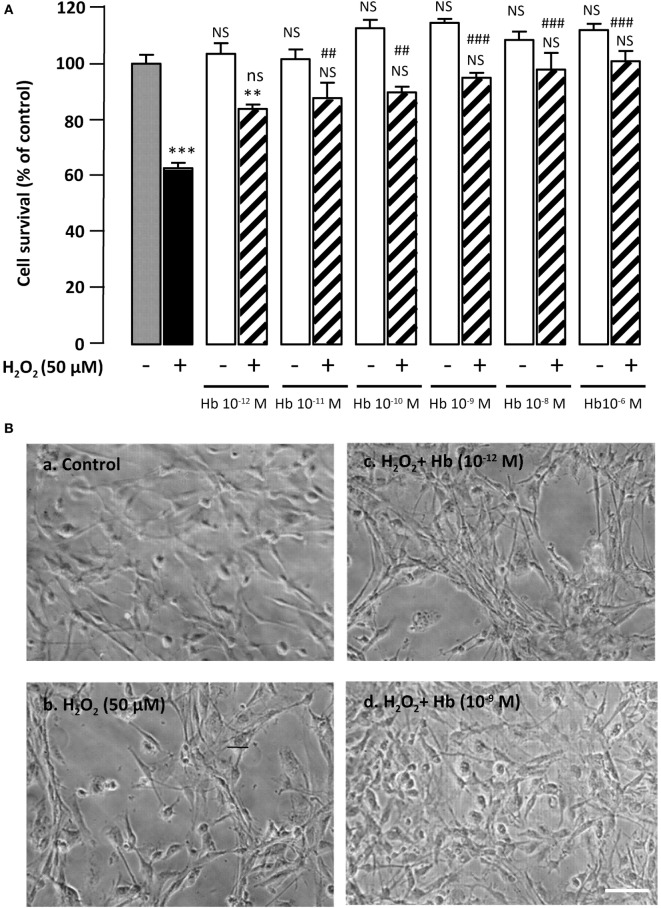
 ) or presence of graded concentration of Hb (10−12 to 10−6 M,
  ). Cell survival was quantified by measuring FDA fluorescence intensity, and the results are expressed as percentages of the control. Data are means ± SEM of four independent experiments. ANOVA followed by Bonferroni’s test ***p < 0.001; NS, not statistically different from control cells (absence of H2O2 and absence of Hb). ##p < 0.01; ###p < 0.001; ns, not statistically different vs. H2O2-treated cells. (B) Typical phase-contrast images illustrating the effect of Hb on H2O2-induced morphological changes in cultured rat astrocytes. Cells were incubated for 24 h with medium alone (a), or 50 µM H2O2 in the absence (b), or presence of 10−12 M Hb (c), or 10−9 M Hb (d). Scale bar 100 µm.
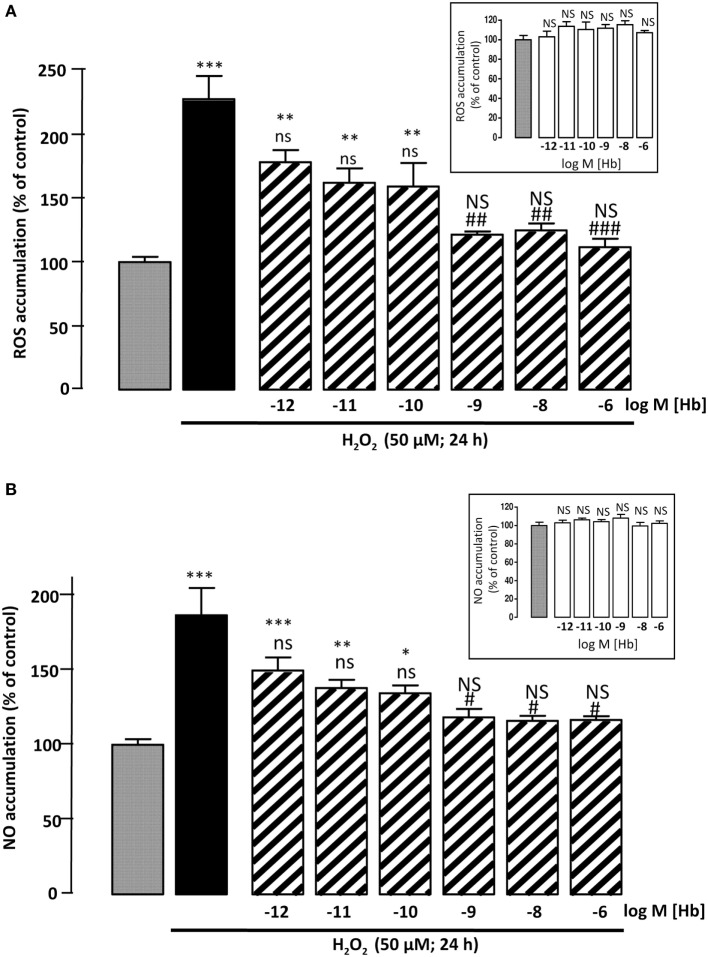 ) or with H2O2 (50 µM) in the absence () or presence of graded concentration of Hb (10−12 to 10−6 M, ). (A) Cellular ROS level was quantified by measurement of DCF fluorescence intensity. (B) Cellular NO level was quantified by measurement of DAF fluorescence intensity. Inset, effect of graded concentration of Hb (10−12 to 10−6 M;
  ) on intracellular ROS accumulation (A) and NO formation (B). The results are expressed as percentages of the controls. Data are means ±SEM of three independent experiments. ANOVA followed by Bonferroni’s test *p < 0.05; **p < 0.01; ***p < 0.001; NS, not statistically different from control cells. #p < 0.05; ##p < 0.01; ###p < 0.001; ns, not statistically different vs. H2O2-treated cells.
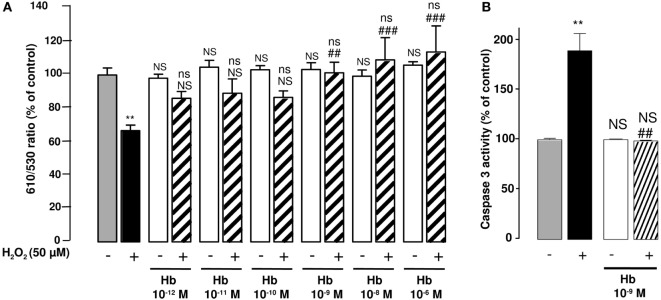 ) or with H2O2 (50 µM) in the absence () or presence of graded concentrations of Hb (10−12 to 10−6 M, ). (A) Mitochondrial transmembrane potential was assessed by using the JC-10 probe, and the ratio of fluorescence emissions 610/530 nm was measured as an index of mitochondrial activity. (B) Caspase 3 activity was measured by caspase substrate, Z-DEVDRhodamine 110, fluorescence. The results are expressed as percentage of controls. Data are means ±SEM of three independent experiments. ANOVA followed by Bonferroni’s test. **p < 0.01; ns, not statistically different from control cells. ##p < 0.01; ###p < 0.001; ns, not statistically different vs. H2O2-treated cells.
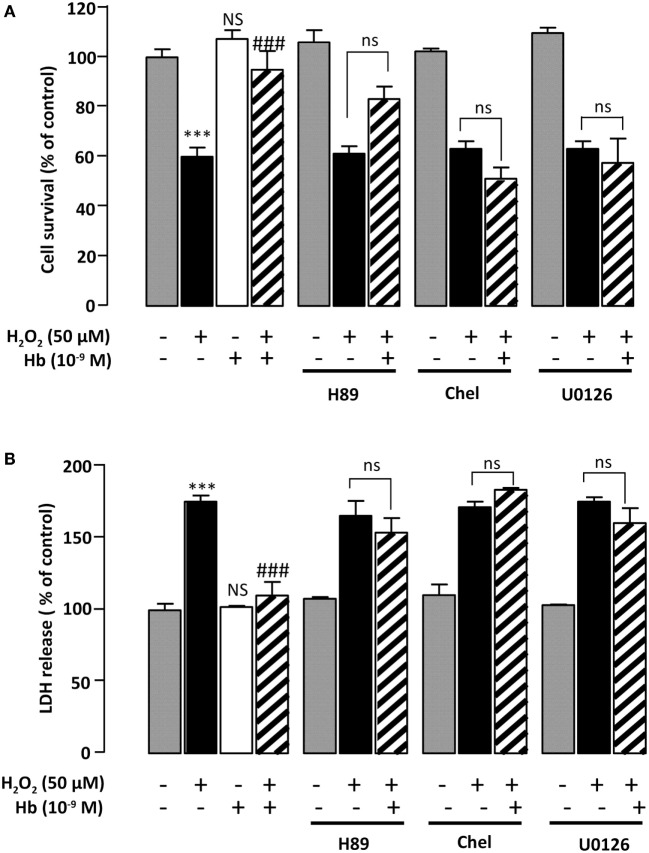 ) Hb (10−9 M) alone or with H2O2 (50 µM) in the absence () or presence of Hb (). (A) Cell death was determined by measuring LDH activity in culture media, and the results are expressed as percentage of LDH released in Triton-lysed cells. (B) Cell survival was quantified by measuring FDA fluorescence intensity, and the results are expressed as percentages of control. Data are means ± SEM of four independent experiments. ANOVA followed by Bonferroni’s test ***p < 0.001; NS, not statistically different from control cells. ###p < 0.001; ns, not statistically different vs. H2O2-treated cells.
References
LinkOut - more resources
Full Text Sources
Other Literature Sources
Research Materials