. 2017 Apr 11:8:569.
doi: 10.3389/fmicb.2017.00569. eCollection 2017.

Zinc-Dependent Transcriptional Regulation in Paracoccus denitrificans

Affiliations

Zinc-Dependent Transcriptional Regulation in Paracoccus denitrificans

Durga P Neupane et al. Front Microbiol. .

Abstract

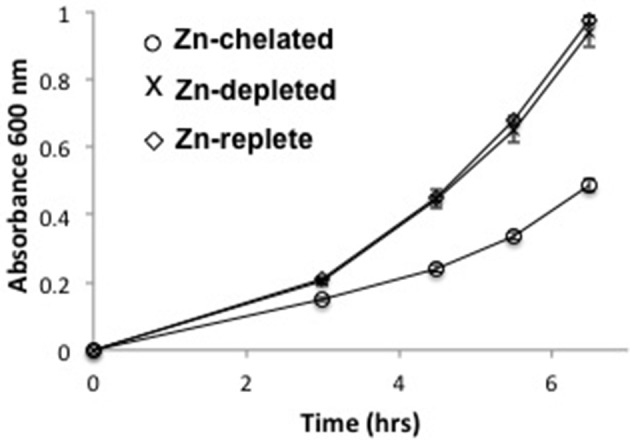
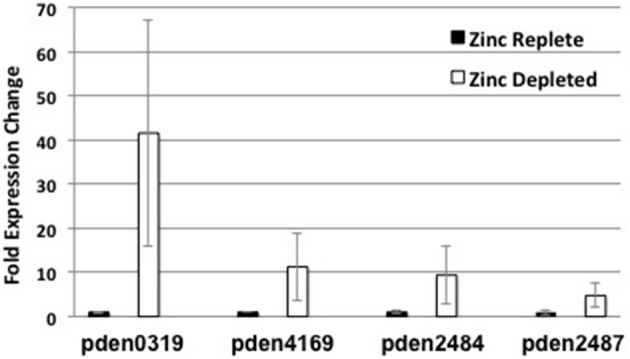
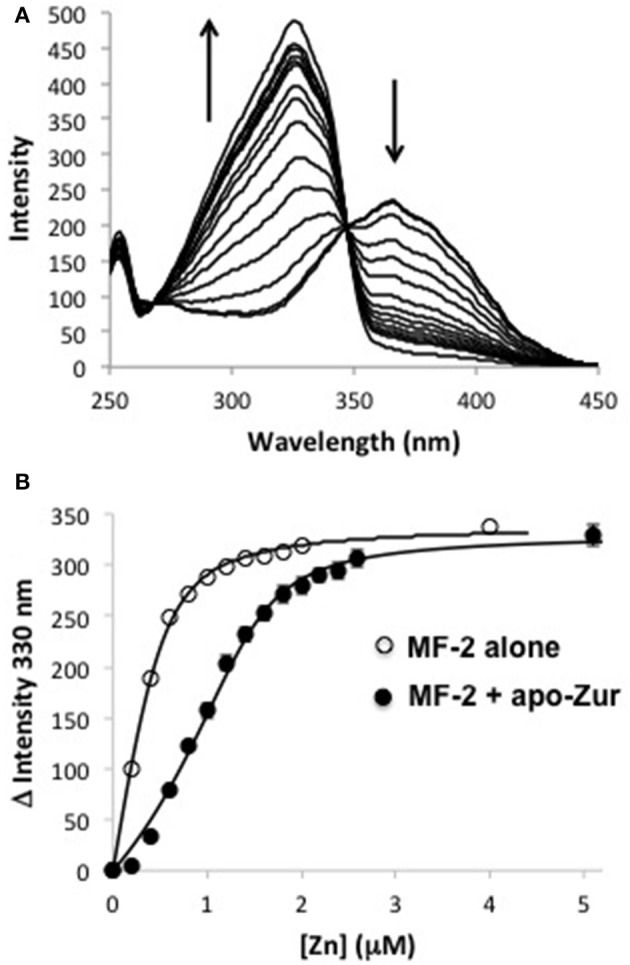
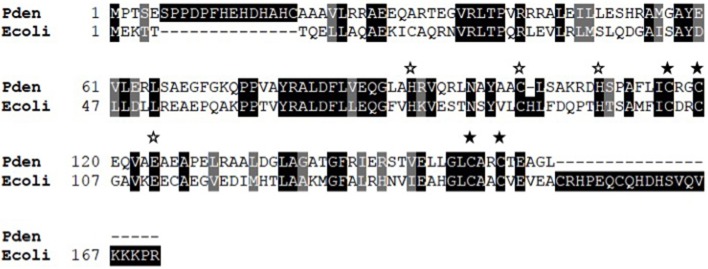
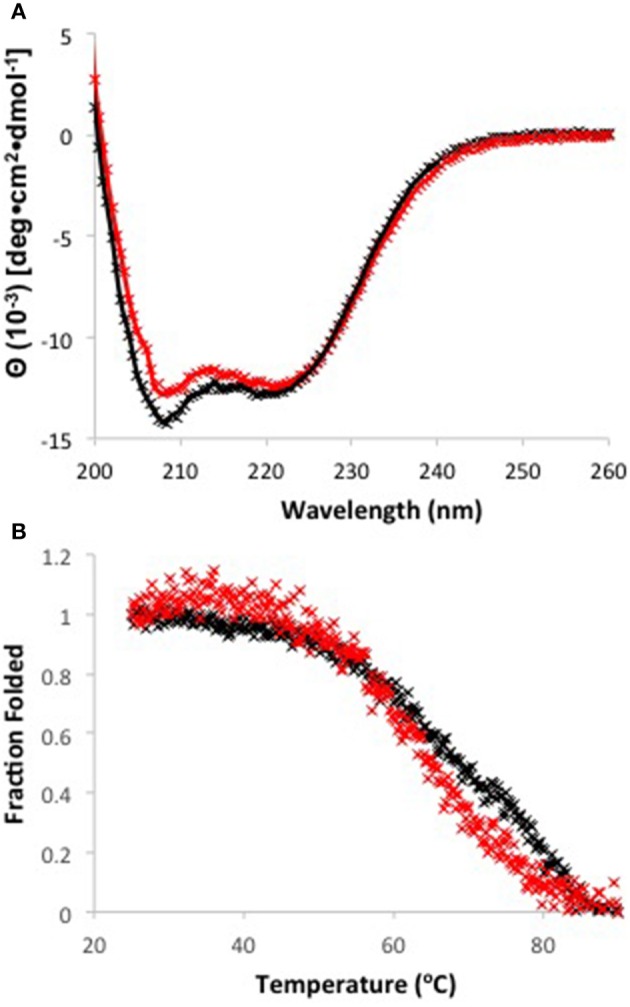
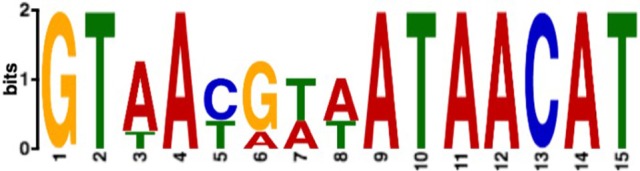
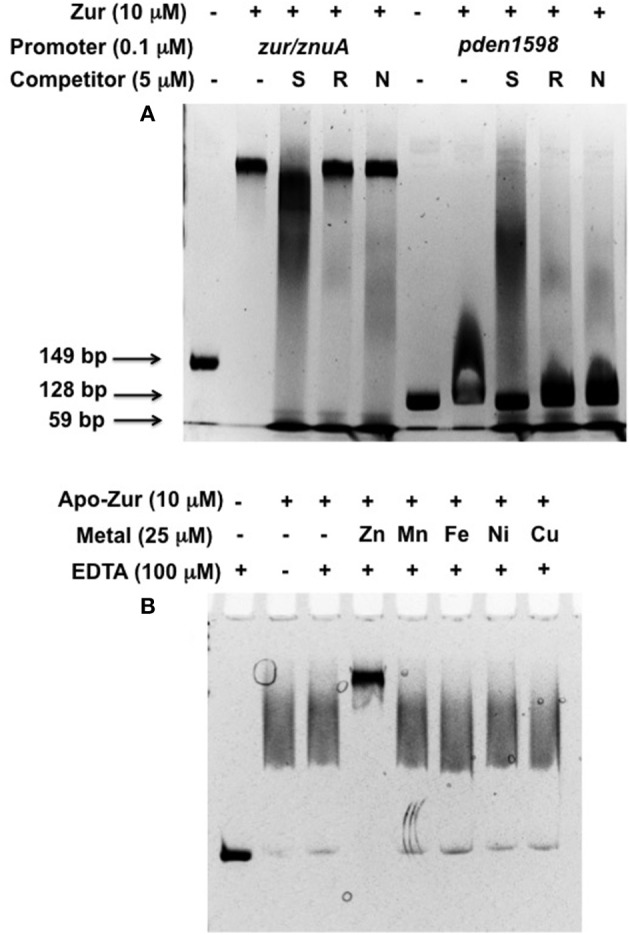
Zinc homeostasis is critical for bacterial survival and is mediated largely at the transcriptional level by the regulation of zinc uptake and efflux genes. Here we use RNA-seq to assess transcriptional changes as a result of zinc limitation in the denitrifying bacterium Paracoccus denitrificans. The results identify the differential expression of 147 genes, most of which were upregulated in zinc-depleted medium. Included in this set of genes are a large number of transition metal transporters, several transcription factors, and hypothetical proteins. Intriguingly, genes encoding nitric oxide reductase (norCB) and nitrite reductase (nirS) were also upregulated. A Zur consensus binding motif was identified in the promoters of the most highly upregulated genes. The zinc uptake regulator (Zur) from this organism was also characterized and shown to bind to the Zur motif in a zinc-dependent manner. This work expands our current understanding of the transcriptional response of gram-negative bacteria to zinc limitation and identifies genes involved in denitrification as part of the Zur regulon.

Keywords: RNA-seq; gene regulation; metal homeostasis; transcription factors; zinc.


Figures

Figure 1
Figure 1
Growth curves measured at 600 nm for P. denitrificans grown in Zn-replete, Zn-depleted or Zn-chelated media. Error bars represent the standard deviation of measurements from three independent cultures.
Figure 2
Figure 2
qRT-PCR evaluation of relative expression levels of genes identified as upregulated by RNA-seq from samples grown in Zn-replete (black bars) or Zn-depleted (white bars) media. Error bars represent the mean ± S.E. (n = 3). Pden0319, pden4169, pden2484, and pden2487 encode NRAMP transporter, nitrate transporter, nitric oxide reductase, and nitrite reductase genes, respectively.
Figure 3
Figure 3
Competitive binding assays for zinc with apo-Zur and MF-2. (A) Representative fluorescence excitation spectra (λem = 510 nm) of 0.5 μM MF-2 and 1.0 apo-Zur titrated with increasing ZnCl2. Arrows indicate the direction of intensity change with increasing zinc. (B) Comparison of the intensity change at 330 nm for MF-2 alone or MF-2 + apo-Zur titrated with ZnCl2. Data for MF-2 alone is from a single experiment. Data for competitive binding is the average of three independent experiments, and error bars represent the mean ± S.E. (n = 3). Solid lines are least square fits of the data.
Figure 4
Figure 4
Sequence alignment of Zur homologs from P. denitrificans (Pden) and E. coli (Ecoli). Identical residues are shaded in black, similar residues in gray. Filled stars mark residues comprising the zinc binding A site while open stars mark those of the B site.
Figure 5
Figure 5
(A) Circular dichroism spectra for apo Zur in the absence (black) and presence (red) of 15 μM Zn. Data points are shown as (x) and fits are shown as solid lines. (B) Melt curves measured at 208 nm for apo (black) and holo (red) Zur.
Figure 6
Figure 6
The Zur consensus motif as determined by comparison of promoter DNA for strongly upregulated genes using MEME. Larger letters indicate more frequent usage in the motif.
Figure 7
Figure 7
EMSA results for Zur binding to promoter DNA. One hundred twenty to one hundred fifty bp of promoter DNA (0.1 μM) was incubated with increasing concentrations of Zur in the presence of 25 μM Zn and 100 μM EDTA. At the highest Zur concentration, a 5-fold excess of salmon sperm DNA (50 μg/ml) was included to test the specificity of promoter binding.
Figure 8
Figure 8
EMSA results for specific DNA and metal binding by Zur. (A) 0.1 μM of 149 bp zur/znuA (lanes 1–5) or 128 bp aztD (lanes 6–10) promoter DNA was combined with 10 μM Zur, 25 μM Zn, and 100 μM EDTA in the presence or absence of a competitor oligomer of 59 bp at 5 μM containing the specific znuA/zur sequence (S), a randomized sequence (R) or the norC sequence (N). (B) 10 μM apo-Zur was used as is or incubated with 25 μM of the indicated metal prior to addition of 100 μM EDTA and 0.1 μM znuA/zur promoter DNA.

References

    1. Anderegg G. H. E., Podder N. G., Wenk F. (1977). Pyridinderivate als Komplexbildner. XI1. Die thermodynamik der metallkomplexbildung mit Bis-, Tris-, and Tetrakis[(2-pyridyl)methyl]-aminen. Helv. Chem. Acta 60, 123–140. 10.1002/hlca.19770600115 - DOI
    1. Anders S., Huber W. (2010). Differential expression analysis for sequence count data. Genome Biol. 11:R106. 10.1186/gb-2010-11-10-r106 - DOI - PMC - PubMed
    1. Bailey T. L., Gribskov M. (1998). Combining evidence using p-values: application to sequence homology searches. Bioinformatics 14, 48–54. 10.1093/bioinformatics/14.1.48 - DOI - PubMed
    1. Bailey T. L., Williams N., Misleh C., Li W. W. (2006). MEME: discovering and analyzing DNA and protein sequence motifs. Nucleic Acids Res. 34, W369–W373. 10.1093/nar/gkl198 - DOI - PMC - PubMed
    1. Berntsson R. P., Smits S. H., Schmitt L., Slotboom D. J., Poolman B. (2010). A structural classification of substrate-binding proteins. FEBS Lett. 584, 2606–2617. 10.1016/j.febslet.2010.04.043 - DOI - PubMed

LinkOut - more resources