. 2017 Apr 11:8:564.
doi: 10.3389/fpls.2017.00564. eCollection 2017.

Modular Design of Picroside-II Biosynthesis Deciphered through NGS Transcriptomes and Metabolic Intermediates Analysis in Naturally Variant Chemotypes of a Medicinal Herb, Picrorhiza kurroa

Affiliations

Modular Design of Picroside-II Biosynthesis Deciphered through NGS Transcriptomes and Metabolic Intermediates Analysis in Naturally Variant Chemotypes of a Medicinal Herb, Picrorhiza kurroa

Varun Kumar et al. Front Plant Sci. .

Abstract

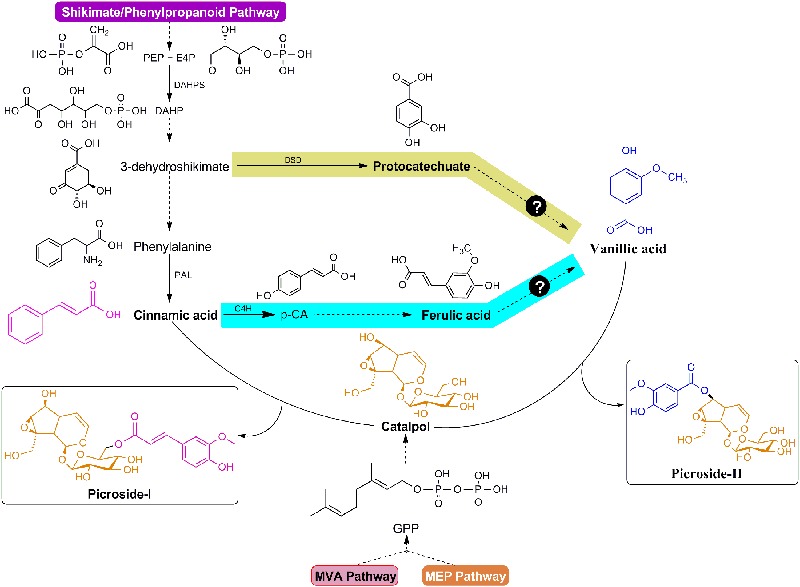
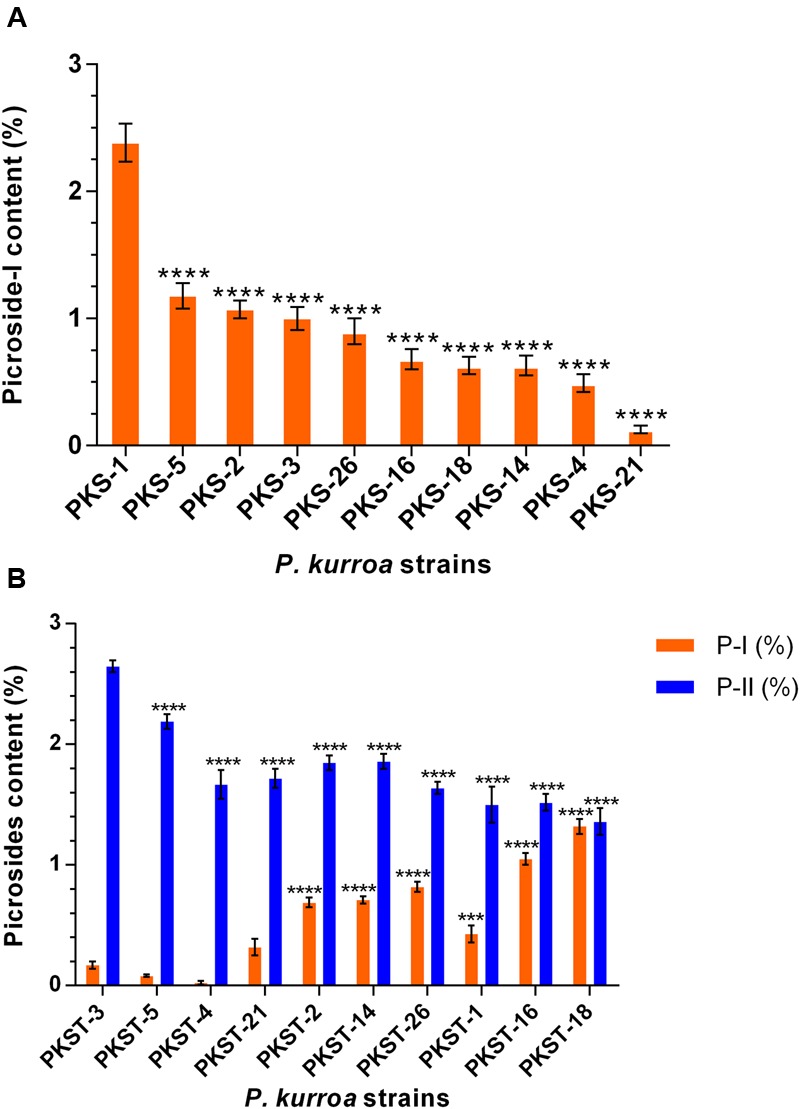
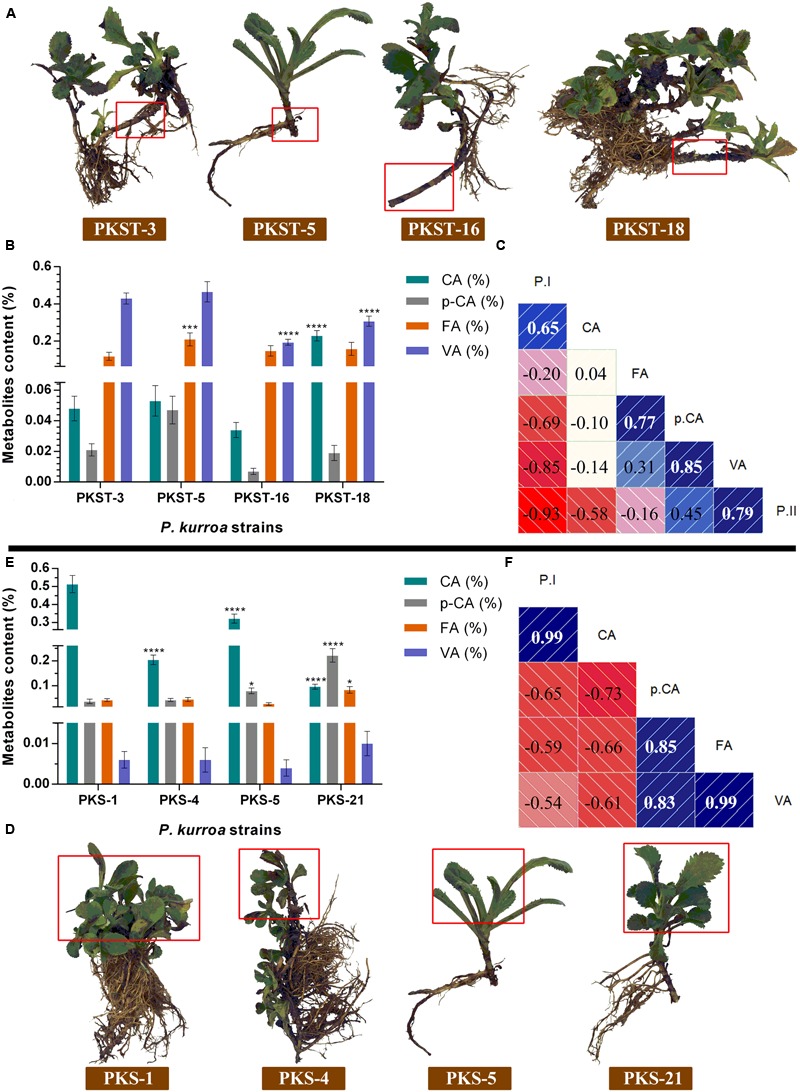
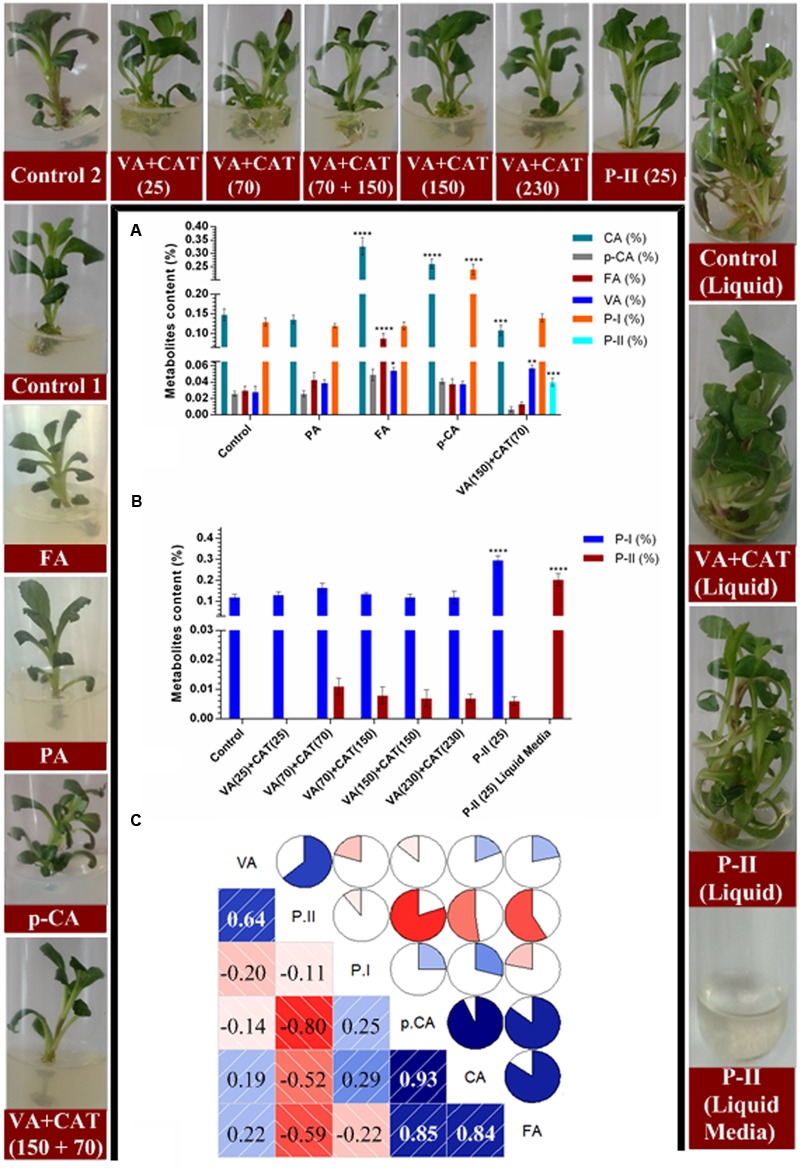
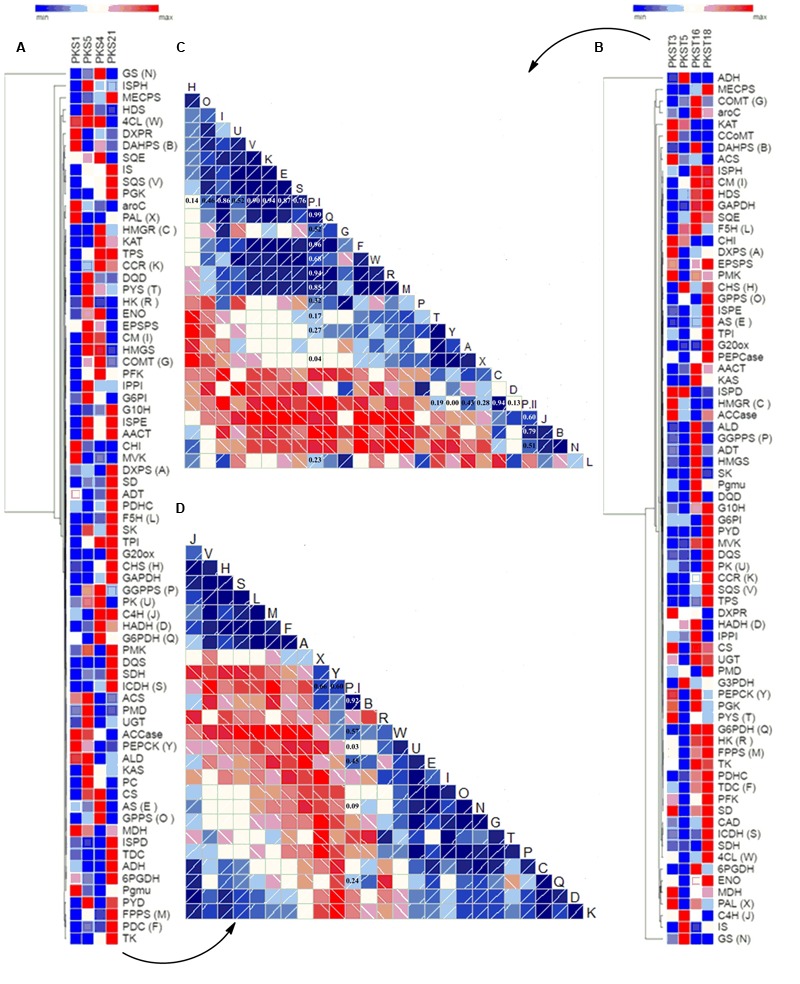
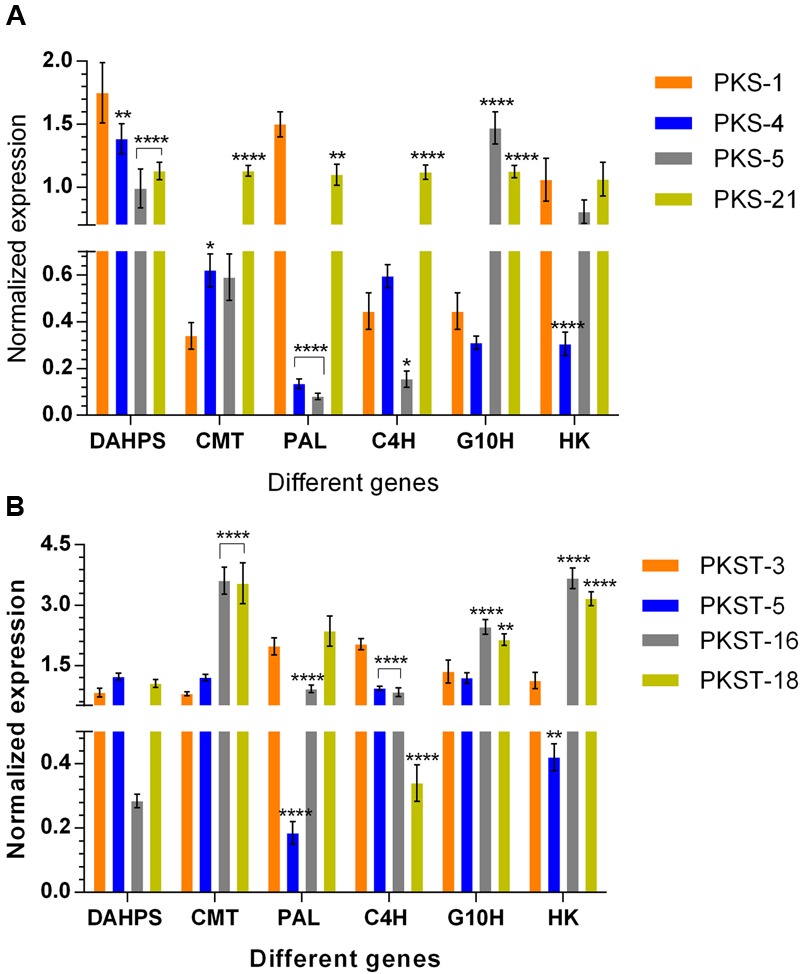
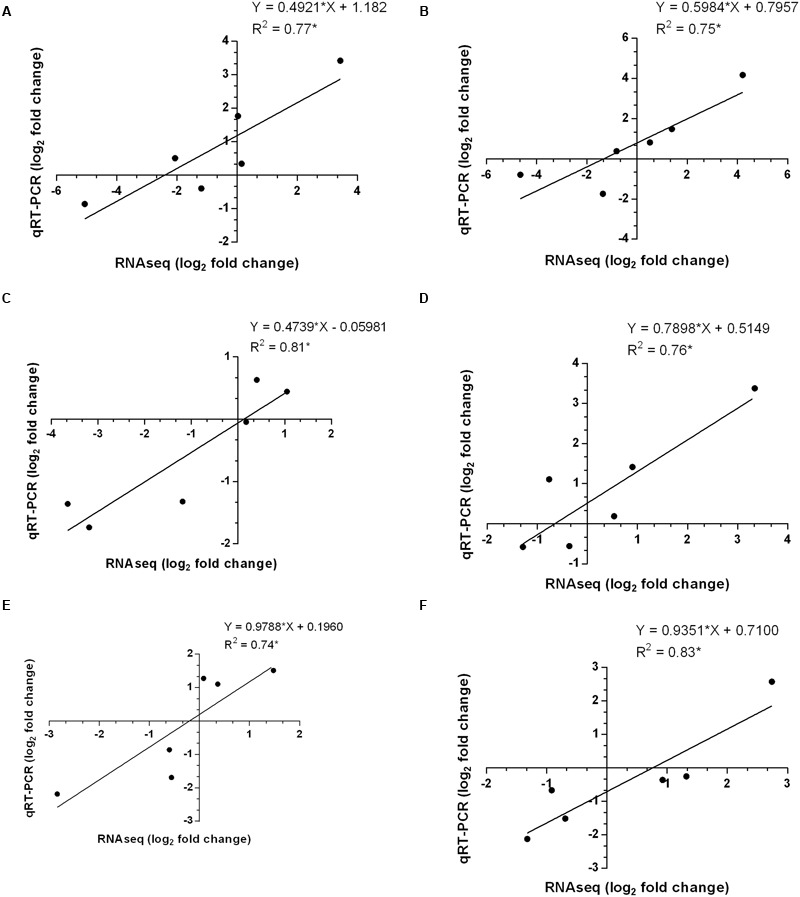
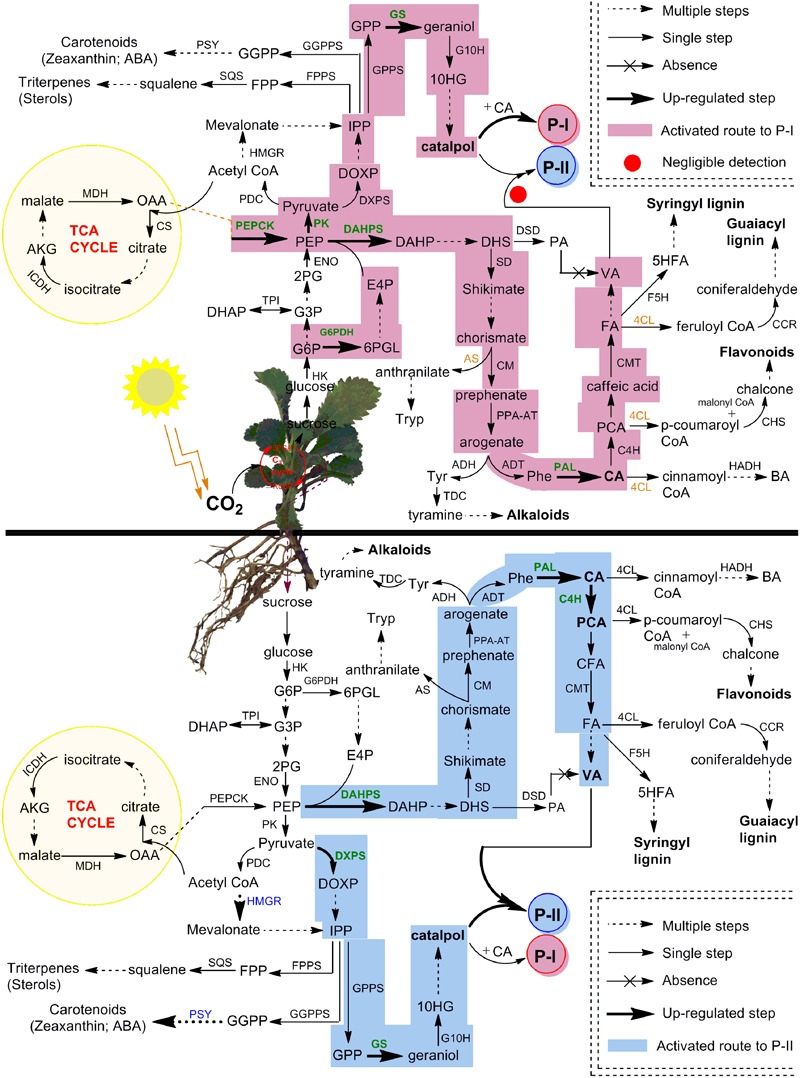
Picroside-II (P-II), an iridoid glycoside, is used as an active ingredient of various commercial herbal formulations available for the treatment of liver ailments. Despite this, the knowledge of P-II biosynthesis remains scarce owing to its negligence in Picrorhiza kurroa shoots which sets constant barrier for function validation experiments. In this study, we utilized natural variation for P-II content in stolon tissues of different P. kurroa accessions and deciphered its metabolic route by integrating metabolomics of intermediates with differential NGS transcriptomes. Upon navigating through high vs. low P-II content accessions (1.3-2.6%), we have established that P-II is biosynthesized via degradation of ferulic acid (FA) to produce vanillic acid (VA) which acts as its immediate biosynthetic precursor. Moreover, the FA treatment in vitro at 150 μM concentration provided further confirmation with 2-fold rise in VA content. Interestingly, the cross-talk between different compartments of P. kurroa, i.e., shoots and stolons, resolved spatial complexity of P-II biosynthesis and consequently speculated the burgeoning necessity to bridge gap between VA and P-II production in P. kurroa shoots. This work thus, offers a forward looking strategy to produce both P-I and P-II in shoot cultures, a step toward providing a sustainable production platform for these medicinal compounds via-à-vis relieving pressure from natural habitat of P. kurroa.

Keywords: NGS transcriptomes; Picrorhiza kurroa; correlation; metabolic flux; picrosides.


Figures

FIGURE 1
FIGURE 1
Modular design of P-I and P-II biosynthetic pathways. The structures of P-I and P-II linked to cinnamic acid/vanillic acid (purple/blue color) moieties and catalpol (orange color). Question marks indicate plausible routes for vanillic acid production.
FIGURE 2
FIGURE 2
Determination of picrosides contents in different tissues of Picrorhiza kurroa accessions; (A) shoots and (B) stolons. The data presented as means ± SD (n = 3). Significance was evaluated within picrosides contents between different accessions (∗∗∗p < 0.001, ∗∗∗∗p < 0.0001).
FIGURE 3
FIGURE 3
Comparative analysis of intermediate metabolites contents among different tissues of P. kurroa accessions; (A,D) different P. kurroa accessions selected for stolons and shoots, respectively; (B,E) variations in metabolites contents between stolons and shoots, respectively and; (C,F) correlogram showing correlations between tested metabolites and picrosides contents among stolons and shoots, respectively. Correlations are presented in the form of graphs filled in proportion to the Pearson’s correlation coefficient values. Clock-wise occupied with blue color depict positive correlations while anti-clockwise graphs filled with red color indicate negative correlations. The data presented as means ± SD (n = 3). Significance was evaluated within metabolites contents between different accessions (p < 0.05, ∗∗∗p < 0.001, ∗∗∗∗p < 0.0001).
FIGURE 4
FIGURE 4
Effects of various precursor’s feeding on the contents of tested metabolites; (A) variations in metabolites contents between different precursor treatments, i.e., PRCA, FA, and p-CA at 150 μM concentration along with 150 μM VA + 70 μM CAT; (B) variations in picrosides contents among different concentrations of VA+CAT along with P-II and liquid media remained after the collection of samples and; (C) correlogram showing correlations between tested metabolites and picrosides contents among different precursors treated samples. Correlations are presented in the form of pie graphs filled in proportion to the Pearson’s correlation coefficient values. Clock-wise occupied with blue color depict positive correlations while anti-clockwise pie graphs filled with red color indicate negative correlations. The data presented as means ± SD (n = 3). Significance was evaluated within metabolites contents between different precursor’s treatments (p < 0.05, ∗∗p < 0.01, ∗∗∗p < 0.001, ∗∗∗∗p < 0.0001).
FIGURE 5
FIGURE 5
Differential expression analysis of genes involved in secondary metabolism among different tissues of P. kurroa accessions; (A,B) cluster analysis of differentially expressed genes patterns between different P. kurroa accessions selected for shoots and stolons, respectively; (C,D) correlations in terms of Pearson’s correlation coefficients depicted using correlogram between selected genes and metabolites contents among different stolons and shoots, respectively. The data is represented in the form of graphs filled in proportion to the Pearson’s correlation coefficient values. Clock-wise occupied with blue color depict positive correlations while anti-clockwise graphs filled with red color indicate negative correlations.
FIGURE 6
FIGURE 6
Expression profiling of selected genes in different tissues of P. kurroa accessions; (A) shoots and (B) stolons. Expression values were normalized with levels of 26S reference gene. The data presented as means ± SD (n = 3). Significance was evaluated for each gene between different accessions (p < 0.05, ∗∗p < 0.01, ∗∗∗∗p < 0.0001).
FIGURE 7
FIGURE 7
Correlations determined between differential gene expression patterns of selected genes among transcriptomes data and qRT-PCR in different tissues of P. kurroa accessions; (A) PKS-1 vs. PKS-4, (B) PKS-1 vs. PKS-5, (C) PKS-1 vs. PKS-21, (D) PKST-3 vs. PKST-5, (E) PKST-3 vs. PKST-16 and, (F) PKST-3 vs. PKST-18. R2 = Coefficient of determination.
FIGURE 8
FIGURE 8
Complete framework of metabolic network depicted P-I and P-II biosynthesis in different compartments of P. kurroa. The established routes of P-I and P-II production were presented with different colors to highlight the modulations in shoots and stolons tissues of P. kurroa. Up-regulated gene expressions were highlighted with bold and green color. The abbreviations are elaborated in Supplementary Table 3.

References

    1. Alvarez A., Montesano M., Schmelz E., de Leon I. P. (2016). Activation of shikimate, phenylpropanoid, oxylipins, and auxin pathways in Pectobacterium carotovorum elicitors-treated moss. Front. Plant Sci. 35:328 10.3389/fpls.2016.00328 - DOI - PMC - PubMed
    1. Besseau S., Hoffmann L., Geoffroy P., Lapierre C., Pollet B., Legrand M. (2007). Flavonoid accumulation in Arabidopsis repressed in lignin synthesis affects auxin transport and plant growth. Plant Cell 19 148–162. 10.1105/tpc.106.044495 - DOI - PMC - PubMed
    1. Choi J., Choi B. K., Kim J. S., Lee J. W., Park H. A., Ryu H. W., et al. (2016). Picroside II attenuates airway inflammation by downregulating the transcription factor GATA3 and Th2-related cytokines in a mouse model of HDM-induced allergic asthma. PLoS ONE 11:e0167098 10.1371/journal.pone.0167098 - DOI - PMC - PubMed
    1. Comu F. M., Kilic Y., Ozer A., Kirisci M., Dursun A. D., Tatar T., et al. (2016). Effect of picroside II on erythrocyte deformability and lipid peroxidation in rats subjected to hind limb ischemia reperfusion injury. Drug Des. Dev. Ther. 10 927–931. 10.2147/DDDT.S95418 - DOI - PMC - PubMed
    1. Conesa A., Gotz S., Garcia-Gomez J. M., Terol J., Talon M., Robles M. (2005). Blast2GO: a universal tool for annotation, visualization and analysis in functional genomics research. Bioinformatics 21 3674–3676. 10.1093/bioinformatics/bti610 - DOI - PubMed