. 2017 May 23;11(5):4542-4552.
doi: 10.1021/acsnano.6b08551. Epub 2017 Apr 26.

Inhaled Nanoparticles Accumulate at Sites of Vascular Disease

Affiliations

Inhaled Nanoparticles Accumulate at Sites of Vascular Disease

Mark R Miller et al. ACS Nano. .

Erratum in

  • Correction to"Inhaled Nanoparticles Accumulate at Sites of Vascular Disease".
    Miller MR, Raftis JB, Langrish JP, McLean SG, Samutrtai P, Connell SP, Wilson S, Vesey AT, Fokkens PHB, Boere AJF, Krystek P, Campbell CJ, Hadoke PWF, Donaldson K, Cassee FR, Newby DE, Duffin R, Mills NL. Miller MR, et al. ACS Nano. 2017 Oct 24;11(10):10623-10624. doi: 10.1021/acsnano.7b06327. Epub 2017 Oct 4. ACS Nano. 2017. PMID: 28976185 Free PMC article. No abstract available.

Abstract

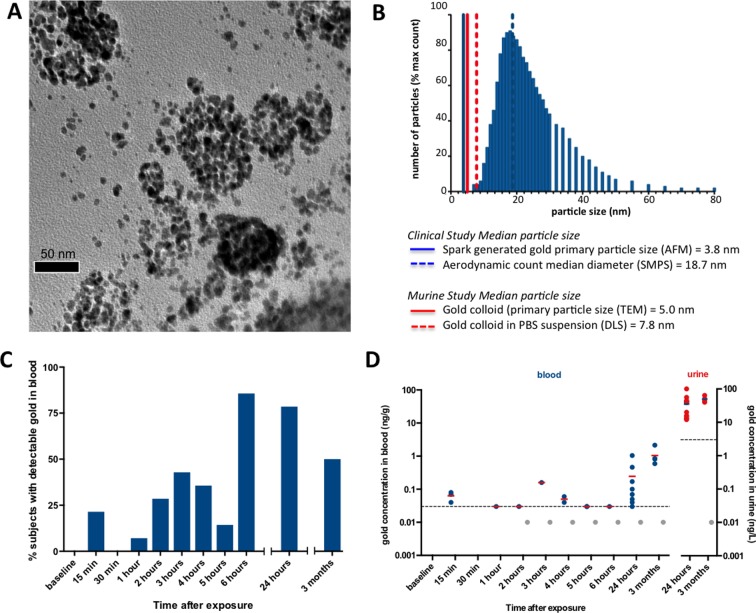
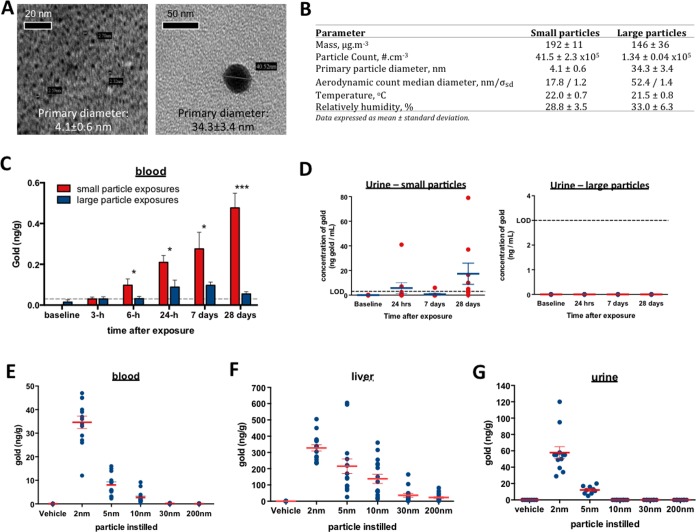
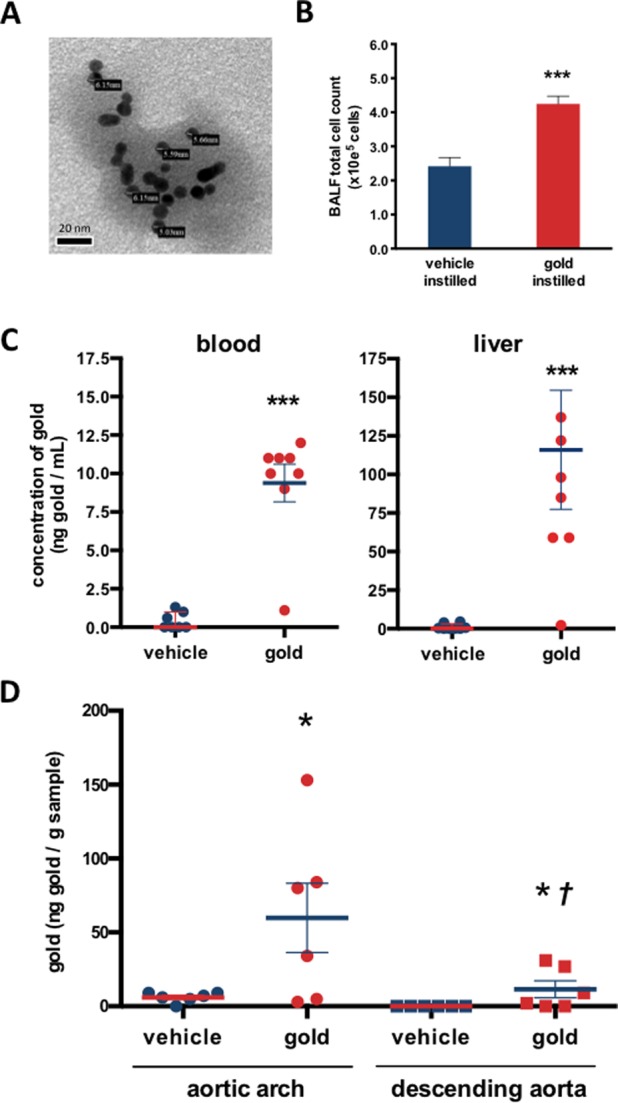
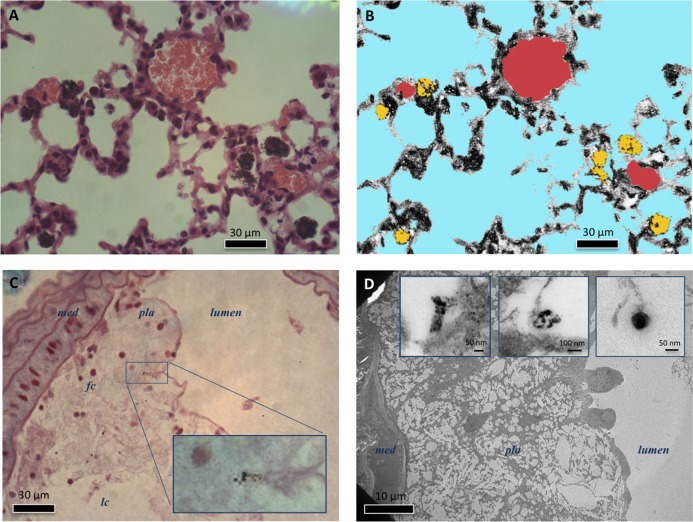
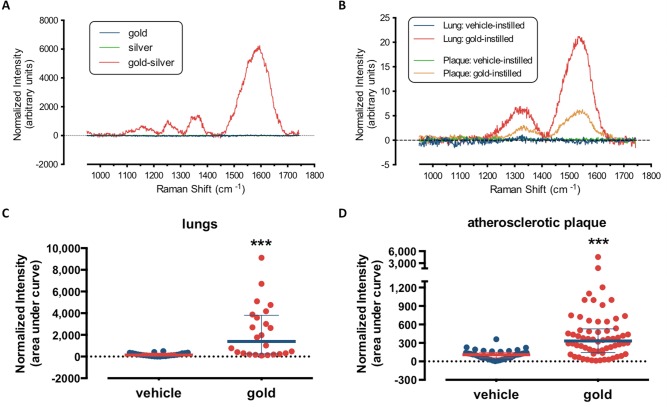
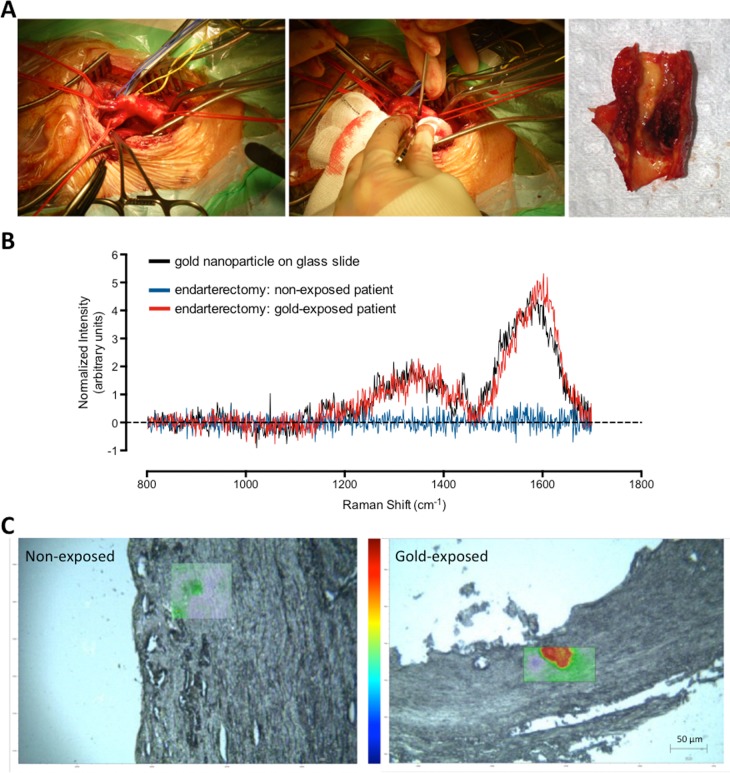
The development of engineered nanomaterials is growing exponentially, despite concerns over their potential similarities to environmental nanoparticles that are associated with significant cardiorespiratory morbidity and mortality. The mechanisms through which inhalation of nanoparticles could trigger acute cardiovascular events are emerging, but a fundamental unanswered question remains: Do inhaled nanoparticles translocate from the lung in man and directly contribute to the pathogenesis of cardiovascular disease? In complementary clinical and experimental studies, we used gold nanoparticles to evaluate particle translocation, permitting detection by high-resolution inductively coupled mass spectrometry and Raman microscopy. Healthy volunteers were exposed to nanoparticles by acute inhalation, followed by repeated sampling of blood and urine. Gold was detected in the blood and urine within 15 min to 24 h after exposure, and was still present 3 months after exposure. Levels were greater following inhalation of 5 nm (primary diameter) particles compared to 30 nm particles. Studies in mice demonstrated the accumulation in the blood and liver following pulmonary exposure to a broader size range of gold nanoparticles (2-200 nm primary diameter), with translocation markedly greater for particles <10 nm diameter. Gold nanoparticles preferentially accumulated in inflammation-rich vascular lesions of fat-fed apolipoproteinE-deficient mice. Furthermore, following inhalation, gold particles could be detected in surgical specimens of carotid artery disease from patients at risk of stroke. Translocation of inhaled nanoparticles into the systemic circulation and accumulation at sites of vascular inflammation provides a direct mechanism that can explain the link between environmental nanoparticles and cardiovascular disease and has major implications for risk management in the use of engineered nanomaterials.

Keywords: air pollution; atherosclerosis; cardiovascular; gold; nanoparticle; translocation.


Conflict of interest statement

The authors declare no competing financial interest.

Figures

Figure 1
Figure 1
Gold nanoparticle translocation in man. (A) Representative transmission electron micrograph showing gold particles generated by the spark generator with a primary particle size of 3.8 nm in loose agglomerates (B) with an aerodynamic count median diameter of 18.7 nm (geometric standard deviation = 1.5). Abbreviations: AFM = atomic force microscopy; DLS = dynamic light scattering; SMPS = scanning mobility particle sizer; and TEM = transmission electron microscopy. (C) In man, gold was detectable in the bloodstream in some subjects within 15 min of the 2 h exposure and was detectable in the majority of subjects at 24 h (12/14 subjects, 86%). (D) Quantification of gold concentrations in blood and urine. Blood concentrations were close to the limit of quantification (0.03 ng/g of blood; dotted line) at early time points. Gray symbols represent values below the limit of quantification, but above the limit of detection (0.01 ng/g of blood). Data expressed as median ± interquartile range.
Figure 2
Figure 2
Effect of particle size on translocation. (A) Representative transmission electron micrograph showing gold particles (4 nm primary diameter) generated by the spark generator (i) with and (ii) without particle fusing to obtain large (∼34 nm primary diameter) particulates from the second clinical exposure study. (B) Characteristics for aerosolized gold particle exposures in clinical studies. (C) Levels of gold detectable in the bloodstream in subjects exposed to different sizes of gold particles. (D) Levels of gold detectable in the urine of subjects exposed to different sizes of gold particles. (E) Levels of gold in the blood of mice exposed to 5 weeks of repeated pulmonary instillation with different sizes of gold nanoparticles. (F) murine liver. (G) murine urine. Data expressed as mean ± SEM, unless otherwise stated.
Figure 3
Figure 3
Accumulation of gold nanoparticles in tissues of ApoE–/– mice following pulmonary instillation. (A) Transmission electron micrograph of gold particles used for instillations in mice, with a primary particle size of 5 nm and a median agglomerate size of 7.8 nm. (B) Instillation of gold nanoparticles caused mild lung inflammation, measured as total cell count in BALF. Mean ± SEM, ***P < 0.001, unpaired t-test, n = 6. (C) Gold was detectable in the blood and liver of gold-treated apolipoprotein-E knockout (ApoE–/–) mice. (D) Gold particles accumulated in areas of the vasculature rich in atheroma (aortic arch) compared to those free of plaque (descending aorta). Mean ± SEM, n = 7–8 (preclinical study). *P < 0.05, ***P < 0.001, Mann–Whitney test compared to vehicle-treated animals, P < 0.05, Mann–Whitney test compared to aortic arch of gold-treated mice.
Figure 4
Figure 4
Visualization of gold nanoparticles in the lung and atherosclerotic plaques of ApoE–/– mice. (A) Gold particles were clearly visible within lungs of gold-treated animals, largely within alveolar macrophages. (B) Computational coloring to illustrate capillaries (red), alveolar spaces (blue), and gold particles (yellow). (C) Section of atherosclerotic plaque from a gold-treated mouse showing a distinctive cluster of red-purple granules within a macrophage-derived foam cell. (D) Transmission electron micrograph of atherosclerotic plaque within the aortic arch. Insets: examples of particle clusters within the plaques of gold-treated mice; med = vascular media, pla = atherosclerotic plaque, lumen = blood vessel lumen, fc = foam cell, lc = lipid core.
Figure 5
Figure 5
Raman spectroscopy to confirm the presence of particulate gold in lung and atherosclerotic plaques of ApoE–/– mice. (A) Suspensions of gold nanoparticles following conjugation with silver produced a unique Raman spectra (red) that was not seen with either gold (blue) or silver alone (green). (B) Representative Raman spectra from silver-augmented gold in sections of lung (red) and atherosclerotic plaques (orange) from a gold-treated mouse, not seen in lung (blue) or plaque (green) sections from a vehicle-treated mouse. Raman spectra from (C) lung and (D) atherosclerotic plaques. Data expressed as median ± interquartile range. ***P < 0.001, Mann–Whitney test comparing gold-treated (n = 64 grids from 3 mice) to vehicle-treated (n = 39 grids from 2 mice) mice.
Figure 6
Figure 6
Gold nanoparticle exposures in patients undergoing carotid endarterectomy. (A) Isolation of atherosclerotic plaque from the carotid artery. (B) Overlaid representative Raman spectroscopy spectra: black = silver-stained spark-generated gold nanoparticles on glass slide (no tissue); blue = silver-stained endarterectomy sample from nonexposed patient; and red = silver-stained endarterectomy sample from gold-exposed patient. (C) Visualization of gold in endarterectomy samples using heat-map of Raman intensity. Highlighted box within tissue denotes scanned area, with blue-green color representing baseline intensity (no gold) and red color showing high Raman intensity (gold particulate).

Similar articles

Cited by

References

    1. Malysheva A.; Lombi E.; Voelcker N. H. Bridging the divide between human and environmental nanotoxicology. Nat. Nanotechnol. 2015, 10, 835–844. 10.1038/nnano.2015.224. - DOI - PubMed
    1. Valsami-Jones E.; Lynch I. NANOSAFETY. How safe are nanomaterials?. Science 2015, 350, 388–389. 10.1126/science.aad0768. - DOI - PubMed
    1. Johnston H.; Pojana G.; Zuin S.; Jacobsen N. R.; Møller P.; Loft S.; Semmler-Behnke M.; McGuiness C.; Balharry D.; Marcomini A.; Wallin H.; Kreyling W.; Donaldson K.; Tran L.; Stone V. Engineered nanomaterial risk. Lessons learnt from completed nanotoxicology studies: potential solutions to current and future challenges. Crit. Rev. Toxicol. 2013, 43, 1–20. 10.3109/10408444.2012.738187. - DOI - PubMed
    1. Donaldson K.; Duffin R.; Langrish J. P.; Miller M. R.; Mills N. L.; Poland C. A.; Raftis J.; Shah A.; Shaw C. A.; Newby D. E. Nanoparticles and the cardiovascular system: a critical review. Nanomedicine (London, U. K.) 2013, 8, 403–423. 10.2217/nnm.13.16. - DOI - PubMed
    1. World Health Organization. 7 million premature deaths annually linked to air pollution. http://www.who.int/mediacentre/news/releases/2014/air-pollution/en/. Accessed on March 29, 2017.

Publication types