

A unifying mathematical framework for experimental TCR-pMHC kinetic constants
- PMID: 28443634
- PMCID: PMC5405415
- DOI: 10.1038/srep46741
A unifying mathematical framework for experimental TCR-pMHC kinetic constants
Abstract
Receptor binding and triggering are central in Immunology as T cells activated through their T cell receptors (TCR) by protein antigens orchestrate immune responses. In order to understand receptor-ligand interactions, many groups working with different experimental techniques and assays have generated a vast body of knowledge during the last decades. However, in recent years a type of assays, referred to as two-dimensional or membrane-to-membrane, has questioned our current understanding of the role of different kinetic constants (for instance, on- versus off-rate constants) on TCR-ligand interaction and subsequent T cell activation. Here we present a general mathematical framework that provides a unifying umbrella to relate fundamental and effective (or experimentally determined) kinetic constants, as well as describe and compare state-of-the-art experimental methods. Our framework is able to predict the correlations between functional output, such as 1/EC50, and effective kinetic constants for a range of different experimental assays (in two and three dimensions). Furthermore, our approach can be applied beyond Immunology, and serve as a "translation method" for the biochemical characterization of receptor-ligand interactions.
Conflict of interest statement
The authors declare no competing financial interests.
Figures
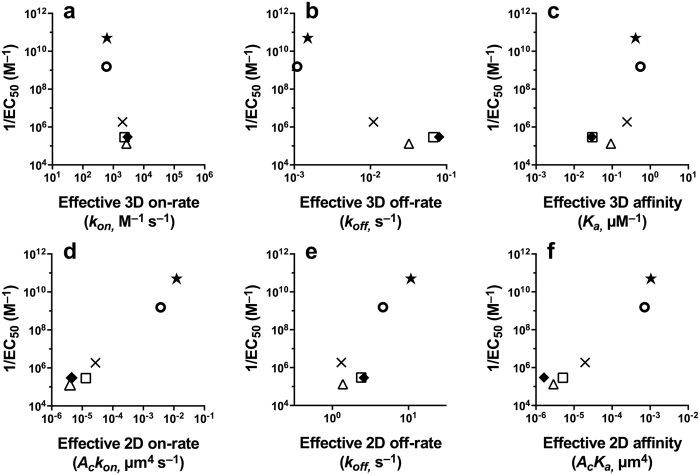
 , E1;
, E1;  , V-OVA;
  , R4.
, R4.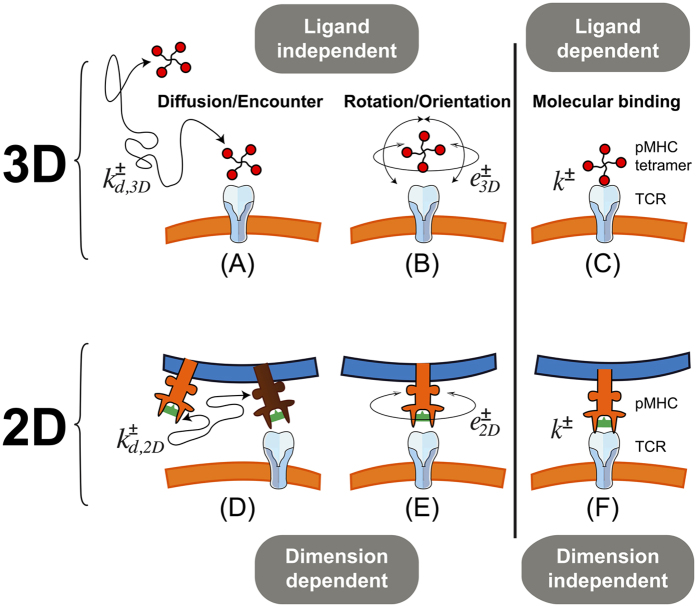
 ,
,  for diffusion/encounter, e+, e− for rotation/orientation and k+, k− for binding and unbinding, respectively. The fundamental kinetic constants are defined in Table 1.
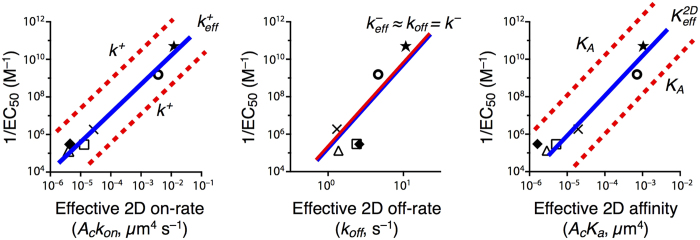
 ,
,  ,
,  and
and  , as determined with the AF assay and the SS model. The red lines correspond to the fundamental binding constants (k+, k− and KA). A dashed red line indicates an uncertainty in the direction and magnitude of the shift corresponding to a given fundamental binding parameter, depending on whether
  is positive or negative and whether
  is relatively large or small. See details in Cases 1, 2 and 4.
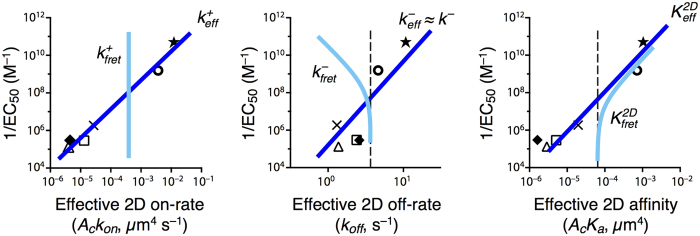
 ,
,  , and
, and  from the AF assay. The cyan lines are the predicted trend lines for the correlation between log(1/EC50) and the logarithm of the effective parameters
  ,
,  , and
, and  from the 2D FRET assay, as inferred using the results in Cases 1 and 3 and further discussed in Case 4. Dashed vertical lines are drawn to help visualize the asymptotic limits of
  and
and  . Their particular positions, as well as that of cyan lines, are for illustrative purposes.
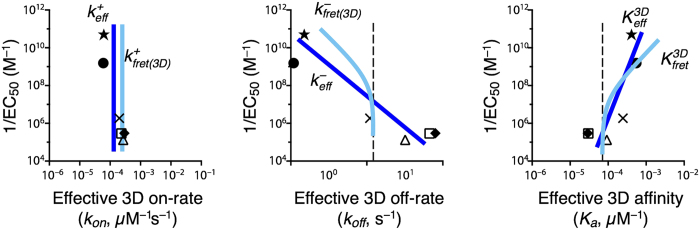
 ,
,  , and
, and  from the SPR assay. The cyan lines are the predicted trend lines for the correlation between log(1/EC50) and the logarithm of the effective parameters
  ,
,  , and
, and  from the 3D FRET assay, as inferred using the results in Case 5. Dashed vertical lines are drawn to help visualize the asymptotic limits of
  and
and  . Their particular positions, as well as that of cyan lines, are for illustrative purposes.
References
Publication types
MeSH terms
Substances
LinkOut - more resources
Full Text Sources
Other Literature Sources
