

Validation of numerical simulation methods in aortic arch using 4D Flow MRI
- PMID: 28444501
- PMCID: PMC5519664
- DOI: 10.1007/s00380-017-0979-2
Validation of numerical simulation methods in aortic arch using 4D Flow MRI
Abstract
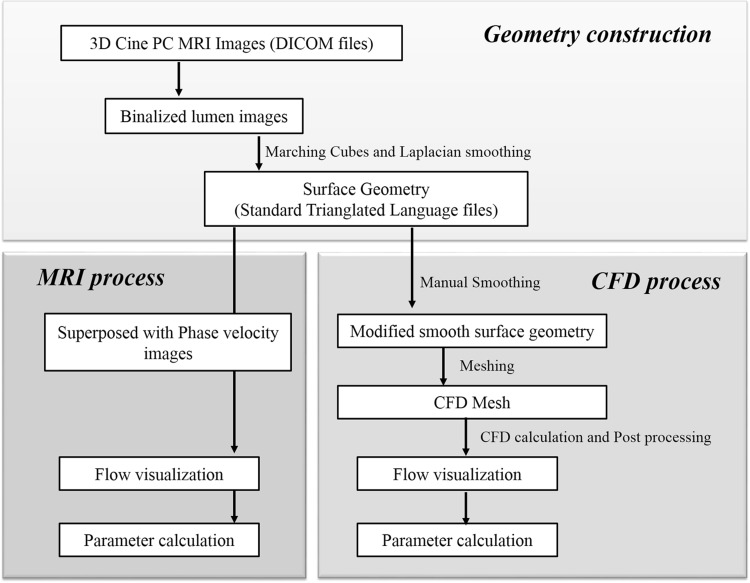
Computational fluid dynamics (CFD) are the gold standard in studying blood flow dynamics. However, CFD results are dependent on the boundary conditions and the computation model. The purpose of this study was to validate CFD methods using comparison with actual measurements of the blood flow vector obtained with four-dimensional (4D) flow magnetic resonance imaging (MRI). 4D Flow MRI was performed on a healthy adult and a child with double-aortic arch. The aortic lumen was segmented to visualize the blood flow. The CFD analyses were performed for the same geometries based on three turbulent models: laminar, large eddy simulation (LES), and the renormalization group k-ε model (RNG k-ε). The flow-velocity vector components, namely the wall shear stress (WSS) and flow energy loss (EL), of the MRI and CFD results were compared. The flow rate of the MRI results was underestimated in small vessels, including the neck vessels. Spiral flow in the ascending aorta caused by the left ventricular twist was observed by MRI. Secondary flow distal to the aortic arch was well realized in both CFD and MRI. The average correlation coefficients of the velocity vector components of MRI and CFD for the child were the highest for the RNG k-ε model (0.530 in ascending aorta, 0.768 in the aortic arch, 0.584 in the descending aorta). The WSS and EL values of MRI were less than half of those of CFD, but the WSS distribution patterns were quite similar. The WSS and EL estimates were higher in RNG k-ε and LES than in the laminar model because of eddy viscosity. The CFD computation realized accurate flow distal to the aortic arch, and the WSS distribution was well simulated compared to actual measurement using 4D Flow MRI. However, the helical flow was not simulated in the ascending aorta. The accuracy was enhanced by using the turbulence model, and the RNG k-ε model showed the highest correlation with 4D Flow MRI.
Keywords: Computational fluid dynamics; Flow energy loss; Phase-contrast MRI; Wall shear stress.
Conflict of interest statement
Dr. Keiichi Itatani is an equity shareholder and founder of the venture vendor for a blood flow analysis tool: Cardio Flow Design Inc. (Tokyo, Japan). Dr. Keiichi Itatani is an endowed chair financially supported by Medtronic Japan (Tokyo, Japan). Dr. Teruyasu Nishino is an equity shareholder and CEO of the venture vendor for a blood flow analysis tool: Cardio Flow Design Inc. (Tokyo, Japan).
Figures


References
-
- Sughimoto K, Shimamura Y, Tezuka C, Tezuka C, Tsubota K, Liu H, Okumura K, Masuda Y, Haneishi H. Effects of arterial blood flow on walls of the abdominal aorta: distributions of wall shear stress and oscillatory shear index determined by phase-contrast magnetic resonance imaging. Heart Vessels. 2016;31:1168–1175. doi: 10.1007/s00380-015-0758-x. - DOI - PubMed
Publication types
MeSH terms
LinkOut - more resources
Full Text Sources
Other Literature Sources
Medical
Research Materials
Miscellaneous
