. 2017 Oct;44(10):5120-5127.
doi: 10.1002/mp.12301. Epub 2017 Aug 20.

Photon-counting CT for simultaneous imaging of multiple contrast agents in the abdomen: An in vivo study

Affiliations

Photon-counting CT for simultaneous imaging of multiple contrast agents in the abdomen: An in vivo study

Rolf Symons et al. Med Phys. 2017 Oct.

Abstract

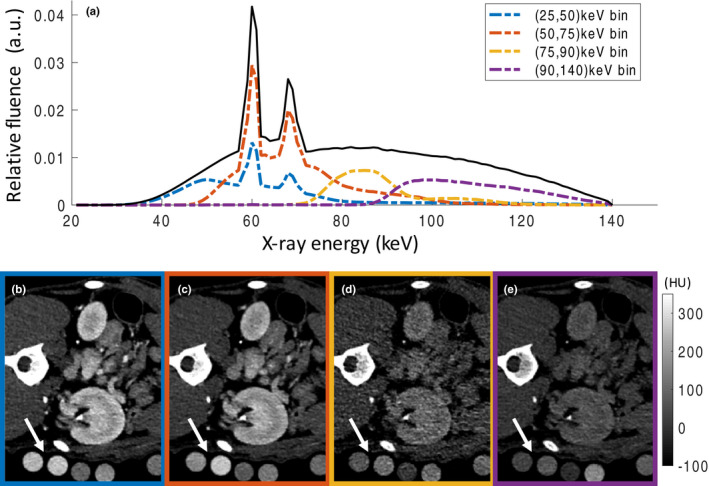
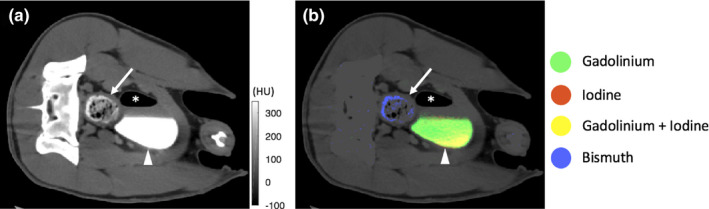
Purpose: To demonstrate the feasibility of spectral imaging using photon-counting detector (PCD) x-ray computed tomography (CT) for simultaneous material decomposition of three contrast agents in vivo in a large animal model.

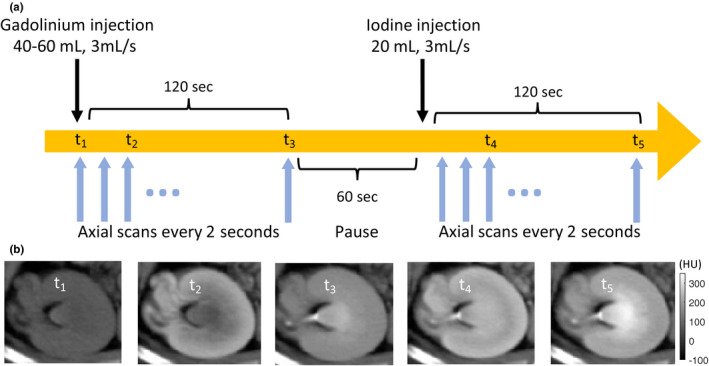
Methods: This Institutional Animal Care and Use Committee-approved study used a canine model. Bismuth subsalicylate was administered orally 24-72 h before imaging. PCD CT was performed during intravenous administration of 40-60 ml gadoterate meglumine; 3.5 min later, iopamidol 370 was injected intravenously. Renal PCD CT images were acquired every 2 s for 5-6 min to capture the wash-in and wash-out kinetics of the contrast agents. Least mean squares linear material decomposition was used to calculate the concentrations of contrast agents in the aorta, renal cortex, renal medulla and renal pelvis.

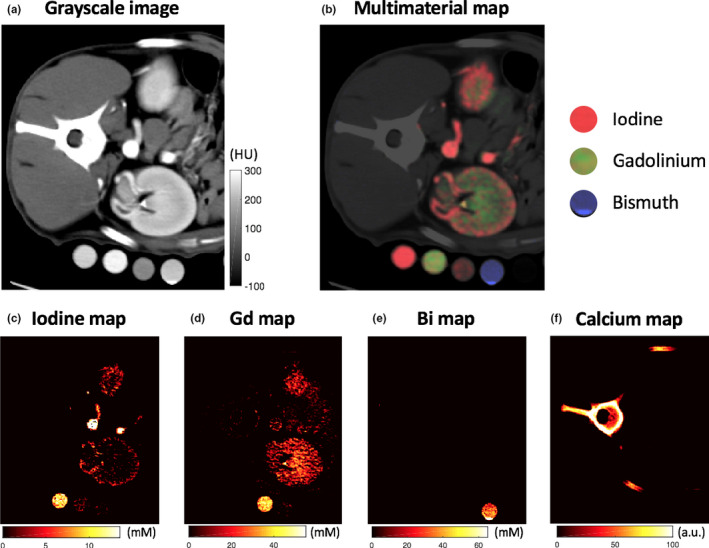
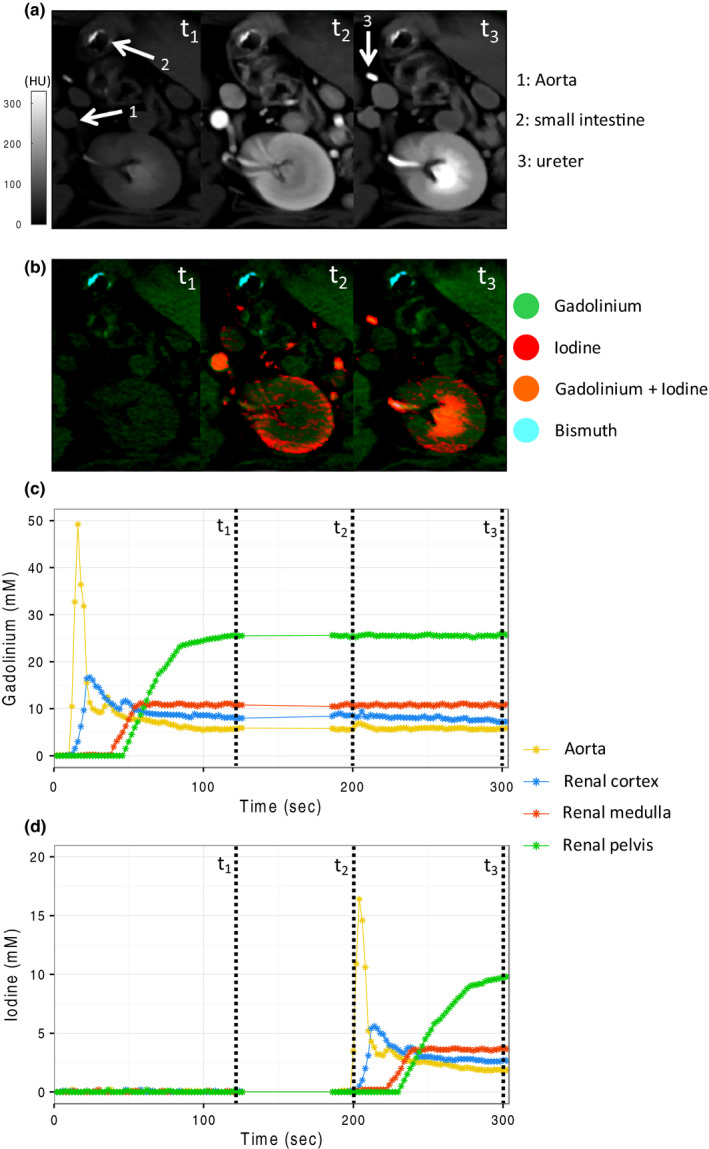
Results: Using reference vials with known concentrations of materials, we computed molar concentrations of the various contrast agents during each phase of CT scanning. Material concentration maps allowed simultaneous quantification of both arterial and delayed renal enhancement in a single CT acquisition. The accuracy of the material decomposition algorithm in a test phantom was -0.4 ± 2.2 mM, 0.3 ± 2.2 mM for iodine and gadolinium solutions, respectively. Peak contrast concentration of gadolinium and iodine in the aorta, renal cortex, and renal medulla were observed 16, 24, and 60 s after the start each injection, respectively.

Conclusion: Photon-counting spectral CT allowed simultaneous material decomposition of multiple contrast agents in vivo. Besides defining contrast agent concentrations, tissue enhancement at multiple phases was observed in a single CT acquisition, potentially obviating the need for multiphase CT scans and thus reducing radiation dose.

Keywords: contrast agents; k-edge imaging; material decomposition; multi-contrast; photon-counting CT; spectral CT.


Conflict of interest statement

This study was supported by a research agreement with Siemens Healthcare GmbH (Forchheim, Germany). Authors who are not employees of or consultants for Siemens had control of data inclusion and analysis that might present a conflict of interest for the authors who are employed by Siemens.

Figures

Figure 1
Figure 1
(a) Photon‐counting scan protocol: First, gadolinium‐based contrast (40–60 mL, 3 mL/s) was injected, followed by axial CT scans every 2 s at the level of the left renal pelvis. After 2 min, there was a 1 min pause in imaging to avoid overheating of the x‐ray tube. Next, iodine‐based contrast (20 mL, 3 mL/s) was injected, followed by axial CT scans every 2 s for 2 min. (b) Example grayscale photon‐counting images at different time points: t1 = precontrast; t2 = corticomedullary gadolinium enhancement; t3 = excretory gadolinium enhancement; t4 = corticomedullary iodine enhancement, excretory gadolinium enhancement; t5 = excretory iodine and gadolinium enhancement. Without prior information, it is not possible to differentiate the two contrast agents on these grayscale images. [Color figure can be viewed at wileyonlinelibrary.com]
Figure 2
Figure 2
(a) Shape of the x‐ray spectrum detected in the photon‐counting detector (PCD) considering the detector response function. (b–e) Axial PCD CT from the four bins [(25,50), (50,75), (75,90), and (90,140)] at the level of the left renal pelvis. Calibration vials with known concentrations of iodine, gadolinium, and bismuth (arrows) are placed within the field‐of‐view (FOV) and used in the linear material decomposition algorithm. Based on the conventional grayscale images, differentiation between the different contrast agents is impossible without prior knowledge.
Figure 3
Figure 3
(a) Grayscale photon‐counting detector (PCD) image reconstructed from all detected photons regardless of their detected energy at the level of the left pelvis demonstrates the dense contrast material in the calibration vials, abdominal aorta, and kidney. No differentiation is possible between the different contrast agents in single energy CT. (b) PCD multimaterial map differentiates the iodine (red), gadolinium (green), and bismuth (blue) contrast agents. Iodine (c), gadolinium (d), bismuth (e), and calcium (f) material map reveals which calibration vials contain which contrast agents with arterial corticomedullary iodine enhancement and venous nephrogenic/excretory enhancement within the kidney. mM = millimolar.
Figure 4
Figure 4
Grayscale images (a) and multimaterial maps (b) at three time points during the scan protocol: t1 = gadolinium excretory phase (120 s after gadolinium injection); t2 = iodine arterial phase, gadolinium excretory phase (200 s after gadolinium injection, 20 s after iodine injection); t3 = iodine and gadolinium excretory phase (300 s after gadolinium injection, 120 s after iodine injection). Differentiation between the three contrast agents is possible on the multimaterial maps. Time‐concentration curves for gadolinium (c) and iodine (d) in the aorta, renal cortex, renal medulla, and renal pelvis show clear differentiation of the contrast materials.
Figure 5
Figure 5
Grayscale images (a) and multimaterial maps (b) at the level of the bladder. There is a mixture of iodine and gadolinium in the dependent portion of the bladder after renal excretion (arrowhead). The orally ingested bismuth in the colon is clearly distinguishable from the iodine/gadolinium mixture in the bladder (arrow). The multimaterial map allows for differentiation between the contrast materials (* air in the bladder after bladder catheterization).

Similar articles

Cited by

References

    1. Schlomka JP, Roessl E, Dorscheid R, et al. Experimental feasibility of multi‐energy photon‐counting K‐edge imaging in pre‐clinical computed tomography. Phys Med Biol. 2008;53:4031. - PubMed
    1. Iwanczyk JS, Nygard E, Meirav O, et al. Photon counting energy dispersive detector arrays for x‐ray imaging. IEEE Trans Nucl Sci. 2009;56:535–542. - PMC - PubMed
    1. Taguchi K, Iwanczyk JS. Vision 20/20: single photon counting x‐ray detectors in medical imaging. Med Phys. 2013;40:100901. - PMC - PubMed
    1. Kappler S, Henning A, Kreisler B, Schoeck F, Stierstorfer K, Flohr T. Photon counting CT at elevated X‐ray tube currents: contrast stability, image noise and multi‐energy performance; 2014, p. 90331C–90331C–8.
    1. Szolar DH, Kammerhuber F, Altziebler S, et al. Multiphasic helical CT of the kidney: increased conspicuity for detection and characterization of small (< 3‐cm) renal masses. Radiology. 1997;202:211–217. - PubMed