. 2017 May 4;545(7652):93-97.
doi: 10.1038/nature22082. Epub 2017 Apr 26.

The mitochondrial Na+/Ca2+ exchanger is essential for Ca2+ homeostasis and viability

Affiliations

The mitochondrial Na+/Ca2+ exchanger is essential for Ca2+ homeostasis and viability

Timothy S Luongo et al. Nature. .

Abstract

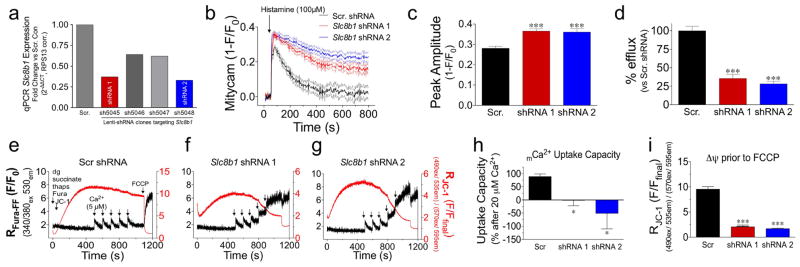
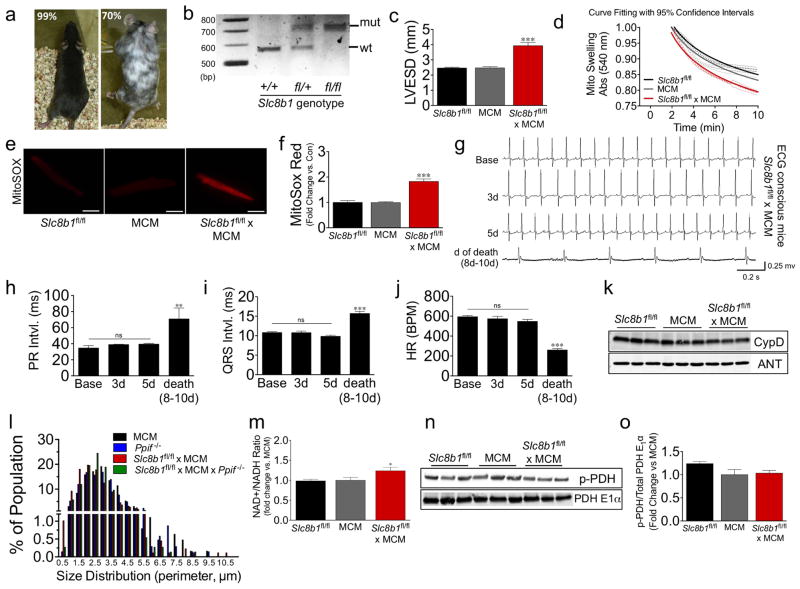
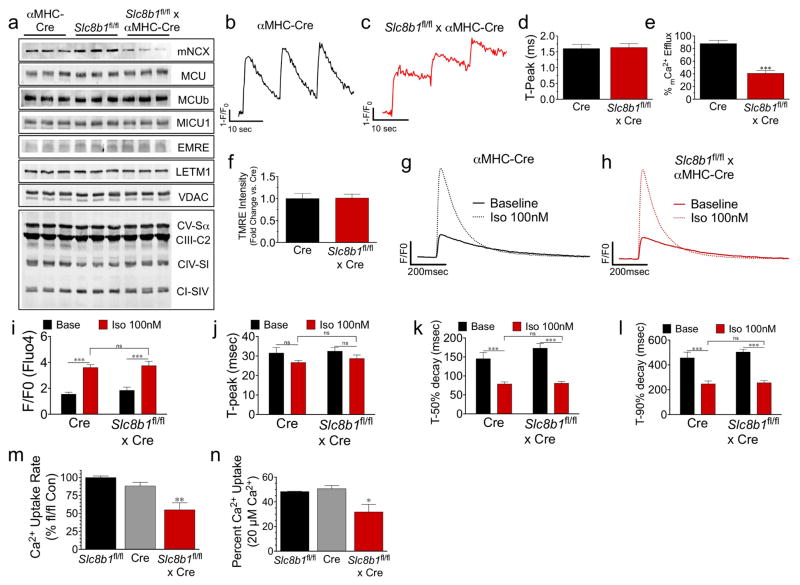
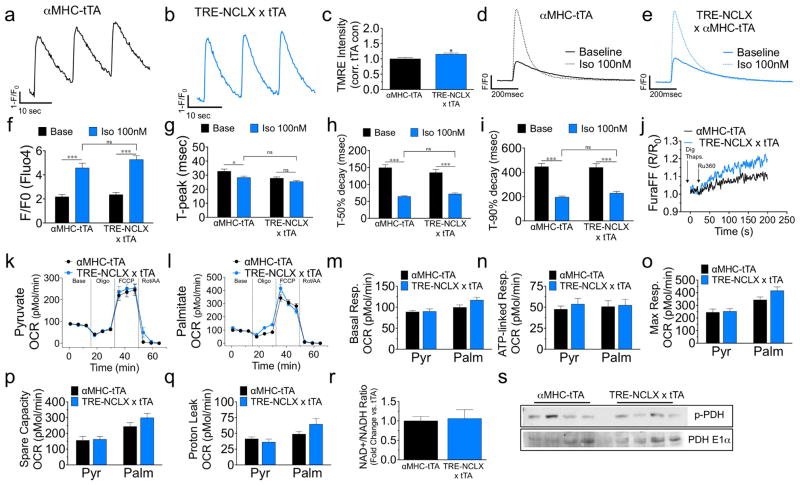
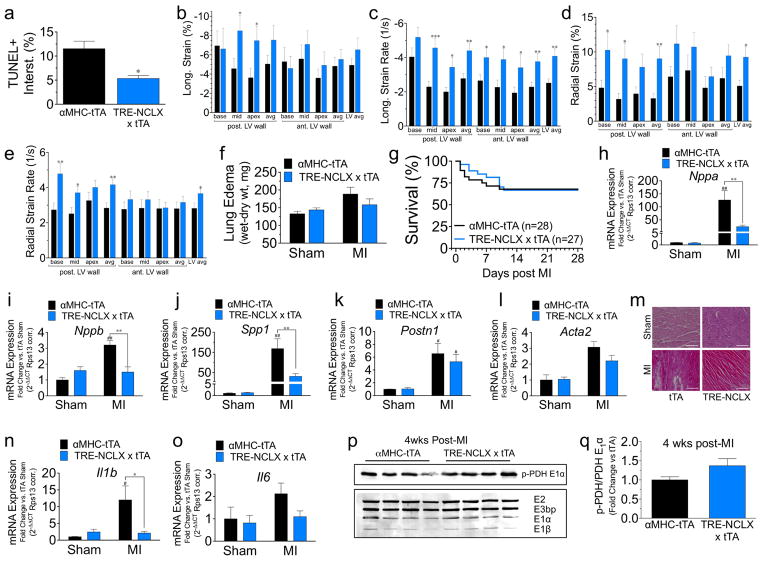
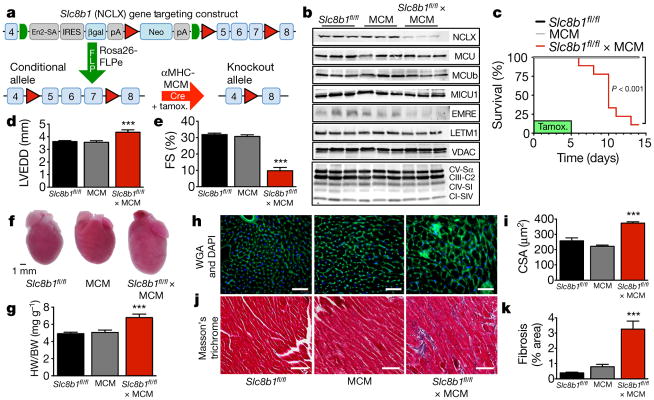
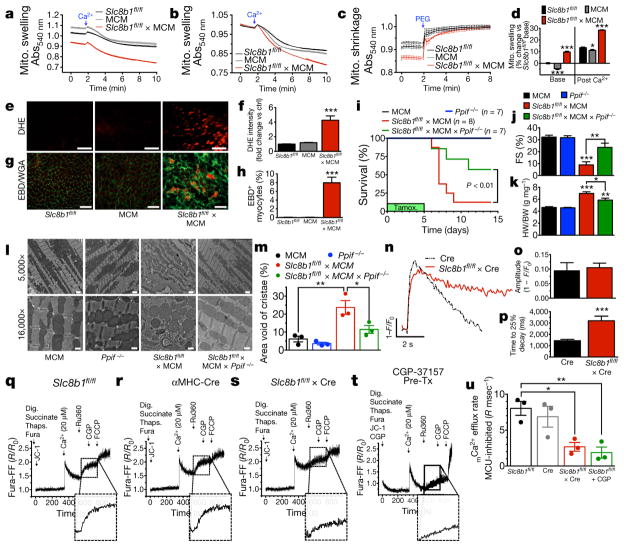
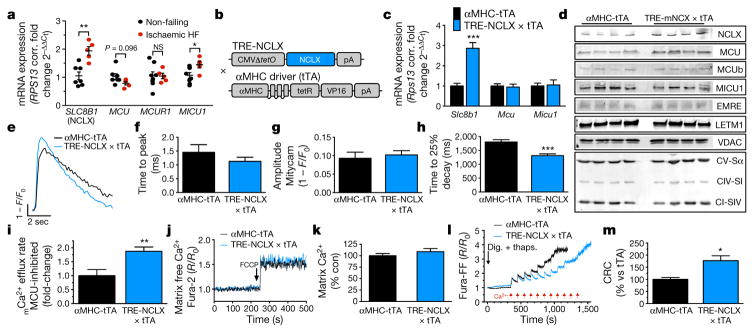
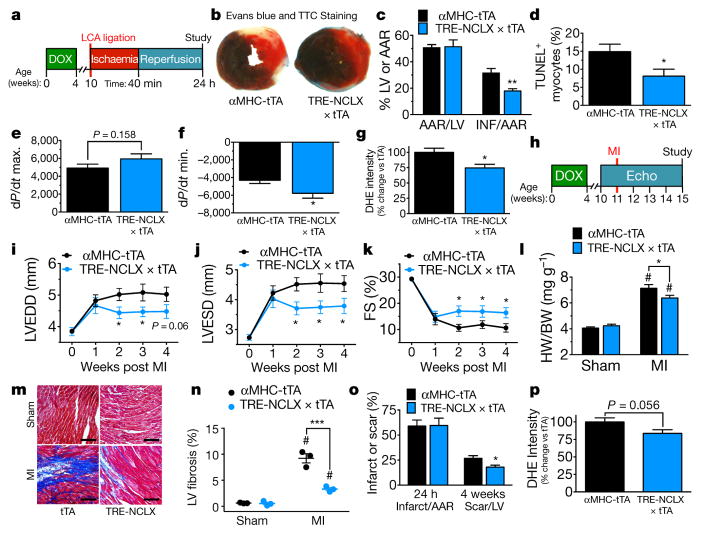
Mitochondrial calcium (mCa2+) has a central role in both metabolic regulation and cell death signalling, however its role in homeostatic function and disease is controversial. Slc8b1 encodes the mitochondrial Na+/Ca2+ exchanger (NCLX), which is proposed to be the primary mechanism for mCa2+ extrusion in excitable cells. Here we show that tamoxifen-induced deletion of Slc8b1 in adult mouse hearts causes sudden death, with less than 13% of affected mice surviving after 14 days. Lethality correlated with severe myocardial dysfunction and fulminant heart failure. Mechanistically, cardiac pathology was attributed to mCa2+ overload driving increased generation of superoxide and necrotic cell death, which was rescued by genetic inhibition of mitochondrial permeability transition pore activation. Corroborating these findings, overexpression of NCLX in the mouse heart by conditional transgenesis had the beneficial effect of augmenting mCa2+ clearance, preventing permeability transition and protecting against ischaemia-induced cardiomyocyte necrosis and heart failure. These results demonstrate the essential nature of mCa2+ efflux in cellular function and suggest that augmenting mCa2+ efflux may be a viable therapeutic strategy in disease.


Conflict of interest statement

The authors declare no competing financial interests.

Figures

Extended Data Figure 1
Extended Data Figure 1. shRNA knockdown of NCLX and biophysical characterization in non-excitable cells
a, qPCR analysis of SLC8B1 mRNA expression in shRNA stable knockdown HeLa cell lines versus scramble shRNA control cell line (scr. con). b, mCa2+ transients recorded in cells expressing the genetic mCa2+ sensor, mitycam, during histamine treatment (100 μM). Mean intensity shown as solid lines, thin dashed lines display s.e.m. c, mCa2+ peak amplitude. d, Per cent mCa2+ efflux versus scramble shRNA control. n = 42–49 cells per group. eg, HeLa cells were loaded with the Ca2+ sensor, Fura-FF, and the Δψ sensor, JC-1, permeabilized with digitonin (dg) and treated with SERCA inhibitor, thapsigargin (thaps) for simultaneous ratiometric monitoring during repetitive additions of 5 μM Ca2+ (black arrows). FCCP was used to collapse Δψ at the conclusion of each experiment. h, mCa2+ uptake capacity versus scramble shRNA control cells following 20 μM Ca2+ (fourth pulse). i, JC-1-derived Δψ before FCCP addition. n =3 experiments per assay; *P <0.05, ***P < 0.001 versus scramble shRNA control.
Extended Data Figure 2
Extended Data Figure 2. Characterization of Slc8b1 conditional knockout following tamoxifen administration
a, Images of chimeric founder mice and estimated per cent chimerism, black coat colour correlates with mutant ES cell contribution to development. b, Image of gel with PCR genotyping results for Slc8b1 loxP targeted mice. c, Left ventricular end-systolic dimension (LVESD) three days after tamoxifen administration. d, Curve fitting of mitochondrial swelling traces after addition of 500 μM Ca2+. e, Representative images of MitoSOX Red-stained ACMs (scale bar, 40 μm). f, Fold change in MitoSOX Red intensity three days after tamoxifen administration. n = 42–52 ACMs per group. g, Representative ECG recordings of Slc8b1fl/fl × MCM mice (n =4–7) at baseline, three days and five days after tamoxifen treatment, and day of sinus arrest. h, Quantitation of PR interval. i, Quantitation of QRS interval. j, Quantitation of heart rate (HR). BPM, beats per minute. k, Western blot of proposed MPTP components from heart protein lysate: CypD and ANT, VDAC shown in Fig. 1d. l, Size distribution (perimeter) of mitochondria analysed in electron microscopy images three days after tamoxifen (minimum 200 mitochondria quantified per mouse, n =3–4 mice per group). m, Quantification of NAD+/NADH ratio three days after tamoxifen administration (fold change versus control). n =6–7 per group. n, Western blots of total pyruvate dehydrogenase (PDH E1α) and phosphorylated-PDH (p-PDH) from heart protein lysate. o, Fold change in the ratio of p-PDH/total PDH E1α versus control. n = 3 per group; *P <0.05, **P <0.01, ***P < 0.001; ns, not significant.
Extended Data Figure 3
Extended Data Figure 3. Examination of Ca2+ flux following αMHC-Cre-mediated deletion of Slc8b1.
a, Adult heart protein lysate isolated from: Slc8b1fl/fl ×αMHC-Cre mice and controls were examined by western blot for NCLX expression and various other proteins involved in mCa2+ exchange: MCU, MCUb, MICU1, EMRE, LETM1, VDAC; and OXPHOS components: ATP synthase subunit α (CV-Sα), complex III subunit core 2 (CIII-C2), complex IV subunit I (CIV-SI), and complex I subunit NDUFB8 (CI-SIV). n = 3 hearts per group. b, c, Series of mitycam mCa2+ transients recorded during pacing (0.1 Hz). d, mCa2+ time to peak amplitude. e, Per cent mCa2+ efflux 10 s after pacing. f, Tetramethylrhodamine, ethyl ester (TMRE) (Δψ) in intact ACM. n = 23–24 ACMs per group. g, h, Representative recordings of iCa2+ transients (Fluo-4) in ACMs paced at 1 Hz with or without isoproterenol (Iso, 100 nM). i, iCa2+ peak amplitude. j, iCa2+ time to peak amplitude. k, iCa2+ time to 50% decay. l, Time to 90% decay. n = 10 cells per group. m, n, Permeabilized ACM mCa2+ uptake rate (m) and per cent uptake (n) after Ca2+ addition. *P <0.05, **P <0.01, ***P <0.001.
Extended Data Figure 4
Extended Data Figure 4. Characterization of NCLX transgenic mice
a, b, Series of mitycam mCa2+ transients recorded during pacing (0.1 Hz). c, Tetramethylrhodamine, ethyl ester (TMRE) (Δψ) in intact ACMs. n = 23–36 ACMs per group. d, e, Representative traces of iCa2+ transients (Fluo-4) in ACMs paced at 1 Hz with or without isoproterenol (100 nM). f, iCa2+ peak amplitude. g, iCa2+ time to peak amplitude. h, Time to 50% decay. i, Time to 90% decay (n = 15 cells per group). j, Recording of transients in Digitonin (dig)-permeabilized ACMs loaded with Fura-FF, treated with thapsigargin (thaps) and placed in 20 μM bath Ca2+ before treatment with the MCU inhibitor, Ru360, to quantify the rate of mCa2+ efflux independent of uptake. kq, Seahorse analysis of mitochondrial oxygen consumption rates (OCR) in ACMs in the presence of pyruvate or palmitate. m, Basal OCR. n, ATP-linked respiration after addition of ATP synthase inhibitor, oligomycin. o, Maximal respiration after addition of protonophore, FCCP. p, Spare respiratory capacity (max – basal). q, Proton leak (post-oligomycin OCR – non-mitochondrial OCR). n = 11–15 per condition. r, Quantification of NAD+/NADH ratio three days after tamoxifen (fold change versus control). n =4–5 per group. s, Western blot of total pyruvate dehydrogenase (PDH E1α) and phosphorylated-PDH (p-PDH) from heart protein lysate. *P <0.05, ***P <0.001.
Extended Data Figure 5
Extended Data Figure 5. Analysis of NCLX-Tg mice 24 h after ichaemia reperfusion and 4 weeks after myocardial infarction
a, Quantification of TUNEL+ interstitial cells after ischaemia reperfusion. be, B-mode speckle tracking analysis of left ventricular function 4 weeks after myocardial infarction: longitudinal strain (b), longitudinal strain rate (c), radial strain (d), radial strain rate (e). n = 20 tTA and n =18 NCLX-Tg. f, Lung oedema (wet–dry lung weight). n = 7 per sham group, n =17 per myocardial infarction group. g, Kaplan–Meier survival curves post myocardial infarction. n = 28 tTA and n =27 NCLX-Tg. hl, qPCR quantification of mRNA expression in hearts from sham-treated mice or 4 weeks after myocardial infarction. Nppa, atrial natriuretic peptide; Nppb, brain natriuretic peptide; Spp1, osteopontin; Postn1, periostin; Acta2, smooth muscle α-actin (sham, n = 3 group; myocardial infarction, n = 7 per group). m, Representative images of H&E-stained heart sections from the infarct border zone 4 weeks post myocardial infarction. Scale bar, 400 μm. n, o, qPCR analysis of mRNA expression for inflammatory cytokines 4 weeks post myocardial infarction. Il1b, interleukin-1β; Il6, interleukin-6. n = 3 per sham group, n = 7 per myocardial infarction group. p, Western blot of pyruvate dehydrogenase subunits and phosphorylated-PDH (p-PDH) from heart protein lysate 4 weeks post myocardial infarction. q, Fold-change in the ratio of p-PDH/total PDH E1α versus tTA control. n = 4 per group; *P <0.05, **P <0.01, ***P <0.001, versus αMHC tTA post injury; #P <0.05, ##P <0.01 versus sham control.
Figure 1
Figure 1. Deletion of Slc8b1 from adult cardiomyocytes causes left ventricular remodelling and heart failure followed by sudden death
a, Schematic of gene targeting strategy. LoxP sites (red triangles) and FRT sites (green semicircles) flank a splice acceptor site (En2-SA), β-galactosidase (βgal) reporter, and neomycin resistance (Neo) cassette. Mutant founders were crossed with Rosa26-FLPe mice for removal of FRT-flanked region. Slc8b1fl/fl were crossed with cardiomyocyte-restricted (αMHC promoter), tamoxifen-inducible MCM transgenic mice. All mice were treated with tamoxifen (tamox.) for 5 days. All phenotyping was conducted 3 days post tamoxifen treatment. b, Western blots for NCLX expression and other proteins associated with mCa2+ exchange. MCU, mitochondrial calcium uniporter; MCUb, mitochondrial calcium uniporter β subunit; MICU1, mitochondrial calcium uptake 1; EMRE, essential MCU regulator; LETM1, leucine zipper and EF-hand-containing transmembrane protein 1. Voltage dependent anion channel (VDAC) and oxidative phosphorylation components were used as mitochondrial loading controls. CV-Sα, complex V α subunit; CIII-C2, complex III-core protein 2; CIV-SI, complex IV subunit I; CI-SIV, complex I subunit NDUFB8. n = 3 mice per group. c, Kaplan–Meier survival curves after tamoxifen treatment. n =14 Slc8b1fl/fl, n =9 MCM, n =9 Slc8b1fl/fl ×MCM. d, e, Echocardiography of left ventricular structure and function 3 days post tamoxifen treatment. n =13 Slc8b1fl/fl, n =9 MCM, n =6 Slc8b1fl/fl ×MCM. d, Left ventricular end-diastolic dimension (LVEDD). e, Per cent fractional shortening (FS). f, Gross heart images 3 days post tamoxifen. g, Heart weight to body weight ratio (HW/BW, n =5–7 mice per group). h, Images of left ventricular tissue stained with wheat germ agglutinin (WGA, green) to delineate sarcolemma and DAPI (blue). Scale bars, 50 μm. i, Cardiomyocyte cross-sectional area (CSA). Scale bar, 400 μm; n = 3–4 mice per group). j, Masson’s trichrome staining of left ventricular tissue to evaluate collagen deposition (blue). Scale bars, 400 μm. k, Quantification of fibrotic area as a percentage of left ventricle. n =16 Slc8b1fl/fl, n =13 MCM, n =10 Slc8b1fl/fl ×MCM; ***P <0.001.
Figure 2
Figure 2. Deletion of Slc8b1 in adult mice ablates mCa2+ efflux resulting in mitochondrial-dependent necrotic cell death
a, Mitochondrial swelling induced by 500 μM Ca2+ (n = 4 per group). b, Mitochondrial swelling normalized before Ca2+ addition (n =4 per group). c, Mitochondrial shrinkage induced by PEG (n = 4 per group). d, Per cent change in swelling versus control. e, Images of dihydroethidium (DHE) staining in live left ventricular tissue. Scale bars, 40 μm; n =10 Slc8b1fl/fl, n =8 MCM, n =19 Slc8b1fl/fl ×MCM. f, Fold-change in DHE signal versus control. g, Evans blue dye (EBD) and wheat germ agglutinin (WGA) staining in left ventricular tissue 3 days post tamoxifen. Scale bars, 50 μm. h, Per cent EBD+ cardiomyocytes. n = 15 mice per group. i, Kaplan–Meier survival curves of mice during tamoxifen treatment. n =7 Ppif−/−, 10 MCM, 8 Slc8b1fl/fl ×MCM, 8 Slc8b1fl/fl ×MCM ×Ppif−/−. j, Per cent fractional shortening (FS) 3 days post tamoxifen administration. n = 5–6 mice per group. k, Heart weight to body weight ratio 3 days post tamoxifen treatment. n = 5 mice per group. l, Electron microscopy images of left ventricular tissue 3 days after tamoxifen treatment, imaged at 5,000× magnification (scale bars, 1 μm) and 16,000× magnification (scale bars, 500 nm). m, Mitochondrial cristae density, represented as per cent area void of cristae. n = 3–4 mice per group. n, Mitycam mCa2+ transients of ACMs paced at 0.1 Hz. F/F0 indicates the maximum fluorescence of the cell over the average fluorescence before stimulation. o, mCa2+ peak amplitude. p, mCa2+ time to 25% decay. n =7 Cre, n =14 Slc8b1fl/fl ×Cre ACMs. qs, mCa2+ uptake and efflux in isolated, permeabilized ACMs. dig., digitonin; thaps., thapsigargin; Ru360, MCU inhibitor; CGP, NCLX inhibitor. Inset, magnified smoothed efflux tracing. R indicates the ratio of the ratiometric reporter Fura-FF (340/380 nm excitation and 510 nm emission). R/R0 indicates the ratio at each time point over the ratio at time 0. t, Wild-type ACMs pre-treated with NCLX inhibitor. u, mCa2+ efflux rate. n = 3 replicates per group; *P <0.05, **P <0.01, ***P <0.001.
Figure 3
Figure 3. Cardiomyocyte overexpression of NCLX increases mCa2+ efflux capacity
a, mRNA expression of mCa2+ exchange genes in left ventricular tissue of patients with ischaemic heart failure (HF). Fold change versus non-failing controls. n = 7 non-failing and n = 5 ischaemic heart failure). b, Schematic of transgenic construct for conditional, cardiac-restricted NCLX-overexpressing mouse. c, Cardiac mRNA expression of mCa2+ exchange genes, fold-change versus tTA control. n = 4 mice per group. d, Western blots of cardiac NCLX expression and other mCa2+ exchange proteins. n = 4–8 mice per group. e, Mitycam mCa2+ transients in ACM paced at 0.1 Hz. f, mCa2+ time to peak intensity. g, mCa2+ peak amplitude. h, mCa2+ time to 25% decay. n = 6–11 ACMs per group. i, mCa2+ efflux independent of uptake, fold change versus tTA control. j, Recording of mCa2+ content before and after FCCP to release matrix free Ca2+. k, Per cent change in matrix Ca2+ content. l, mCa2+ retention capacity (CRC) in isolated ACMs. m, Quantification of CRC as per cent change versus tTA control. n = 3 replicates per group; *P <0.05, **P <0.01, ***P < 0.001; NS, not significant.
Figure 4
Figure 4. Overexpression of NCLX protects against myocardial ischaemic reperfusion injury and ischaemic heart failure
a, Timeline of myocardial ischaemia reperfusion experimental protocol. DOX, doxycycline administration. b, Mid-ventricular cross-sections of hearts 24 h after reperfusion and EBD perfusion and TTC staining (non-blue area indicates the area at risk (AAR); red area, viable myocardium; white area, infarct). c, Per cent AAR of the left ventricle and per cent infarct of the AAR. n = 11 mice per group. d, TUNEL+ cardiomyocytes post ischaemia reperfusion. n = 5 mice per group. e, f, Invasive haemodynamics post ischaemia reperfusion. e, dP/dt maximum (contractility). f, dP/dt minimum (relaxation). n =13–16 mice per group. g, DHE staining in live myocardium 24 h post ischaemia reperfusion. n = 6 tTA and n =5 NCLX-Tg. h, Timeline of myocardial infarction (MI) experimental protocol. Echo, left ventricular echocardiography. i, Left-ventricular end-diastolic dimension (LVEDD). j, Left-ventricular end-systolic dimension (LVESD). k, Per cent fractional shortening (FS). n =19 tTA, n =16 NCLX-Tg. l, Heart weight to body weight ratio. n = 6, sham tTA, n = 7 sham NCLX-Tg, n =17 tTA, n =17 NCLX-Tg. m, Images of Masson’s trichrome-stained left ventricular sections at the border zone 4 weeks post myocardial infarction. Scale bars, 400 μm. n, Per cent fibrosis in peri-infarct and remote regions of the left ventricle 4 weeks post infarction. n = 3 mice per group. o, Per cent infarct of AAR 24 h after LCA ligation and scar of left ventricle 4 weeks post infarction. n = 5 mice per group. p, DHE staining in live myocardium 4 weeks post infarction. n = 8–9 mice per group. *P <0.05, **P <0.01, ***P <0.001; #P < 0.05 versus sham control (l, n).

References

    1. Murphy E, et al. Unresolved questions from the analysis of mice lacking MCU expression. Biochem Biophys Res Commun. 2014;449:384–385. - PMC - PubMed
    1. Palty R, et al. NCLX is an essential component of mitochondrial Na+/Ca2+ exchange. Proc Natl Acad Sci USA. 2010;107:436–441. - PMC - PubMed
    1. Sekler I. Standing of giants shoulders the story of the mitochondrial Na+Ca2+ exchanger. Biochem Biophys Res Commun. 2015;460:50–52. - PubMed
    1. Antony AN, et al. MICU1 regulation of mitochondrial Ca2+ uptake dictates survival and tissue regeneration. Nat Commun. 2016;7:10955. - PMC - PubMed
    1. Mallilankaraman K, et al. MICU1 is an essential gatekeeper for MCU-mediated mitochondrial Ca2+ uptake that regulates cell survival. Cell. 2012;151:630–644. - PMC - PubMed

Publication types

MeSH terms