. 2017 Apr 26;545(7655):446-451.
doi: 10.1038/nature22364.

Phylogenetic ctDNA analysis depicts early-stage lung cancer evolution

Christopher Abbosh  1 Nicolai J Birkbak  1   2 Gareth A Wilson  1   2 Mariam Jamal-Hanjani  1 Tudor Constantin  3 Raheleh Salari  3 John Le Quesne  4 David A Moore  4 Selvaraju Veeriah  1 Rachel Rosenthal  1 Teresa Marafioti  1   5 Eser Kirkizlar  3 Thomas B K Watkins  1   2 Nicholas McGranahan  1   2 Sophia Ward  1   2   6 Luke Martinson  4 Joan Riley  4 Francesco Fraioli  7 Maise Al Bakir  2 Eva Grönroos  2 Francisco Zambrana  1 Raymondo Endozo  7 Wenya Linda Bi  8   9 Fiona M Fennessy  8   9 Nicole Sponer  3 Diana Johnson  1 Joanne Laycock  1 Seema Shafi  1 Justyna Czyzewska-Khan  1 Andrew Rowan  2 Tim Chambers  2   6 Nik Matthews  6   10 Samra Turajlic  2   11 Crispin Hiley  1   2 Siow Ming Lee  1   12 Martin D Forster  1   12 Tanya Ahmad  12 Mary Falzon  5 Elaine Borg  5 David Lawrence  13 Martin Hayward  13 Shyam Kolvekar  13 Nikolaos Panagiotopoulos  13 Sam M Janes  1   14   15 Ricky Thakrar  14 Asia Ahmed  16 Fiona Blackhall  17   18 Yvonne Summers  18 Dina Hafez  3 Ashwini Naik  3 Apratim Ganguly  3 Stephanie Kareht  3 Rajesh Shah  19 Leena Joseph  20 Anne Marie Quinn  20 Phil A Crosbie  21 Babu Naidu  22   23 Gary Middleton  24 Gerald Langman  25 Simon Trotter  25 Marianne Nicolson  26 Hardy Remmen  27 Keith Kerr  28 Mahendran Chetty  29 Lesley Gomersall  30 Dean A Fennell  4 Apostolos Nakas  31 Sridhar Rathinam  31 Girija Anand  32 Sajid Khan  33   34 Peter Russell  35 Veni Ezhil  36 Babikir Ismail  37 Melanie Irvin-Sellers  38 Vineet Prakash  39 Jason F Lester  40 Malgorzata Kornaszewska  41 Richard Attanoos  42 Haydn Adams  43 Helen Davies  44 Dahmane Oukrif  1 Ayse U Akarca  1 John A Hartley  45 Helen L Lowe  45 Sara Lock  46 Natasha Iles  47 Harriet Bell  47 Yenting Ngai  47 Greg Elgar  2   6 Zoltan Szallasi  48   49   50 Roland F Schwarz  51 Javier Herrero  52 Aengus Stewart  53 Sergio A Quezada  54 Karl S Peggs  54   55 Peter Van Loo  56   57 Caroline Dive  1   58 C Jimmy Lin  3 Matthew Rabinowitz  3 Hugo J W L Aerts  8   9   59 Allan Hackshaw  47 Jacqui A Shaw  4 Bernhard G Zimmermann  3 TRACERx consortiumPEACE consortiumCharles Swanton  1   2
Collaborators, Affiliations

Phylogenetic ctDNA analysis depicts early-stage lung cancer evolution

Christopher Abbosh et al. Nature. .

Erratum in

  • Corrigendum: Phylogenetic ctDNA analysis depicts early-stage lung cancer evolution.
    Abbosh C, Birkbak NJ, Wilson GA, Jamal-Hanjani M, Constantin T, Salari R, Le Quesne J, Moore DA, Veeriah S, Rosenthal R, Marafioti T, Kirkizlar E, Watkins TBK, McGranahan N, Ward S, Martinson L, Riley J, Fraioli F, Al Bakir M, Grönroos E, Zambrana F, Endozo R, Bi WL, Fennessy FM, Sponer N, Johnson D, Laycock J, Shafi S, Czyzewska-Khan J, Rowan A, Chambers T, Matthews N, Turajlic S, Hiley C, Lee SM, Forster MD, Ahmad T, Falzon M, Borg E, Lawrence D, Hayward M, Kolvekar S, Panagiotopoulos N, Janes SM, Thakrar R, Ahmed A, Blackhall F, Summers Y, Hafez D, Naik A, Ganguly A, Kareht S, Shah R, Joseph L, Quinn AM, Crosbie PA, Naidu B, Middleton G, Langman G, Trotter S, Nicolson M, Remmen H, Kerr K, Chetty M, Gomersall L, Fennell DA, Nakas A, Rathinam S, Anand G, Khan S, Russell P, Ezhil V, Ismail B, Irvin-Sellers M, Prakash V, Lester JF, Kornaszewska M, Attanoos R, Adams H, Davies H, Oukrif D, Akarca AU, Hartley JA, Lowe HL, Lock S, Iles N, Bell H, Ngai Y, Elgar G, Szallasi Z, Schwarz RF, Herrero J, Stewart A, Quezada SA, Peggs KS, Van Loo P, Dive C, Lin CJ, Rabinowitz M, Aerts HJWL, Hackshaw A, Shaw JA, Zimmermann BG, Swanton C. Abbosh C, et al. Nature. 2018 Feb 8;554(7691):264. doi: 10.1038/nature25161. Epub 2017 Dec 20. Nature. 2018. PMID: 29258292

Abstract

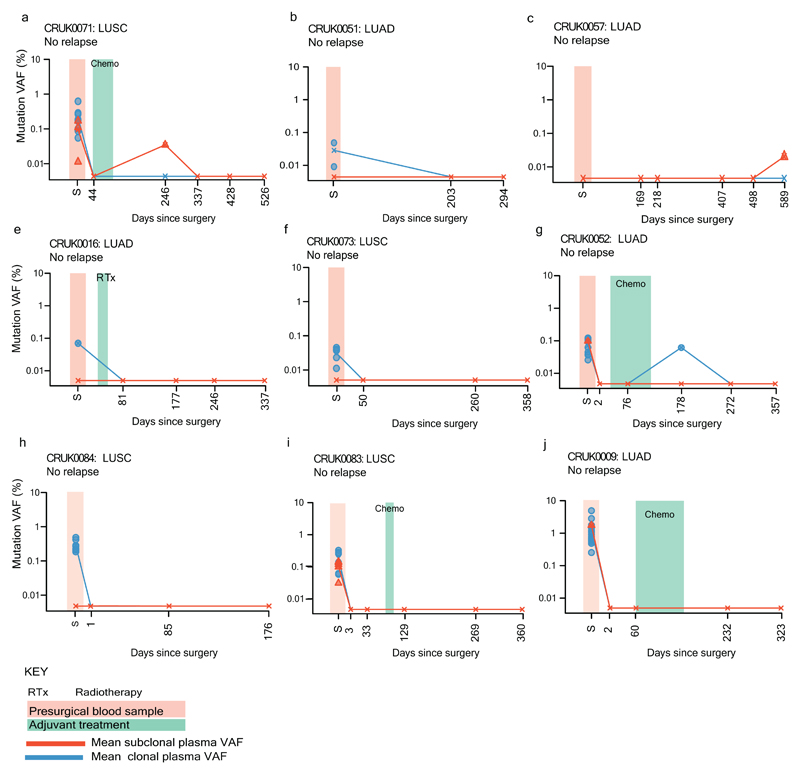
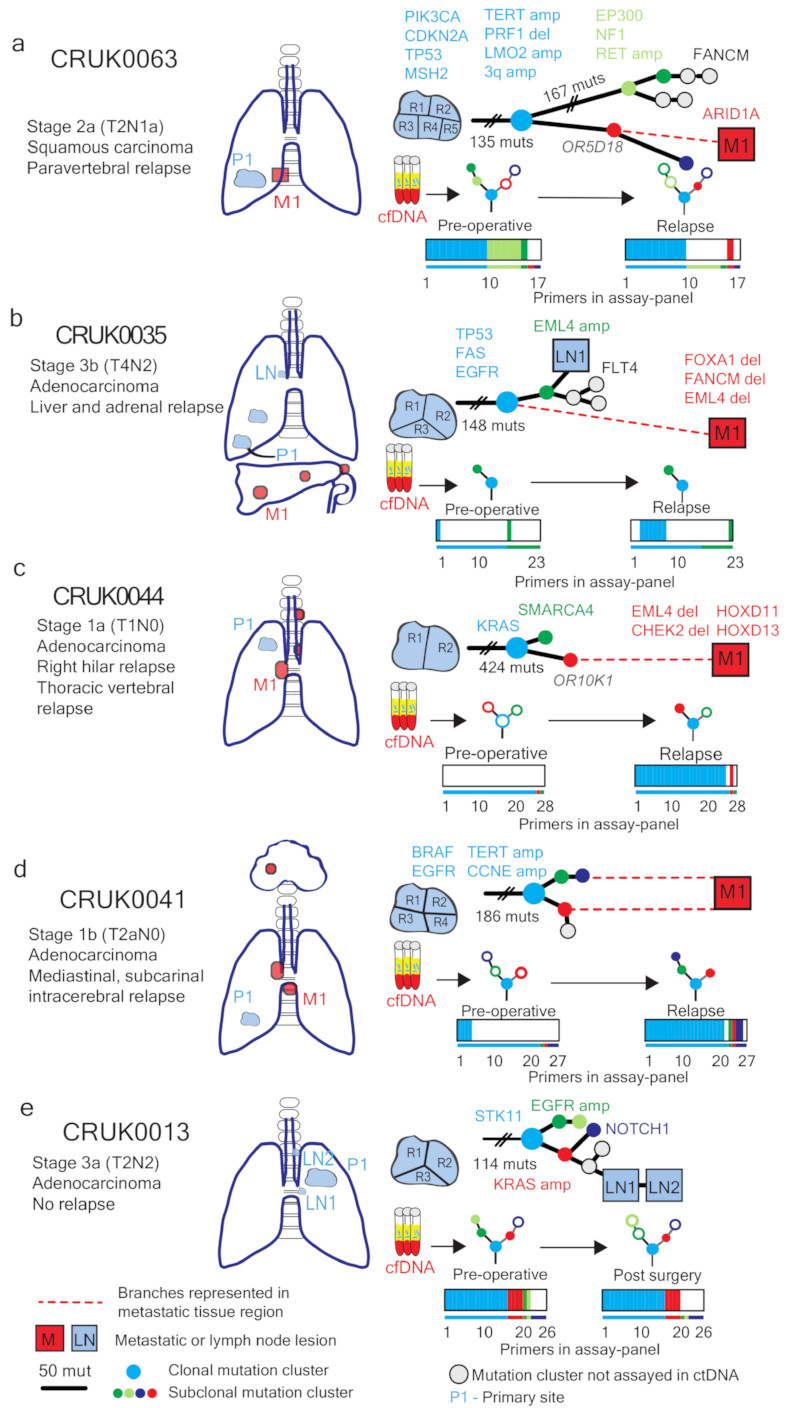
The early detection of relapse following primary surgery for non-small-cell lung cancer and the characterization of emerging subclones, which seed metastatic sites, might offer new therapeutic approaches for limiting tumour recurrence. The ability to track the evolutionary dynamics of early-stage lung cancer non-invasively in circulating tumour DNA (ctDNA) has not yet been demonstrated. Here we use a tumour-specific phylogenetic approach to profile the ctDNA of the first 100 TRACERx (Tracking Non-Small-Cell Lung Cancer Evolution Through Therapy (Rx)) study participants, including one patient who was also recruited to the PEACE (Posthumous Evaluation of Advanced Cancer Environment) post-mortem study. We identify independent predictors of ctDNA release and analyse the tumour-volume detection limit. Through blinded profiling of postoperative plasma, we observe evidence of adjuvant chemotherapy resistance and identify patients who are very likely to experience recurrence of their lung cancer. Finally, we show that phylogenetic ctDNA profiling tracks the subclonal nature of lung cancer relapse and metastasis, providing a new approach for ctDNA-driven therapeutic studies.

Trial registration: ClinicalTrials.gov NCT03004755.


Conflict of interest statement

Author information

The authors declare competing financial interests: details are available in the online version of the paper.

Figures

Extended Data Figure 1
Extended Data Figure 1. Multiplex-PCR next-generation sequencing platform analytical validation
a) Analytical validation of the multiplex-PCR NGS platform was performed by spiking synthetic single nucleotide variants into control cell-free DNA. Sensitivity and specificity of the platform at different spike concentrations was ascertained, 95% binomial confidence interval displayed as error bars. b) Specificity of ctDNA detection based on a 1 SNV and 2 SNV call threshold taking into account parallel testing of multiple SNVs. c) The median depth of read across a position did not vary depending on whether an SNV position was called or not called using the platform error-model. Wilcoxon Test, P=0.786, median depth of read at uncalled positions = 45,777 (n=3,745), range: 0 to 146774, median depth of read at called positions = 45,478, range= 1,354 to 152,974 (n=1,124). Whiskers represent 1.5 times the interquartile range, 2-sided test.
Extended Data Figure 2
Extended Data Figure 2. Study construction and assay-panel design
a) The pre-operative study phase cohort consisted of 100 TRACERx patients present in the first 100 patient TRACERx cohort in April 2016. Pre-operative plasma samples were profiled in 96 patients for reasons listed. bi and ii) Contents of patient-specific assay-panels designed in the pre-operative study phase. c) The longitudinal study phase cohort consisted of patients with confirmed NSCLC relapse and patients without relapse. d) Contents of patient-specific assay-panels designed in the longitudinal phases of this study. e) Single nucleotide variant type targeted.
Extended Data Figure 3
Extended Data Figure 3. Clinicopathological predictors of ctDNA detection
a) 96 patients in pre-operative cohort stratified by pathological TNM stage. b) LUSCs and ctDNA positive LUADs are significantly more necrotic that ctDNA negative LUADs. Significant differences in necrosis between groups: LUSCs (median necrosis 40%) (n=31), ctDNA positive LUADs (median necrosis 15%) (n=11) and ctDNA negative LUADs (median necrosis 2%) (n=47), Kruskal-Wallis test, P<0.001, 2-sided pairwise comparisons were performed using Dunn’s procedure with Bonferroni correction. c) Univariate (left) and multivariate analyses (right) were performed, by logistic regression to determine significant predictors of ctDNA detection in early-stage NSCLC. ctDNA detection was defined as detection of two or more SNVs in pre-operative plasma samples. Details regarding multivariable analysis methodology are in methods. d) Receiver operating characteristic curve (ROC) analysis of pre-operative PET scan FDG-avidity (normalized as tumor background ratio (TBR), see methods), as a predictor of ctDNA detection (92/96 PET scans were available for central review). Median PET TBR of detected tumors = 9.01, n=45. Median PET TBR of undetected tumors= 3.64, n=47. P-value based on Wilcoxon Rank Sum Test. e) LUAD subtype analyses based on ctDNA detection and the presence of an EGFR, KRAS or TP53 driver mutation.
Extended Data Figure 4
Extended Data Figure 4. Predictors of plasma variant allele frequency
a) Plasma variant allele frequencies of SNVs detected in plasma in 46 patients who were ctDNA positive (two or more SNVs detected). Clonal (blue) and subclonal (red) variant allele frequencies indicated, mean shown as horizontal line. Driver variants shown as triangles. b) Mean clonal VAF correlated with maximum tumor size measured in post-surgical specimen (pathological size, n=46) grey vertical bars represent range of clonal variant allele frequency. Shaded red background indicates 95% confidence interval. c) Filtering steps taken to define a group of ctDNA positive patients with volumetric data considered adequate to model tumor volume and plasma variant allele frequency. d) Scatter plot showing mean clonal VAF relative to tumor volume for TRACERx (blue dots and fitted blue line, n=37) and VAF relative to volume for previously published data based on CAPP-seq analysis of ctDNA (orange dots and orange fitted line, n=9). Orange shaded background indicates 95% confidence interval based on CAPP-seq data. e) Mean clonal VAF correlated with tumor volume × tumor purity (cancer cell volume), n=37. Shaded red background indicates 95% confidence interval. f) Association between number of cancer cells and VAF of clonal SNVs in plasma based on linear modelling of Extended Data Fig 4f. g) Detected subclonal SNVs were mapped back to M-Seq derived tumor phylogenetic trees (process illustrated in graphic). Detected private subclones (subclones identified within only a single tumor region) are coloured red. Shared subclones (subclones detected in more than one tumor regions) are light blue. Subclonal nodes were sized based on the maximum recorded cancer cell fraction (CCF). The top row of phylogenetic trees represent subclonal nodes targeted by primers within that patient’s assay panel, the bottom row represent subclonal nodes detected in ctDNA, within this row grey subclonal nodes represent subclones not detected in ctDNA.
Extended Data Figure 5
Extended Data Figure 5. Longitudinal ctDNA profiling, remaining relapse cases.
a) Kaplan-Meier curve demonstrate relapse free survival for patients in whom ctDNA was detected versus patients in whom ctDNA was not detected. b-h) Longitudinal cell-free DNA profiling. Circulating tumor DNA (ctDNA) detection in plasma was defined as the detection of two tumor-specific SNVs. Relapse was based on imaging-confirmed NSCLC relapse, imaging performed as clinically indicated. Detected clonal (circles, light blue) and subclonal (triangles, colors indicates different subclones) SNVs from each patient-specific assay-panel are plotted on graphs colored by M-Seq derived tumor phylogenetic nodes. Mean clonal (blue) and mean subclonal (red) VAF are indicated on graphs. Pre-operative and relapse M-Seq derived phylogenetic trees represented by ctDNA are illustrated above each graph in cases where subclonal SNVs were detected.
Extended Data Figure 6
Extended Data Figure 6. Longitudinal ctDNA profiling, non-relapse cases
a-j) Detected clonal (circles, light blue) and subclonal (red triangles) SNVs from each patient-specific assay-panel are plotted on graphs. Mean clonal (blue) and mean subclonal (red) VAF are indicated on graphs.
Extended Data Figure 7
Extended Data Figure 7. Heatmaps illustrating detection of SNVs in bespoke panel at each sampled time point
a, c-f) Bespoke assay panels for CRUK0063, CRUK0035, CRUK0044, CRUK0041 and CRUK0013. Colors indicate originating subclonal cluster based on the phylogenetic trees above the heatmap. Light blue indicates clonal mutation cluster. Full panel with cluster color shown below each heatmap. Filled squares indicates detection of a given variant in plasma ctDNA. Y-axis shows day of sampling, y-axis labels appended with [R] indicates day of clinical relapse. b) Re-examination of primary tumor regions from CRUK0063 with lowered threshold to potentially identify SNVs private to the sequenced relapse biopsy. 16/88 variants were found at very low VAF in region 3, indicating this region from the primary likely gave rise to the metastasis.
Extended Data Figure 8
Extended Data Figure 8. Heatmap illustrating detection of SNVs in bespoke panel based on M-seq of metastatic tumor regions for patient CRUK0063 for all sampled time points.
Colors indicate originating subclonal cluster based on the phylogenetic trees above the heatmap. Light blue indicates clonal mutation cluster. Full panel with cluster color shown below each heatmap. Filled squares indicates detection of a given variant in plasma ctDNA. Y-axis shows day of sampling.
Figure 1
Figure 1. Phylogenetic ctDNA tracking
Overview of the study methodology. Multi-region sequencing of NSCLC was performed as part of the TRACERx study. PCR assay-panels were designed based on phylogenetic analysis, targeting clonal and subclonal single nucleotide variants to facilitate non-invasive tracking of the patient-specific tumor phylogeny. Assay-panels were combined into multiplex assay-pools containing primers from up to 10 patients. Cell-free DNA was extracted from pre- and post-operative plasma samples and multiplex-PCR performed, followed by sequencing of amplicons. Findings were integrated with M-Seq exome data to track tumor evolution.
Figure 2
Figure 2. Clinicopathological predictors of ctDNA detection
a) Heatmap showing clinicopathological and ctDNA detection data, continuous variables quartiled. Raw data and patient IDs in attached worksheet. b) Detection of clonal and subclonal single nucleotide variants within 46 patients with two or more single nucleotide variants detected in plasma. Histology indicated in panels as LUSC, LUAD and Other.
Figure 3
Figure 3. Tumor volume predicts plasma variant allele frequency
a) Tumor volume (cm3) measured by CT volumetric analysis correlates with mean clonal plasma VAF, n=37, grey vertical lines represent range of clonal VAF, red shading indicates 95% confidence intervals. b) Predicted mean clonal VAF at hypothetical volumes ranging from 1 to 100cm3 based on model in panel a, predicted cancer cell number based on model in extended data 4e. c) Estimated effective subclone size, defined as mean CCF of subclone multiplied by tumor volume and purity, influences subclonal SNV detection. For negative calls, median effective subclone size was 1.70 cm3, range= 0.21-24.11, n=163, for positive calls, median effective subclone size = 4.06 cm3, range = 0.31 – 49.20, n=109. Wilcoxon rank sum test, P<0.001, data from 34 patients (passed volumetric filters with subclonal SNVs represented in assay-panel). d) Estimated effective subclone size correlates with subclonal plasma VAF, n=109 subclonal SNVs, data from 34 patients (passed volumetric filters with detected subclonal SNVs in plasma).
Figure 4
Figure 4. Post-operative ctDNA detection predicts and characterizes NSCLC relapse
a-h) Longitudinal cell-free DNA profiling. Circulating tumor DNA (ctDNA) detection in plasma was defined as the detection of two tumor-specific SNVs. Detected clonal (circles, light blue) and subclonal (triangles, colors indicates different subclones) SNVs from each patient-specific assay-panel are plotted on graphs colored by M-Seq derived tumor phylogenetic nodes. Mean clonal (blue) and mean subclonal (red) plasma VAF are indicated on graphs as connected lines. Pre-operative and relapse M-Seq derived phylogenetic trees represented by ctDNA are illustrated above each graph.
Figure 5
Figure 5. Phylogenetic trees incorporating relapse tissue sequencing data
Phylogenetic trees based on mutations found in primary and metastatic tissue (a-d), or primary tumor and lymph node biopsies (e). Colored nodes in phylogenetic trees indicate cancer clones harboring mutations assayed for in ctDNA, grey indicates a clone not assayed. Branch length is proportional to number of mutations unless crossed. Dashed red lines show branches leading to metastatic relapse. Colored bars below show the number of assays per sample detected preoperatively and at relapse (a-d) or in the absence of relapse, post-surgery (e). Thin colored bar shows number of assays in total. Colors match clones on the phylogenetic trees.
Figure 6
Figure 6. ctDNA tracking of lethal cancer subclones in CRUK0063
Phylogenetic analysis of one relapse biopsy (day 467) and five metastatic biopsies (post mortem) a) To-scale phylogenetic tree of CRUK0063 including M-seq based on metastatic and primary tumor regions. Branch length is proportional to number of mutations in each subclone. b) Phylogenetic trees matching metastatic lesions, colored nodes represent mutation clusters found at each site and assayed for in ctDNA. Open circles represent mutation clusters not detected in ctDNA. c) Tracking plot showing mean VAF of identified mutation clusters in ctDNA. Size of dots indicates number of assays detected. Colors correspond to mutation clusters and match panels a) and b).

Comment in

References

    1. Jemal A, Bray F, Center MM, Ferlay J, Ward E, Forman D. Global cancer statistics. CA: A Cancer Journal for Clinicians. 2011;61(2):69–90. - PubMed
    1. Siegel RL, Miller KD, Jemal A. Cancer statistics, 2017. CA: A Cancer Journal for Clinicians. 2017;67(1):7–30. - PubMed
    1. Pignon J-P, Tribodet H, Scagliotti GV, Douillard J-Y, Shepherd FA, Stephens RJ, et al. Lung Adjuvant Cisplatin Evaluation: A Pooled Analysis by the LACE Collaborative Group. Journal of Clinical Oncology. 2008;26(21):3552–9. - PubMed
    1. Landau Dan A, Carter Scott L, Stojanov P, McKenna A, Stevenson K, Lawrence Michael S, et al. Evolution and Impact of Subclonal Mutations in Chronic Lymphocytic Leukemia. Cell. 152(4):714–26. - PMC - PubMed
    1. Beaver JA, Jelovac D, Balukrishna S, Cochran RL, Croessmann S, Zabransky DJ, et al. Detection of Cancer DNA in Plasma of Patients with Early-Stage Breast Cancer. Clinical Cancer Research. 2014;20(10):2643–50. - PMC - PubMed

Publication types

MeSH terms

Associated data